Talladega SnackAbility
Overall SnackAbility
Cost of living in Talladega summary. We use data on the cost of living to determine how expensive it is to live in Talladega. Real estate prices drive most of the variance in cost of living around Alabama. Key points include:
The cost of living in Talladega is 82 with 100 being average.
The cost of living in Talladega is 0.8x lower than the national average.
The median home value in Talladega is $143,575.
The median income in Talladega is $44,198.
Talladega's Overall Cost Of Living
Lower Than The National Average
Cost Of Living In Talladega Comparison Table
| Living Expense | Talladega | Alabama | National Average |
|---|---|---|---|
| Overall | 82 | 91 | 100 |
| Services | 94 | 95 | 100 |
| Groceries | 97 | 96 | 100 |
| Health | 51 | 74 | 100 |
| Housing | 97 | 96 | 100 |
| Transportation | 97 | 95 | 100 |
| Utilities | 93 | 95 | 100 |
Source: Cost of living index, normalized to US average = 100
Talladega, AL Weather
The average high in Talladega is 74.5° and the average low is 49.8°.
There are 77.8 days of precipitation each year.
Expect an average of 53.7 inches of precipitation each year with 1.1 inches of snow.
| Stat | Talladega |
|---|---|
| Average Annual High | 74.5 |
| Average Annual Low | 49.8 |
| Annual Precipitation Days | 77.8 |
| Average Annual Precipitation | 53.7 |
| Average Annual Snowfall | 1.1 |
Average High
Days of Rain
Source: NOAA climate normals (30-year)
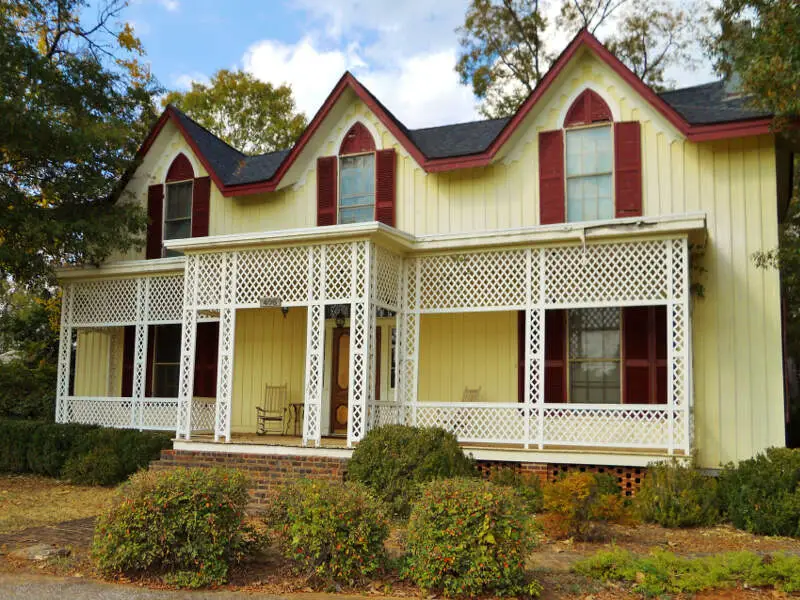
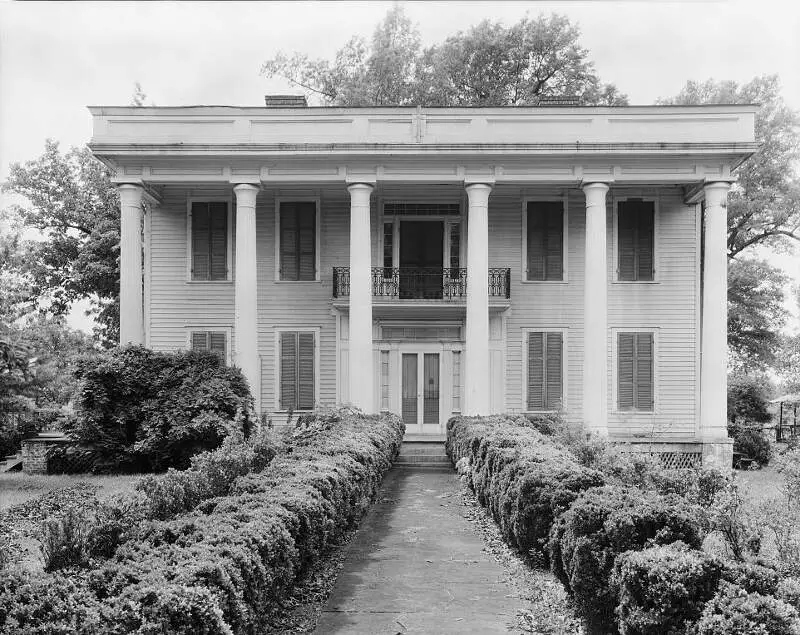
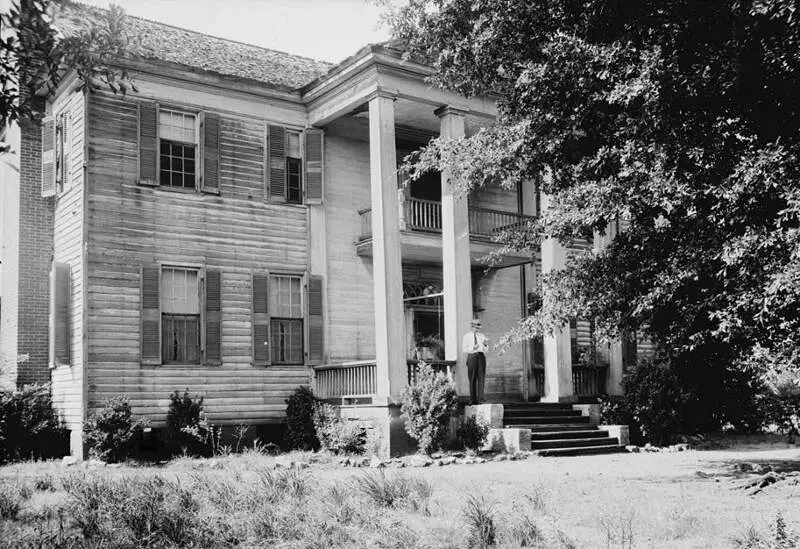
Talladega, AL Photos


Rankings & Articles For Talladega


Locations Around Talladega
Map Of Talladega, AL
Best Places Around Talladega
Gadsden, AL
Population 33,374
Anniston, AL
Population 21,271
Sylacauga, AL
Population 12,309
Jacksonville, AL
Population 14,437
Birmingham, AL
Population 198,173
Fairfield, AL
Population 9,728
Calera, AL
Population 17,714
Saks, AL
Population 10,681
Irondale, AL
Population 13,464
Moody, AL
Population 13,488
Talladega Demographics And Statistics
Population over time in Talladega
The current population in Talladega is 14,760. The population has decreased 7.7% from 2010.
| Year | Population | % Change |
|---|---|---|
| 2024 | 14,760 | -1.9% |
| 2023 | 15,041 | -0.2% |
| 2022 | 15,071 | -4.5% |
| 2021 | 15,782 | 2.4% |
| 2020 | 15,405 | -0.8% |
| 2019 | 15,522 | -0.6% |
| 2018 | 15,609 | -0.9% |
| 2017 | 15,747 | -0.3% |
| 2016 | 15,793 | -0.9% |
| 2015 | 15,931 | -0.6% |
| 2014 | 16,034 | 0.4% |
| 2013 | 15,966 | 1.4% |
| 2012 | 15,753 | -0.6% |
| 2011 | 15,854 | -0.9% |
| 2010 | 15,993 | - |
Race / Ethnicity in Talladega
See the full breakdown
Talladega is:
41.1% White with 6,066 White residents.
50.0% African American with 7,387 African American residents.
0.0% American Indian with 0 American Indian residents.
1.0% Asian with 146 Asian residents.
0.0% Hawaiian with 0 Hawaiian residents.
0.0% Other with 0 Other residents.
5.1% Two Or More with 757 Two Or More residents.
2.7% Hispanic with 404 Hispanic residents.
| Race | Talladega | AL | USA |
|---|---|---|---|
| White | 41.1% | 63.4% | 57.4% |
| African American | 50.0% | 25.6% | 11.9% |
| American Indian | 0.0% | 0.3% | 0.5% |
| Asian | 1.0% | 1.4% | 5.9% |
| Hawaiian | 0.0% | 0.0% | 0.2% |
| Other | 0.0% | 0.4% | 0.6% |
| Two Or More | 5.1% | 3.3% | 4.3% |
| Hispanic | 2.7% | 5.6% | 19.3% |
Gender in Talladega
See the full breakdown
Talladega is 49.5% female with 7,306 female residents.
Talladega is 50.5% male with 7,453 male residents.
| Gender | Talladega | AL | USA |
|---|---|---|---|
| Female | 49.5% | 51.4% | 50.5% |
| Male | 50.5% | 48.6% | 49.5% |
Highest level of educational attainment in Talladega for adults over 25
See the full breakdown
7.0% of adults in Talladega completed < 9th grade.
16.0% of adults in Talladega completed 9-12th grade.
40.0% of adults in Talladega completed high school / ged.
17.0% of adults in Talladega completed some college.
7.0% of adults in Talladega completed associate's degree.
8.0% of adults in Talladega completed bachelor's degree.
3.0% of adults in Talladega completed master's degree.
1.0% of adults in Talladega completed professional degree.
1.0% of adults in Talladega completed doctorate degree.
| Education | Talladega | AL | USA |
|---|---|---|---|
| < 9th Grade | 7.0% | 4.0% | 4.0% |
| 9-12th Grade | 16.0% | 8.0% | 6.0% |
| High School / GED | 40.0% | 30.0% | 26.0% |
| Some College | 17.0% | 21.0% | 19.0% |
| Associate's Degree | 7.0% | 9.0% | 9.0% |
| Bachelor's Degree | 8.0% | 17.0% | 22.0% |
| Master's Degree | 3.0% | 8.0% | 10.0% |
| Professional Degree | 1.0% | 2.0% | 2.0% |
| Doctorate Degree | 1.0% | 1.0% | 2.0% |
Household Income For Talladega, Alabama
See the full breakdown
8.8% of households in Talladega earn Less than $10,000.
8.8% of households in Talladega earn $10,000 to $14,999.
12.7% of households in Talladega earn $15,000 to $24,999.
10.6% of households in Talladega earn $25,000 to $34,999.
14.0% of households in Talladega earn $35,000 to $49,999.
13.2% of households in Talladega earn $50,000 to $74,999.
11.7% of households in Talladega earn $75,000 to $99,999.
13.2% of households in Talladega earn $100,000 to $149,999.
3.8% of households in Talladega earn $150,000 to $199,999.
3.3% of households in Talladega earn $200,000 or more.
| Income | Talladega | AL | USA |
|---|---|---|---|
| Less than $10,000 | 8.8% | 6.3% | 5.0% |
| $10,000 to $14,999 | 8.8% | 4.7% | 3.4% |
| $15,000 to $24,999 | 12.7% | 8.8% | 6.3% |
| $25,000 to $34,999 | 10.6% | 8.5% | 6.6% |
| $35,000 to $49,999 | 14.0% | 11.8% | 10.1% |
| $50,000 to $74,999 | 13.2% | 16.7% | 15.5% |
| $75,000 to $99,999 | 11.7% | 12.7% | 12.6% |
| $100,000 to $149,999 | 13.2% | 15.5% | 17.5% |
| $150,000 to $199,999 | 3.8% | 7.4% | 9.6% |
| $200,000 or more | 3.3% | 7.8% | 13.4% |
Source: U.S. Census ACS 5-year estimates (2024)


