Fayetteville SnackAbility
Overall SnackAbility
Crime in Fayetteville summary. We use data from the FBI to determine the crime rates in Fayetteville. Key points include:
There were 2,909 total crimes in Fayetteville in the last reporting year.
The overall crime rate per 100,000 people in Fayetteville is 2,794.7 / 100k people.
The violent crime rate per 100,000 people in Fayetteville is 423.7 / 100k people.
The property crime rate per 100,000 people in Fayetteville is 2,371.0 / 100k people.
Overall, crime in Fayetteville is 31.87% above the national average.
Total Crimes
Above National Average
Crime In Fayetteville Comparison Table
| Statistic | Count Raw |
Fayetteville / 100k People |
Arkansas / 100k People |
National / 100k People |
|---|---|---|---|---|
| Total Crimes Per 100K | 2,909 | 2,794.7 | 2,508.9 | 2,119.2 |
| Violent Crime | 441 | 423.7 | 579.4 | 359.0 |
| Murder | 8 | 7.7 | 7.3 | 5.0 |
| Robbery | 28 | 26.9 | 38.6 | 61.0 |
| Aggravated Assault | 350 | 336.3 | 463.5 | 256.0 |
| Property Crime | 2,468 | 2,371.0 | 1,929.5 | 1,760.0 |
| Burglary | 238 | 228.7 | 352.7 | 229.0 |
| Larceny | 2,024 | 1,944.5 | 1,400.0 | 1,272.0 |
| Car Theft | 206 | 197.9 | 176.8 | 259.0 |
Source: FBI Uniform Crime Reporting (2024)
Cost of living in Fayetteville summary. We use data on the cost of living to determine how expensive it is to live in Fayetteville. Real estate prices drive most of the variance in cost of living around Arkansas. Key points include:
The cost of living in Fayetteville is 101 with 100 being average.
The cost of living in Fayetteville is 1.0x higher than the national average.
The median home value in Fayetteville is $377,910.
The median income in Fayetteville is $62,695.
Fayetteville's Overall Cost Of Living
Higher Than The National Average
Cost Of Living In Fayetteville Comparison Table
| Living Expense | Fayetteville | Arkansas | National Average |
|---|---|---|---|
| Overall | 101 | 85 | 100 |
| Services | 95 | 95 | 100 |
| Groceries | 92 | 93 | 100 |
| Health | 119 | 68 | 100 |
| Housing | 94 | 96 | 100 |
| Transportation | 92 | 92 | 100 |
| Utilities | 93 | 92 | 100 |
Source: Cost of living index, normalized to US average = 100
Fayetteville, AR Weather
The average high in Fayetteville is 68.7° and the average low is 47.2°.
There are 69.0 days of precipitation each year.
Expect an average of 49.1 inches of precipitation each year with 6.6 inches of snow.
| Stat | Fayetteville |
|---|---|
| Average Annual High | 68.7 |
| Average Annual Low | 47.2 |
| Annual Precipitation Days | 69.0 |
| Average Annual Precipitation | 49.1 |
| Average Annual Snowfall | 6.6 |
Average High
Days of Rain
Source: NOAA climate normals (30-year)
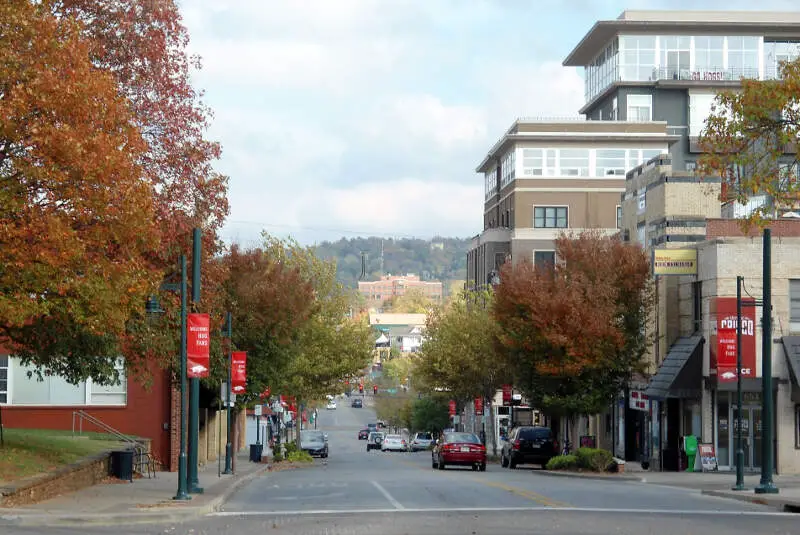
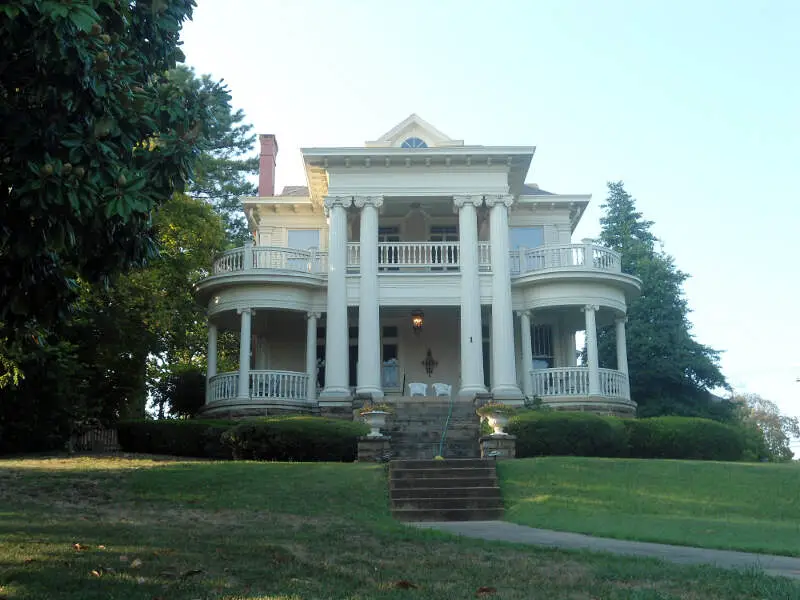
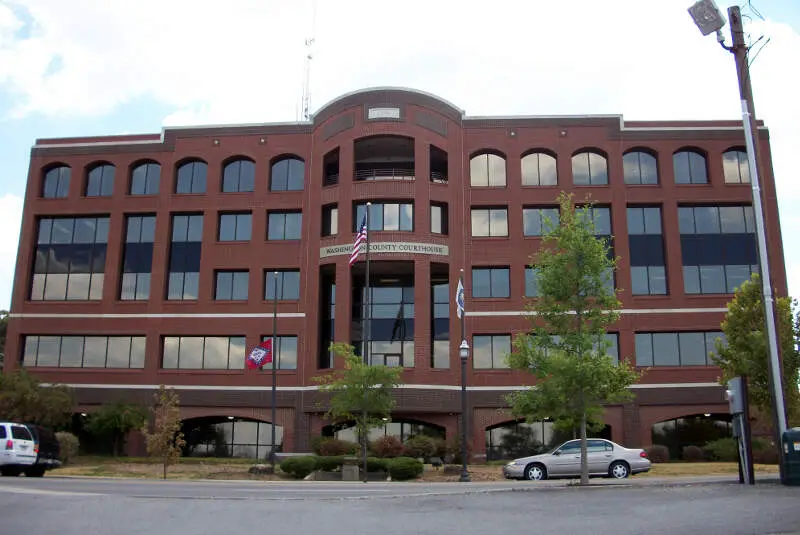
Fayetteville, AR Photos


4 Reviews & Comments About Fayetteville

Crime is increasing by the month and the crime rate is higher than most metro areas of the U.S. The influx of Texans and Oklahomans is partially to blame on that, as well as people that are being priced out of cities and are attracted to low cost of living, but that comes at a price to our area - it attracts people lacking in skills compared to others. Add to the fact that you drive 5 miles outside of Fayetteville, Springdale, Rogers and you are in hillbilly territory.
No diversity, very few good restaurants compared to the bigger cities. Good hiking, outdoors, but I'd wager only 15% of the people here actually do outdoor actitivies. We are the fattest state in the U.S.
Burglary/Theft is skyrocketing.. housing costs are increasing while wages are stagnant. Still no real good restaurants in the area, although if you're looking for pizza there's plenty of places. Area is good if you're an outdoorsman, but if you are not, then it is below average. Walmart and chicken farms dominate the industries, that and JB Hunt.
Watch out for the areas south of Fayetteville like Greenland, West Fork, etc., Big m**h problems there, lots of theft, breaking in, etc. Very bad schools except for Shiloh and Fayetteville High.
Lack of diversity, closeted racism, lots of delusion amongst residents. School is home to an average university and lots of economic disparity. Home of Walmart, so it's basically a slave to Walmart.
Bible Belt, poor schools, rising crime.
Bad schools, no diversity, rundown in many parts of town. Dominated by Walmart.
Watch out for the homeless and methheads. Also 5 miles outside of town is flooded with m**h labs.
Rankings & Articles For Fayetteville


Locations Around Fayetteville
Map Of Fayetteville, AR
Best Places Around Fayetteville
Springdale, AR
Population 88,160
Rogers, AR
Population 72,981
Bentonville, AR
Population 58,249
Van Buren, AR
Population 23,763
Siloam Springs, AR
Population 18,699
Centerton, AR
Population 21,920
Lowell, AR
Population 10,849
Tahlequah, OK
Population 16,935
Farmington, AR
Population 9,094
Fayetteville Demographics And Statistics
Population over time in Fayetteville
The current population in Fayetteville is 99,319. The population has increased 38.4% from 2010.
| Year | Population | % Change |
|---|---|---|
| 2024 | 99,319 | 2.2% |
| 2023 | 97,227 | 2.3% |
| 2022 | 95,022 | 3.2% |
| 2021 | 92,070 | 6.3% |
| 2020 | 86,622 | 1.7% |
| 2019 | 85,166 | 1.7% |
| 2018 | 83,736 | 2.3% |
| 2017 | 81,889 | 1.7% |
| 2016 | 80,552 | 1.9% |
| 2015 | 79,037 | 2.3% |
| 2014 | 77,264 | 2.2% |
| 2013 | 75,602 | 1.9% |
| 2012 | 74,191 | 1.8% |
| 2011 | 72,914 | 1.6% |
| 2010 | 71,770 | - |
Race / Ethnicity in Fayetteville
See the full breakdown
Fayetteville is:
70.0% White with 69,531 White residents.
4.8% African American with 4,807 African American residents.
0.5% American Indian with 536 American Indian residents.
2.4% Asian with 2,415 Asian residents.
0.8% Hawaiian with 777 Hawaiian residents.
0.2% Other with 176 Other residents.
12.1% Two Or More with 11,983 Two Or More residents.
9.2% Hispanic with 9,094 Hispanic residents.
| Race | Fayetteville | AR | USA |
|---|---|---|---|
| White | 70.0% | 67.4% | 57.4% |
| African American | 4.8% | 14.6% | 11.9% |
| American Indian | 0.5% | 0.3% | 0.5% |
| Asian | 2.4% | 1.6% | 5.9% |
| Hawaiian | 0.8% | 0.4% | 0.2% |
| Other | 0.2% | 0.3% | 0.6% |
| Two Or More | 12.1% | 6.3% | 4.3% |
| Hispanic | 9.2% | 9.0% | 19.3% |
Gender in Fayetteville
See the full breakdown
Fayetteville is 51.3% female with 50,917 female residents.
Fayetteville is 48.7% male with 48,402 male residents.
| Gender | Fayetteville | AR | USA |
|---|---|---|---|
| Female | 51.3% | 50.6% | 50.5% |
| Male | 48.7% | 49.4% | 49.5% |
Highest level of educational attainment in Fayetteville for adults over 25
See the full breakdown
2.0% of adults in Fayetteville completed < 9th grade.
3.0% of adults in Fayetteville completed 9-12th grade.
22.0% of adults in Fayetteville completed high school / ged.
17.0% of adults in Fayetteville completed some college.
7.0% of adults in Fayetteville completed associate's degree.
27.0% of adults in Fayetteville completed bachelor's degree.
15.0% of adults in Fayetteville completed master's degree.
3.0% of adults in Fayetteville completed professional degree.
4.0% of adults in Fayetteville completed doctorate degree.
| Education | Fayetteville | AR | USA |
|---|---|---|---|
| < 9th Grade | 2.0% | 5.0% | 4.0% |
| 9-12th Grade | 3.0% | 7.0% | 6.0% |
| High School / GED | 22.0% | 34.0% | 26.0% |
| Some College | 17.0% | 21.0% | 19.0% |
| Associate's Degree | 7.0% | 8.0% | 9.0% |
| Bachelor's Degree | 27.0% | 16.0% | 22.0% |
| Master's Degree | 15.0% | 7.0% | 10.0% |
| Professional Degree | 3.0% | 1.0% | 2.0% |
| Doctorate Degree | 4.0% | 1.0% | 2.0% |
Household Income For Fayetteville, Arkansas
See the full breakdown
7.5% of households in Fayetteville earn Less than $10,000.
4.1% of households in Fayetteville earn $10,000 to $14,999.
8.9% of households in Fayetteville earn $15,000 to $24,999.
8.0% of households in Fayetteville earn $25,000 to $34,999.
12.7% of households in Fayetteville earn $35,000 to $49,999.
14.6% of households in Fayetteville earn $50,000 to $74,999.
11.6% of households in Fayetteville earn $75,000 to $99,999.
14.9% of households in Fayetteville earn $100,000 to $149,999.
8.1% of households in Fayetteville earn $150,000 to $199,999.
9.7% of households in Fayetteville earn $200,000 or more.
| Income | Fayetteville | AR | USA |
|---|---|---|---|
| Less than $10,000 | 7.5% | 6.1% | 5.0% |
| $10,000 to $14,999 | 4.1% | 4.9% | 3.4% |
| $15,000 to $24,999 | 8.9% | 8.9% | 6.3% |
| $25,000 to $34,999 | 8.0% | 9.1% | 6.6% |
| $35,000 to $49,999 | 12.7% | 12.9% | 10.1% |
| $50,000 to $74,999 | 14.6% | 17.4% | 15.5% |
| $75,000 to $99,999 | 11.6% | 12.8% | 12.6% |
| $100,000 to $149,999 | 14.9% | 15.0% | 17.5% |
| $150,000 to $199,999 | 8.1% | 6.2% | 9.6% |
| $200,000 or more | 9.7% | 6.7% | 13.4% |
Source: U.S. Census ACS 5-year estimates (2024)


