Siloam Springs SnackAbility
Overall SnackAbility
Crime in Siloam Springs summary. We use data from the FBI to determine the crime rates in Siloam Springs. Key points include:
There were 370 total crimes in Siloam Springs in the last reporting year.
The overall crime rate per 100,000 people in Siloam Springs is 1,851.4 / 100k people.
The violent crime rate per 100,000 people in Siloam Springs is 495.4 / 100k people.
The property crime rate per 100,000 people in Siloam Springs is 1,356.0 / 100k people.
Overall, crime in Siloam Springs is -12.64% below the national average.
Total Crimes
Below National Average
Crime In Siloam Springs Comparison Table
| Statistic | Count Raw |
Siloam Springs / 100k People |
Arkansas / 100k People |
National / 100k People |
|---|---|---|---|---|
| Total Crimes Per 100K | 370 | 1,851.4 | 2,508.9 | 2,119.2 |
| Violent Crime | 99 | 495.4 | 579.4 | 359.0 |
| Murder | 0 | 0.0 | 7.3 | 5.0 |
| Robbery | 5 | 25.0 | 38.6 | 61.0 |
| Aggravated Assault | 78 | 390.3 | 463.5 | 256.0 |
| Property Crime | 271 | 1,356.0 | 1,929.5 | 1,760.0 |
| Burglary | 51 | 255.2 | 352.7 | 229.0 |
| Larceny | 199 | 995.7 | 1,400.0 | 1,272.0 |
| Car Theft | 21 | 105.1 | 176.8 | 259.0 |
Source: FBI Uniform Crime Reporting (2024)
Cost of living in Siloam Springs summary. We use data on the cost of living to determine how expensive it is to live in Siloam Springs. Real estate prices drive most of the variance in cost of living around Arkansas. Key points include:
The cost of living in Siloam Springs is 92 with 100 being average.
The cost of living in Siloam Springs is 0.9x lower than the national average.
The median home value in Siloam Springs is $284,970.
The median income in Siloam Springs is $72,065.
Siloam Springs's Overall Cost Of Living
Lower Than The National Average
Cost Of Living In Siloam Springs Comparison Table
| Living Expense | Siloam Springs | Arkansas | National Average |
|---|---|---|---|
| Overall | 92 | 85 | 100 |
| Services | 98 | 95 | 100 |
| Groceries | 96 | 93 | 100 |
| Health | 84 | 68 | 100 |
| Housing | 98 | 96 | 100 |
| Transportation | 94 | 92 | 100 |
| Utilities | 92 | 92 | 100 |
Source: Cost of living index, normalized to US average = 100
Siloam Springs, AR Weather
The average high in Siloam Springs is 68.7° and the average low is 46.4°.
There are 69.4 days of precipitation each year.
Expect an average of 47.0 inches of precipitation each year with 10.4 inches of snow.
| Stat | Siloam Springs |
|---|---|
| Average Annual High | 68.7 |
| Average Annual Low | 46.4 |
| Annual Precipitation Days | 69.4 |
| Average Annual Precipitation | 47.0 |
| Average Annual Snowfall | 10.4 |
Average High
Days of Rain
Source: NOAA climate normals (30-year)
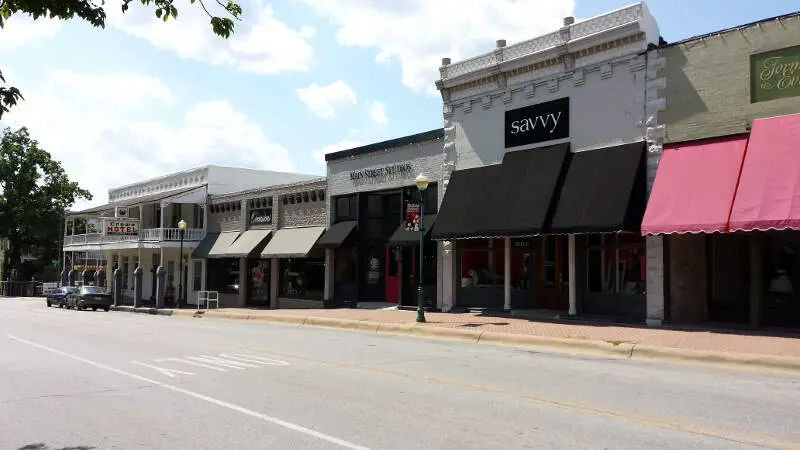
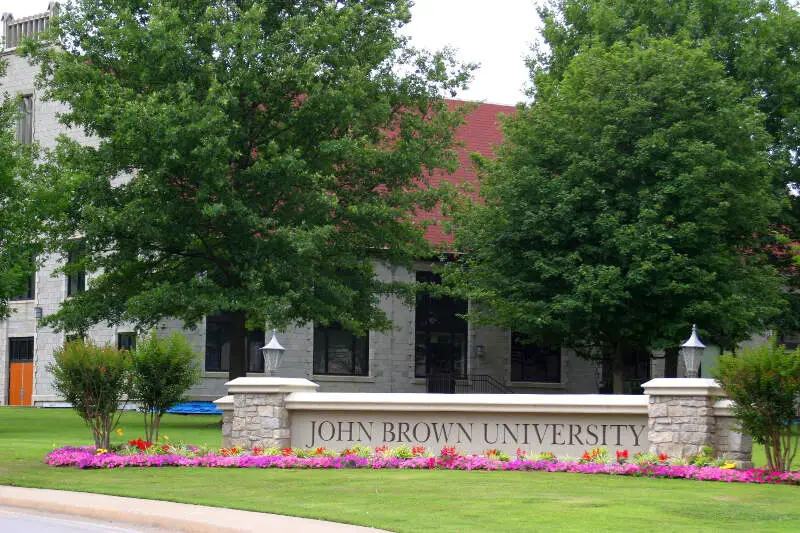
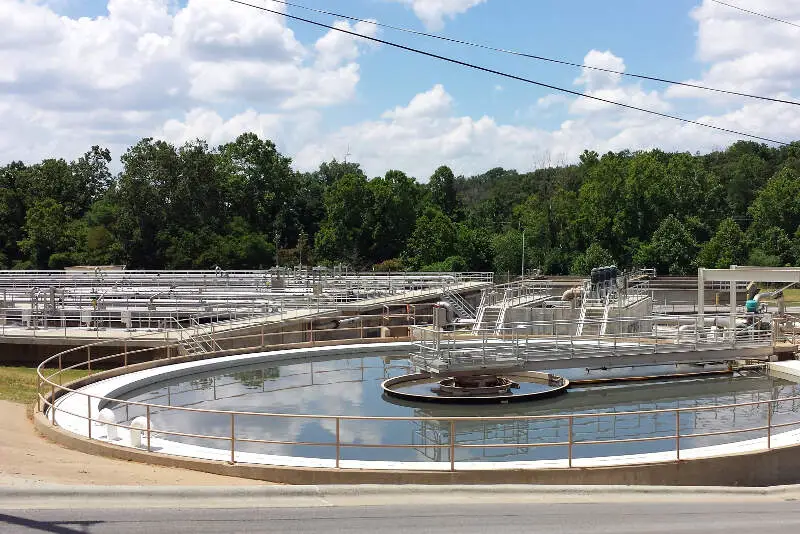
Siloam Springs, AR Photos

Rankings & Articles For Siloam Springs


Locations Around Siloam Springs
Map Of Siloam Springs, AR
Best Places Around Siloam Springs
Springdale, AR
Population 88,160
Rogers, AR
Population 72,981
Bentonville, AR
Population 58,249
Neosho, MO
Population 13,224
Fayetteville, AR
Population 99,319
Centerton, AR
Population 21,920
Pryor Creek, OK
Population 9,569
Lowell, AR
Population 10,849
Tahlequah, OK
Population 16,935
Siloam Springs Demographics And Statistics
Population over time in Siloam Springs
The current population in Siloam Springs is 18,699. The population has increased 30.1% from 2010.
| Year | Population | % Change |
|---|---|---|
| 2024 | 18,699 | 3.3% |
| 2023 | 18,096 | 2.6% |
| 2022 | 17,632 | 4.1% |
| 2021 | 16,944 | -0.5% |
| 2020 | 17,031 | 1.9% |
| 2019 | 16,715 | 0.9% |
| 2018 | 16,567 | 1.6% |
| 2017 | 16,311 | 1.3% |
| 2016 | 16,095 | 1.7% |
| 2015 | 15,832 | 1.4% |
| 2014 | 15,614 | 1.5% |
| 2013 | 15,378 | 1.8% |
| 2012 | 15,103 | 2.4% |
| 2011 | 14,756 | 2.7% |
| 2010 | 14,370 | - |
Race / Ethnicity in Siloam Springs
See the full breakdown
Siloam Springs is:
44.6% White with 8,340 White residents.
1.6% African American with 298 African American residents.
2.5% American Indian with 467 American Indian residents.
3.6% Asian with 681 Asian residents.
0.5% Hawaiian with 90 Hawaiian residents.
0.0% Other with 6 Other residents.
21.9% Two Or More with 4,086 Two Or More residents.
25.3% Hispanic with 4,731 Hispanic residents.
| Race | Siloam Springs | AR | USA |
|---|---|---|---|
| White | 44.6% | 67.4% | 57.4% |
| African American | 1.6% | 14.6% | 11.9% |
| American Indian | 2.5% | 0.3% | 0.5% |
| Asian | 3.6% | 1.6% | 5.9% |
| Hawaiian | 0.5% | 0.4% | 0.2% |
| Other | 0.0% | 0.3% | 0.6% |
| Two Or More | 21.9% | 6.3% | 4.3% |
| Hispanic | 25.3% | 9.0% | 19.3% |
Gender in Siloam Springs
See the full breakdown
Siloam Springs is 52.1% female with 9,740 female residents.
Siloam Springs is 47.9% male with 8,959 male residents.
| Gender | Siloam Springs | AR | USA |
|---|---|---|---|
| Female | 52.1% | 50.6% | 50.5% |
| Male | 47.9% | 49.4% | 49.5% |
Highest level of educational attainment in Siloam Springs for adults over 25
See the full breakdown
12.0% of adults in Siloam Springs completed < 9th grade.
7.0% of adults in Siloam Springs completed 9-12th grade.
33.0% of adults in Siloam Springs completed high school / ged.
16.0% of adults in Siloam Springs completed some college.
5.0% of adults in Siloam Springs completed associate's degree.
19.0% of adults in Siloam Springs completed bachelor's degree.
6.0% of adults in Siloam Springs completed master's degree.
1.0% of adults in Siloam Springs completed professional degree.
1.0% of adults in Siloam Springs completed doctorate degree.
| Education | Siloam Springs | AR | USA |
|---|---|---|---|
| < 9th Grade | 12.0% | 5.0% | 4.0% |
| 9-12th Grade | 7.0% | 7.0% | 6.0% |
| High School / GED | 33.0% | 34.0% | 26.0% |
| Some College | 16.0% | 21.0% | 19.0% |
| Associate's Degree | 5.0% | 8.0% | 9.0% |
| Bachelor's Degree | 19.0% | 16.0% | 22.0% |
| Master's Degree | 6.0% | 7.0% | 10.0% |
| Professional Degree | 1.0% | 1.0% | 2.0% |
| Doctorate Degree | 1.0% | 1.0% | 2.0% |
Household Income For Siloam Springs, Arkansas
See the full breakdown
5.4% of households in Siloam Springs earn Less than $10,000.
1.6% of households in Siloam Springs earn $10,000 to $14,999.
6.3% of households in Siloam Springs earn $15,000 to $24,999.
10.4% of households in Siloam Springs earn $25,000 to $34,999.
13.6% of households in Siloam Springs earn $35,000 to $49,999.
13.7% of households in Siloam Springs earn $50,000 to $74,999.
17.9% of households in Siloam Springs earn $75,000 to $99,999.
18.0% of households in Siloam Springs earn $100,000 to $149,999.
5.0% of households in Siloam Springs earn $150,000 to $199,999.
8.1% of households in Siloam Springs earn $200,000 or more.
| Income | Siloam Springs | AR | USA |
|---|---|---|---|
| Less than $10,000 | 5.4% | 6.1% | 5.0% |
| $10,000 to $14,999 | 1.6% | 4.9% | 3.4% |
| $15,000 to $24,999 | 6.3% | 8.9% | 6.3% |
| $25,000 to $34,999 | 10.4% | 9.1% | 6.6% |
| $35,000 to $49,999 | 13.6% | 12.9% | 10.1% |
| $50,000 to $74,999 | 13.7% | 17.4% | 15.5% |
| $75,000 to $99,999 | 17.9% | 12.8% | 12.6% |
| $100,000 to $149,999 | 18.0% | 15.0% | 17.5% |
| $150,000 to $199,999 | 5.0% | 6.2% | 9.6% |
| $200,000 or more | 8.1% | 6.7% | 13.4% |
Source: U.S. Census ACS 5-year estimates (2024)


