Compare Glendale to…
Glendale SnackAbility
Overall SnackAbility
Crime in Glendale summary. We use data from the FBI to determine the crime rates in Glendale. Key points include:
There were 8,072 total crimes in Glendale in the last reporting year.
The overall crime rate per 100,000 people in Glendale is 3,159.1 / 100k people.
The violent crime rate per 100,000 people in Glendale is 488.4 / 100k people.
The property crime rate per 100,000 people in Glendale is 2,670.7 / 100k people.
Overall, crime in Glendale is 49.07% above the national average.
Total Crimes
Above National Average
Crime In Glendale Comparison Table
| Statistic | Count Raw |
Glendale / 100k People |
Arizona / 100k People |
National / 100k People |
|---|---|---|---|---|
| Total Crimes Per 100K | 8,072 | 3,159.1 | 2,214.0 | 2,119.2 |
| Violent Crime | 1,248 | 488.4 | 421.9 | 359.0 |
| Murder | 20 | 7.8 | 4.9 | 5.0 |
| Robbery | 167 | 65.4 | 64.6 | 61.0 |
| Aggravated Assault | 914 | 357.7 | 312.4 | 256.0 |
| Property Crime | 6,824 | 2,670.7 | 1,792.1 | 1,760.0 |
| Burglary | 798 | 312.3 | 217.8 | 229.0 |
| Larceny | 4,906 | 1,920.1 | 1,329.9 | 1,272.0 |
| Car Theft | 1,120 | 438.3 | 244.4 | 259.0 |
Source: FBI Uniform Crime Reporting (2024)
Cost of living in Glendale summary. We use data on the cost of living to determine how expensive it is to live in Glendale. Real estate prices drive most of the variance in cost of living around Arizona. Key points include:
The cost of living in Glendale is 108 with 100 being average.
The cost of living in Glendale is 1.1x higher than the national average.
The median home value in Glendale is $407,332.
The median income in Glendale is $73,530.
Glendale's Overall Cost Of Living
Higher Than The National Average
Cost Of Living In Glendale Comparison Table
| Living Expense | Glendale | Arizona | National Average |
|---|---|---|---|
| Overall | 108 | 100 | 100 |
| Services | 106 | 99 | 100 |
| Groceries | 99 | 99 | 100 |
| Health | 123 | 97 | 100 |
| Housing | 101 | 104 | 100 |
| Transportation | 111 | 113 | 100 |
| Utilities | 98 | 104 | 100 |
Source: Cost of living index, normalized to US average = 100
Glendale, AZ Weather
The average high in Glendale is 85.8° and the average low is 58.1°.
There are 20.6 days of precipitation each year.
Expect an average of 9.3 inches of precipitation each year with 0.0 inches of snow.
| Stat | Glendale |
|---|---|
| Average Annual High | 85.8 |
| Average Annual Low | 58.1 |
| Annual Precipitation Days | 20.6 |
| Average Annual Precipitation | 9.3 |
| Average Annual Snowfall | 0.0 |
Average High
Days of Rain
Source: NOAA climate normals (30-year)
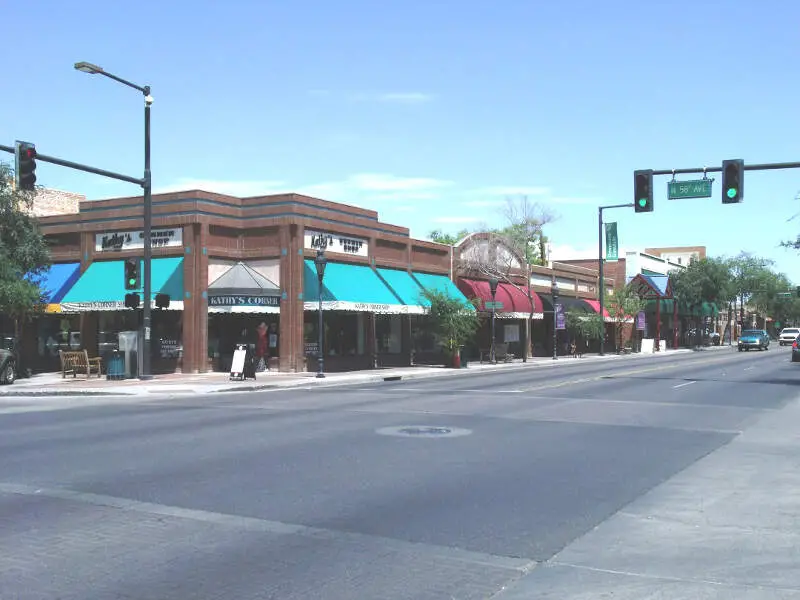
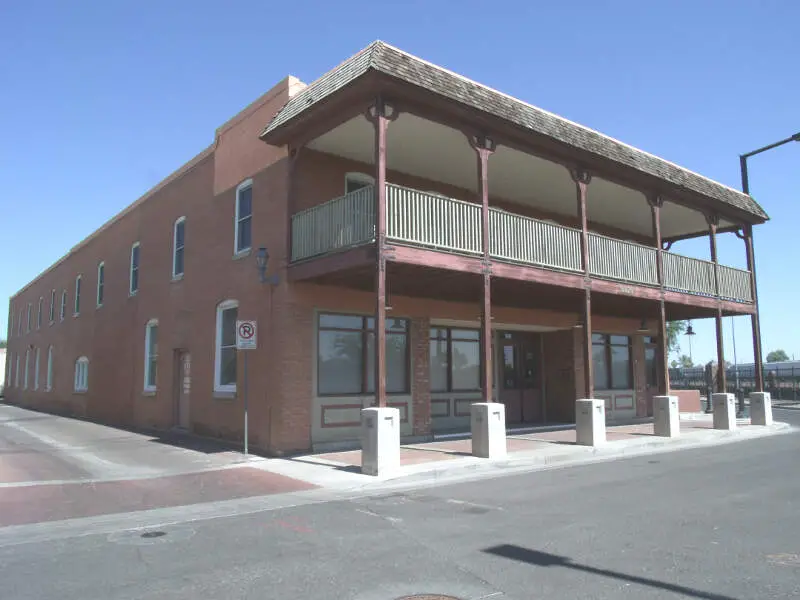
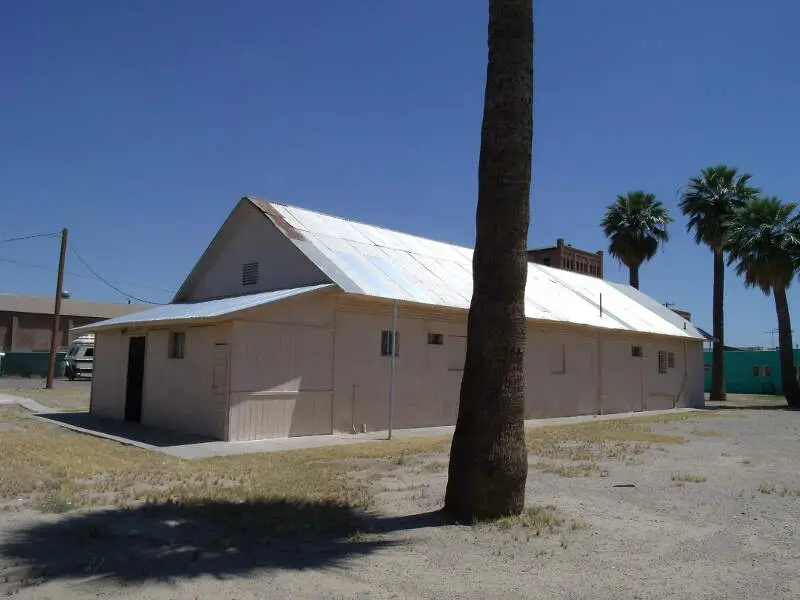
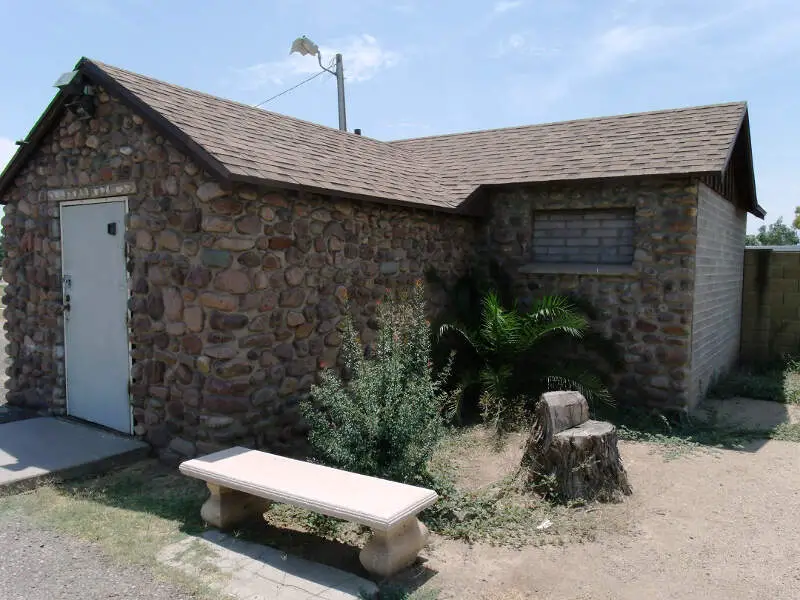
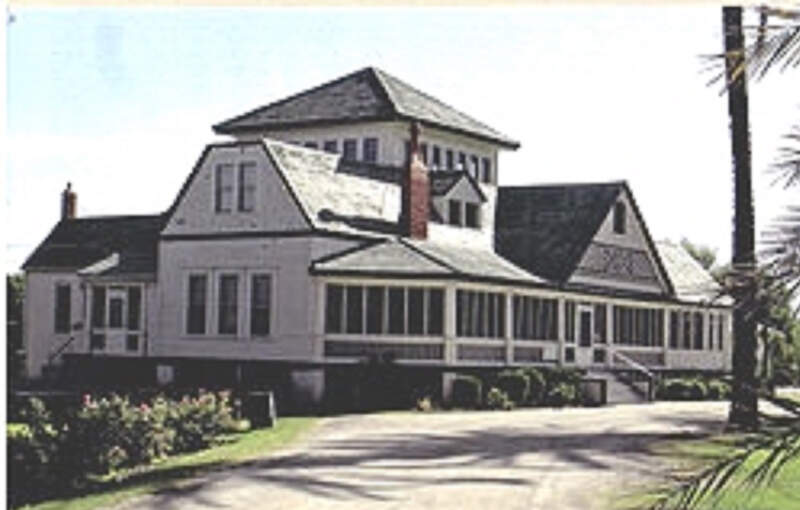
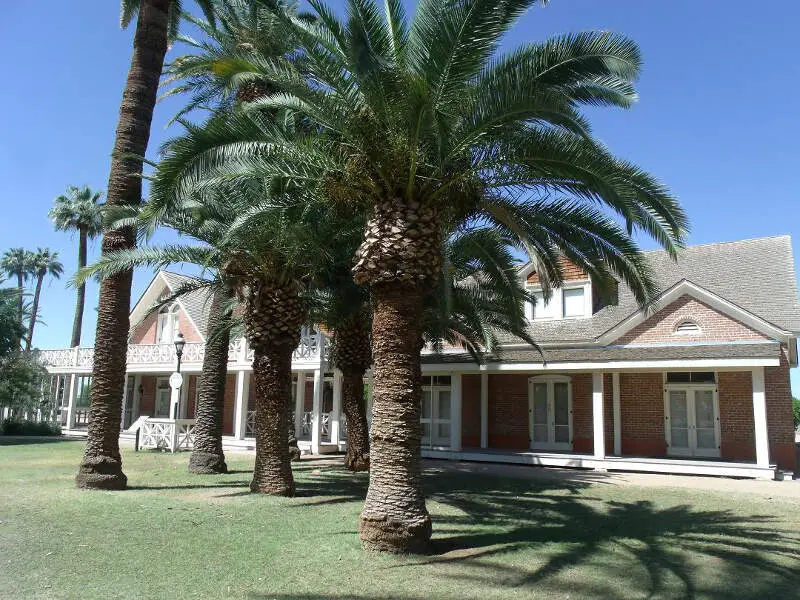
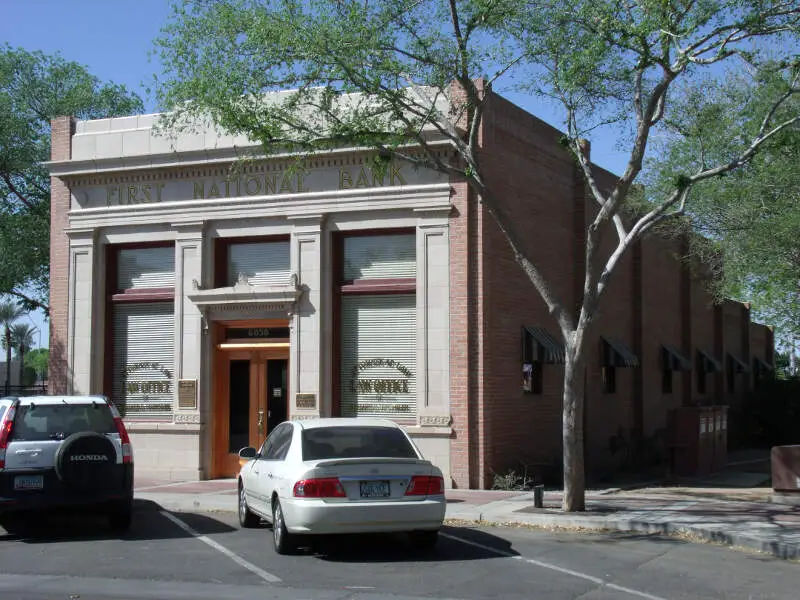
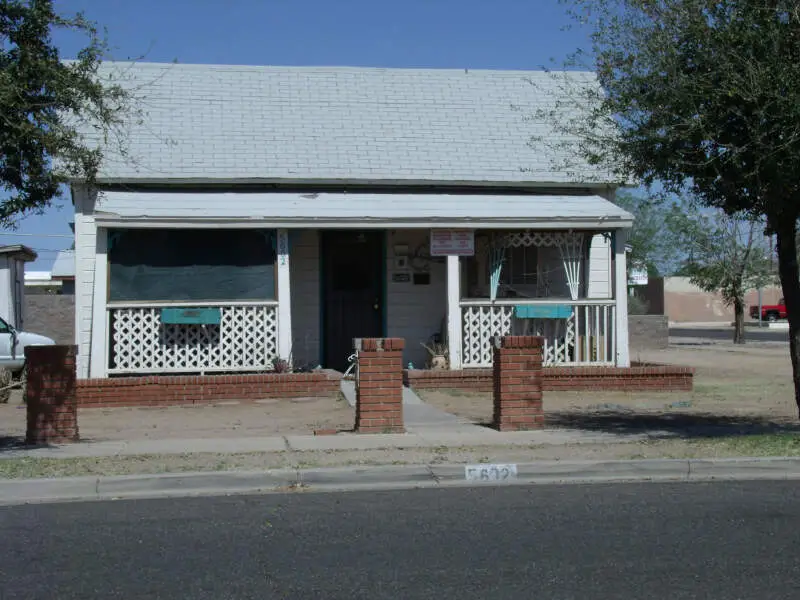
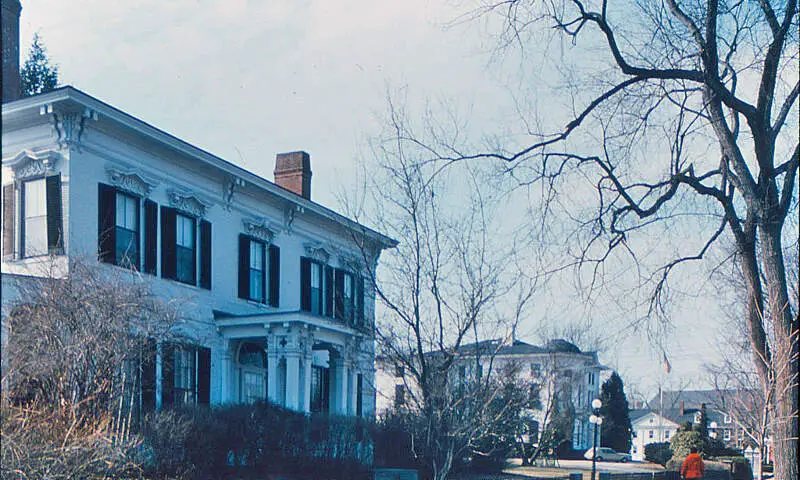
Glendale, AZ Photos

2 Reviews & Comments About Glendale

It has good schools, but the crime is pretty high
people are kind. High crime rate
We looked all around the Phoenix area before selecting Glendale. Close proximity to medical help was a must, as was easy access to shopping, entertainment and outdoor activities. Although we no longer have children in school, good schools were also a priority. To our surprise the church we were interested in, happens to almost be across the street. Having the feeling of space and being near the mountains was important to us as well, during our search. Our neighbors are wonderful and we have a lovely mountain view from our back patio. A quick drive/walk gets one to hiking and other outdoor activities. At this time, it does not feel as congested as other parts of the Phoenix area. City water was also a priority as some of the builders we looked at are subsidizing water costs. Later on that could become an expensive proposition. When asked what is not to like, I am still thinking about it and haven't come up with anything.
Our neighborhood nests up to a mountain and there is this wonderful feeling of openness. Homes and subdivisions around us are all well maintained and attractive. It seems all around there are beautiful views in every direction. On the downside, traffic here is crazy near the 101 access. At first we thought all of the wild, fast and rude drivers were in some of the more well to do areas, where we had vacationed, but it turns out they are out in force everywhere. At least AZ has tried to plan ahead for roads/routes to try to handle the traffic. Some of the large cities in the Midwest pale in comparison on that issue.
Rankings & Articles For Glendale


Locations Around Glendale
Map Of Glendale, AZ
Best Places Around Glendale
Litchfield Park, AZ
Population 6,916
Peoria, AZ
Population 196,906
Tempe, AZ
Population 188,065
Paradise Valley, AZ
Population 12,611
Surprise, AZ
Population 154,948
Phoenix, AZ
Population 1,642,323
Avondale, AZ
Population 92,477
El Mirage, AZ
Population 36,088
Guadalupe, AZ
Population 5,272
Tolleson, AZ
Population 7,668
Glendale Demographics And Statistics
Population over time in Glendale
The current population in Glendale is 252,833. The population has increased 10.1% from 2010.
| Year | Population | % Change |
|---|---|---|
| 2024 | 252,833 | 1.1% |
| 2023 | 250,193 | 0.9% |
| 2022 | 248,083 | 1.0% |
| 2021 | 245,685 | -1.8% |
| 2020 | 250,290 | 1.0% |
| 2019 | 247,813 | 0.9% |
| 2018 | 245,514 | 1.6% |
| 2017 | 241,543 | 0.7% |
| 2016 | 239,943 | 2.2% |
| 2015 | 234,844 | 1.2% |
| 2014 | 231,978 | 0.8% |
| 2013 | 230,047 | 0.3% |
| 2012 | 229,331 | -0.1% |
| 2011 | 229,611 | -0.0% |
| 2010 | 229,687 | - |
Race / Ethnicity in Glendale
See the full breakdown
Glendale is:
41.6% White with 105,161 White residents.
6.0% African American with 15,275 African American residents.
0.9% American Indian with 2,193 American Indian residents.
4.2% Asian with 10,707 Asian residents.
0.0% Hawaiian with 89 Hawaiian residents.
0.3% Other with 693 Other residents.
4.7% Two Or More with 11,992 Two Or More residents.
42.2% Hispanic with 106,723 Hispanic residents.
| Race | Glendale | AZ | USA |
|---|---|---|---|
| White | 41.6% | 52.6% | 57.4% |
| African American | 6.0% | 4.4% | 11.9% |
| American Indian | 0.9% | 3.2% | 0.5% |
| Asian | 4.2% | 3.5% | 5.9% |
| Hawaiian | 0.0% | 0.2% | 0.2% |
| Other | 0.3% | 0.5% | 0.6% |
| Two Or More | 4.7% | 4.4% | 4.3% |
| Hispanic | 42.2% | 31.4% | 19.3% |
Gender in Glendale
See the full breakdown
Glendale is 50.9% female with 128,641 female residents.
Glendale is 49.1% male with 124,191 male residents.
| Gender | Glendale | AZ | USA |
|---|---|---|---|
| Female | 50.9% | 50.1% | 50.5% |
| Male | 49.1% | 49.9% | 49.5% |
Highest level of educational attainment in Glendale for adults over 25
See the full breakdown
7.0% of adults in Glendale completed < 9th grade.
9.0% of adults in Glendale completed 9-12th grade.
28.0% of adults in Glendale completed high school / ged.
23.0% of adults in Glendale completed some college.
9.0% of adults in Glendale completed associate's degree.
16.0% of adults in Glendale completed bachelor's degree.
6.0% of adults in Glendale completed master's degree.
1.0% of adults in Glendale completed professional degree.
1.0% of adults in Glendale completed doctorate degree.
| Education | Glendale | AZ | USA |
|---|---|---|---|
| < 9th Grade | 7.0% | 6.0% | 4.0% |
| 9-12th Grade | 9.0% | 6.0% | 6.0% |
| High School / GED | 28.0% | 23.0% | 26.0% |
| Some College | 23.0% | 23.0% | 19.0% |
| Associate's Degree | 9.0% | 9.0% | 9.0% |
| Bachelor's Degree | 16.0% | 20.0% | 22.0% |
| Master's Degree | 6.0% | 9.0% | 10.0% |
| Professional Degree | 1.0% | 2.0% | 2.0% |
| Doctorate Degree | 1.0% | 2.0% | 2.0% |
Household Income For Glendale, Arizona
See the full breakdown
4.9% of households in Glendale earn Less than $10,000.
3.1% of households in Glendale earn $10,000 to $14,999.
5.8% of households in Glendale earn $15,000 to $24,999.
6.8% of households in Glendale earn $25,000 to $34,999.
10.9% of households in Glendale earn $35,000 to $49,999.
19.5% of households in Glendale earn $50,000 to $74,999.
14.1% of households in Glendale earn $75,000 to $99,999.
18.1% of households in Glendale earn $100,000 to $149,999.
8.6% of households in Glendale earn $150,000 to $199,999.
8.3% of households in Glendale earn $200,000 or more.
| Income | Glendale | AZ | USA |
|---|---|---|---|
| Less than $10,000 | 4.9% | 5.0% | 5.0% |
| $10,000 to $14,999 | 3.1% | 2.7% | 3.4% |
| $15,000 to $24,999 | 5.8% | 5.8% | 6.3% |
| $25,000 to $34,999 | 6.8% | 6.6% | 6.6% |
| $35,000 to $49,999 | 10.9% | 10.5% | 10.1% |
| $50,000 to $74,999 | 19.5% | 16.5% | 15.5% |
| $75,000 to $99,999 | 14.1% | 13.5% | 12.6% |
| $100,000 to $149,999 | 18.1% | 18.4% | 17.5% |
| $150,000 to $199,999 | 8.6% | 9.4% | 9.6% |
| $200,000 or more | 8.3% | 11.6% | 13.4% |
Source: U.S. Census ACS 5-year estimates (2024)


