Compare Mesa to…
Mesa SnackAbility
Overall SnackAbility
Crime in Mesa summary. We use data from the FBI to determine the crime rates in Mesa. Key points include:
There were 10,001 total crimes in Mesa in the last reporting year.
The overall crime rate per 100,000 people in Mesa is 1,947.3 / 100k people.
The violent crime rate per 100,000 people in Mesa is 482.7 / 100k people.
The property crime rate per 100,000 people in Mesa is 1,464.6 / 100k people.
Overall, crime in Mesa is -8.11% below the national average.
Total Crimes
Below National Average
Crime In Mesa Comparison Table
| Statistic | Count Raw |
Mesa / 100k People |
Arizona / 100k People |
National / 100k People |
|---|---|---|---|---|
| Total Crimes Per 100K | 10,001 | 1,947.3 | 2,214.0 | 2,119.2 |
| Violent Crime | 2,479 | 482.7 | 421.9 | 359.0 |
| Murder | 14 | 2.7 | 4.9 | 5.0 |
| Robbery | 258 | 50.2 | 64.6 | 61.0 |
| Aggravated Assault | 1,980 | 385.5 | 312.4 | 256.0 |
| Property Crime | 7,522 | 1,464.6 | 1,792.1 | 1,760.0 |
| Burglary | 964 | 187.7 | 217.8 | 229.0 |
| Larceny | 5,539 | 1,078.5 | 1,329.9 | 1,272.0 |
| Car Theft | 1,019 | 198.4 | 244.4 | 259.0 |
Source: FBI Uniform Crime Reporting (2024)
Cost of living in Mesa summary. We use data on the cost of living to determine how expensive it is to live in Mesa. Real estate prices drive most of the variance in cost of living around Arizona. Key points include:
The cost of living in Mesa is 112 with 100 being average.
The cost of living in Mesa is 1.1x higher than the national average.
The median home value in Mesa is $435,133.
The median income in Mesa is $82,752.
Mesa's Overall Cost Of Living
Higher Than The National Average
Cost Of Living In Mesa Comparison Table
| Living Expense | Mesa | Arizona | National Average |
|---|---|---|---|
| Overall | 112 | 100 | 100 |
| Services | 105 | 99 | 100 |
| Groceries | 105 | 99 | 100 |
| Health | 132 | 97 | 100 |
| Housing | 102 | 104 | 100 |
| Transportation | 113 | 113 | 100 |
| Utilities | 102 | 104 | 100 |
Source: Cost of living index, normalized to US average = 100
Mesa, AZ Weather
The average high in Mesa is 85.8° and the average low is 58.1°.
There are 20.6 days of precipitation each year.
Expect an average of 9.3 inches of precipitation each year with 0.0 inches of snow.
| Stat | Mesa |
|---|---|
| Average Annual High | 85.8 |
| Average Annual Low | 58.1 |
| Annual Precipitation Days | 20.6 |
| Average Annual Precipitation | 9.3 |
| Average Annual Snowfall | 0.0 |
Average High
Days of Rain
Source: NOAA climate normals (30-year)
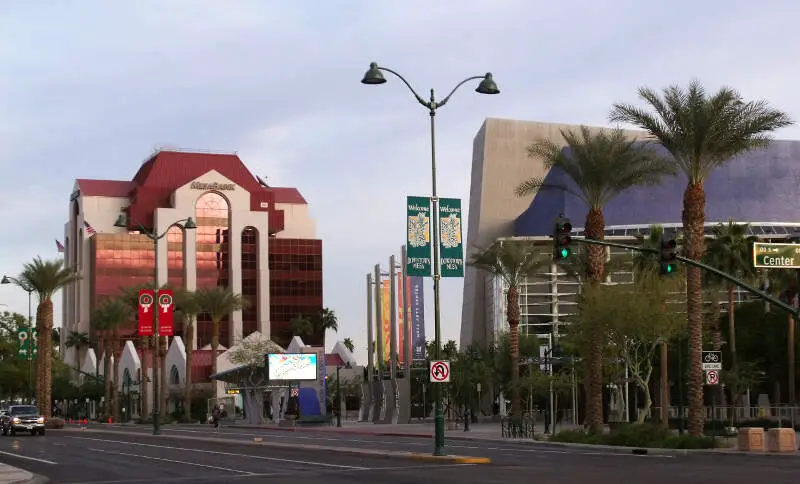
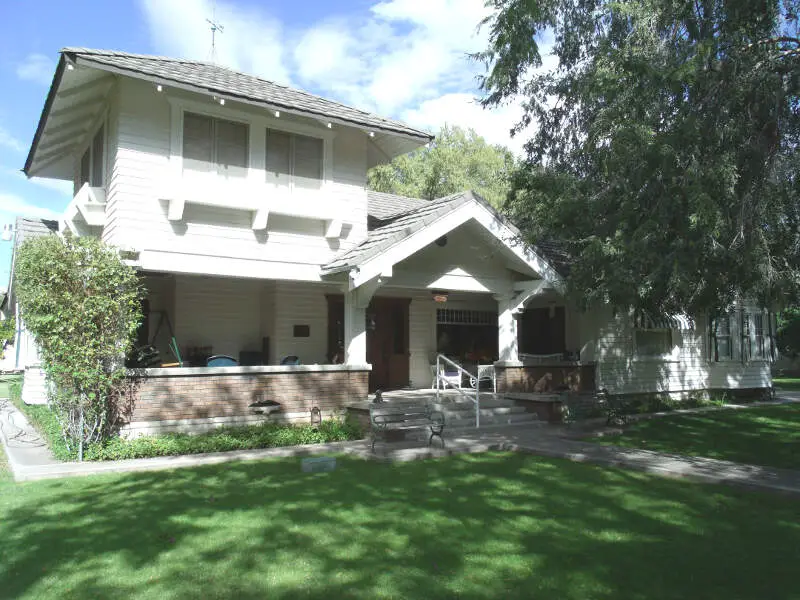
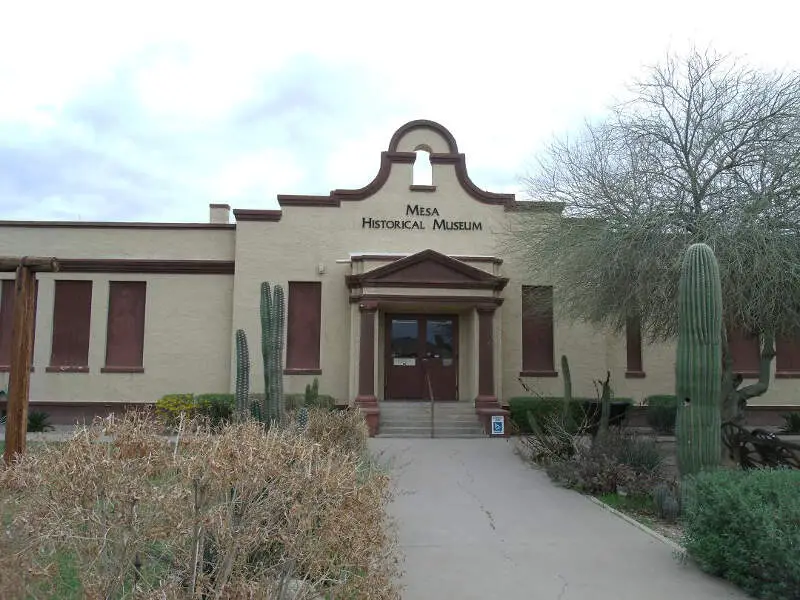
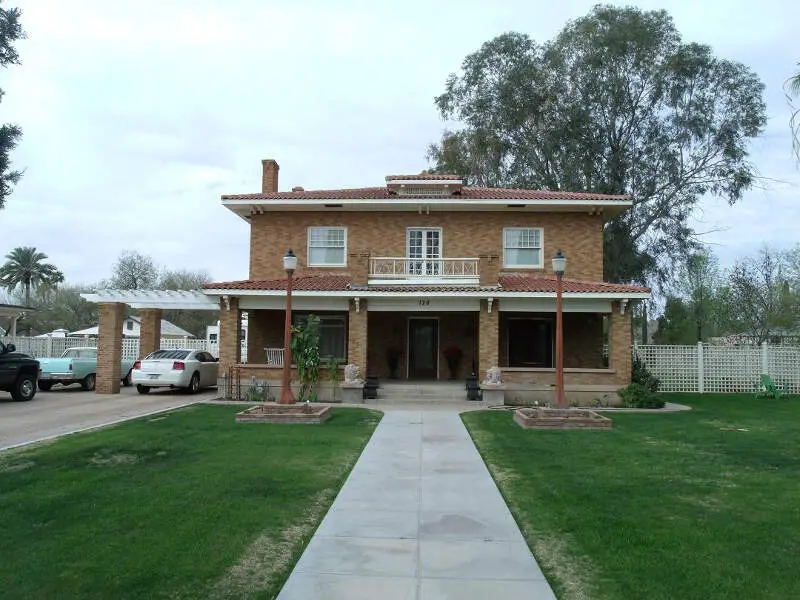
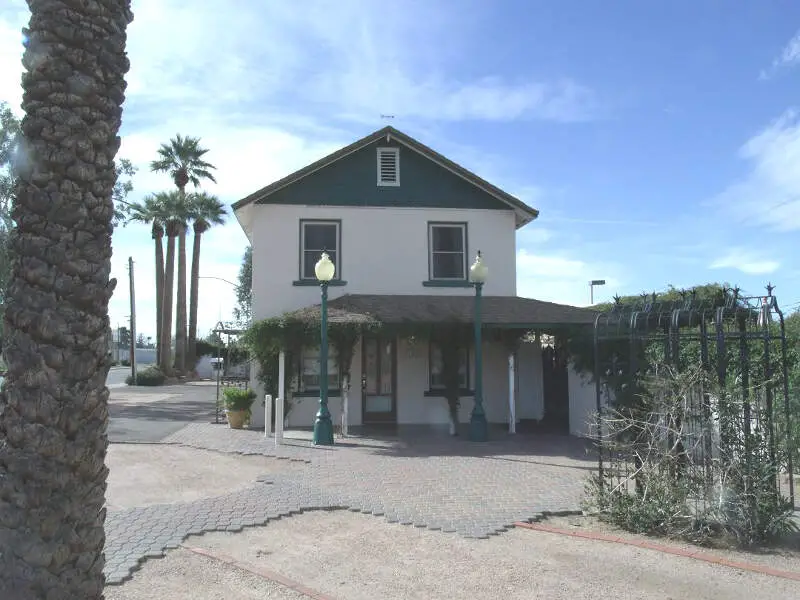
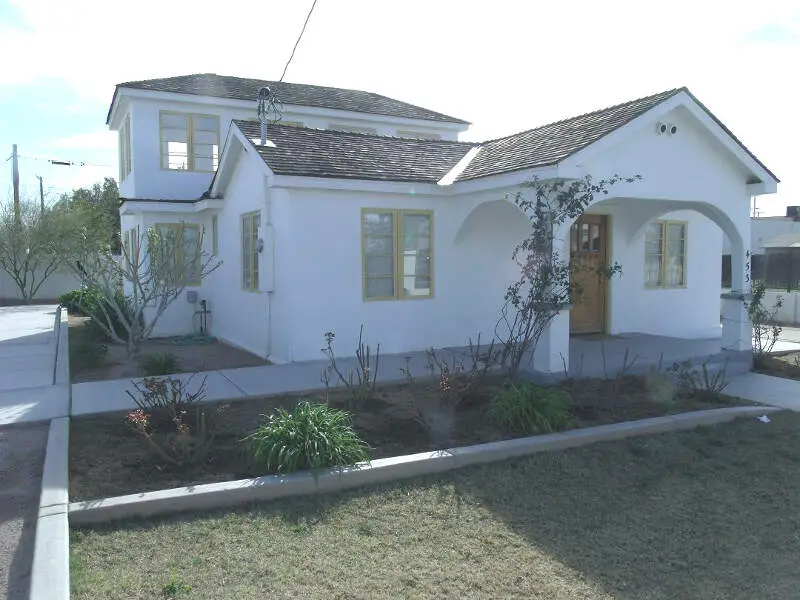
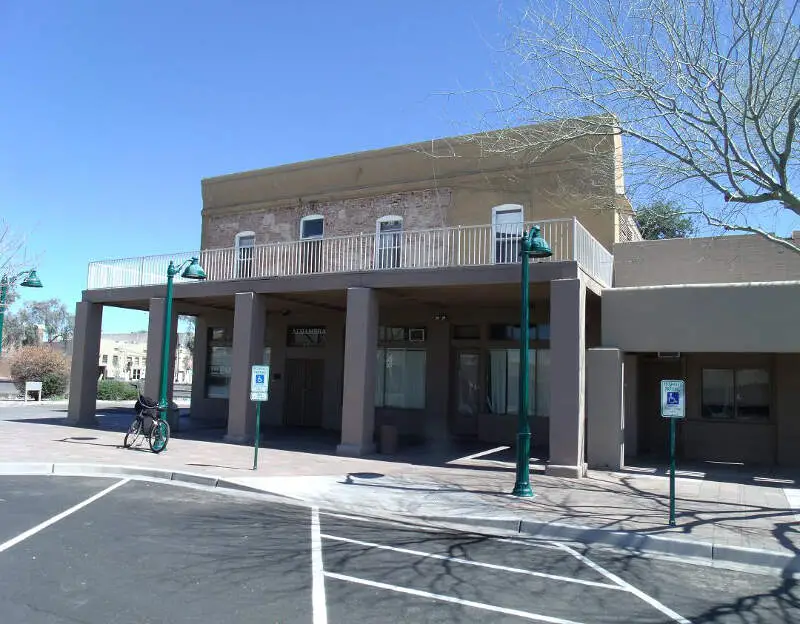
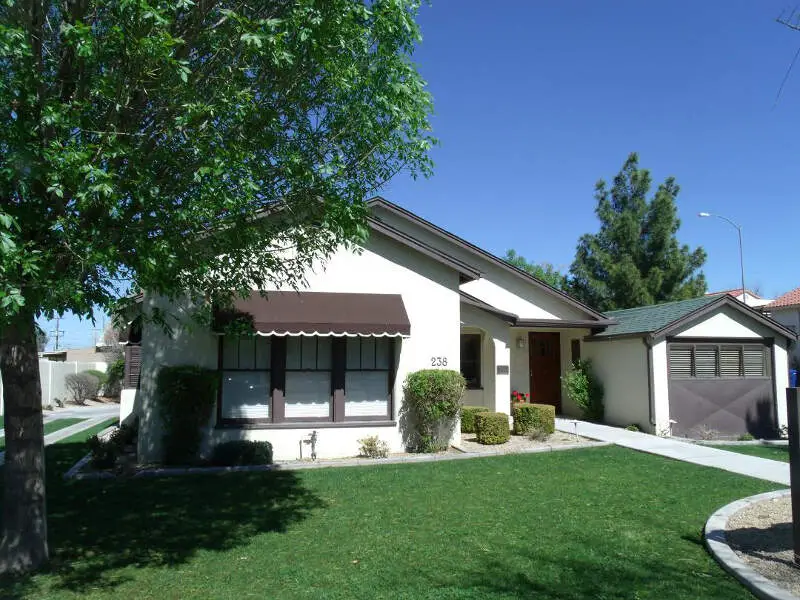
Mesa, AZ Photos
1 Reviews & Comments About Mesa

The crime rate in my neighborhood is low. The schools are great. And there are plenty to do. There's a water park, laser tag, movies, bowling, and an arcade, not to mention libraries and parks.
Water parks and swimming pools are a great way to keep cool.
Rankings & Articles For Mesa


Locations Around Mesa
Map Of Mesa, AZ
Best Places Around Mesa
Gilbert, AZ
Population 280,262
Fountain Hills, AZ
Population 23,789
Chandler, AZ
Population 280,136
Sun Lakes, AZ
Population 13,924
Queen Creek, AZ
Population 71,867
Tempe, AZ
Population 188,065
Gold Canyon, AZ
Population 13,107
Paradise Valley, AZ
Population 12,611
San Tan Valley, AZ
Population 109,189
Goodyear, AZ
Population 107,645
Mesa Demographics And Statistics
Population over time in Mesa
The current population in Mesa is 511,764. The population has increased 16.4% from 2010.
| Year | Population | % Change |
|---|---|---|
| 2024 | 511,764 | 0.8% |
| 2023 | 507,478 | 0.8% |
| 2022 | 503,390 | 1.1% |
| 2021 | 497,752 | -2.2% |
| 2020 | 508,918 | 1.8% |
| 2019 | 499,720 | 1.7% |
| 2018 | 491,194 | 2.5% |
| 2017 | 479,317 | 1.9% |
| 2016 | 470,456 | 2.5% |
| 2015 | 458,860 | 1.5% |
| 2014 | 452,091 | 1.1% |
| 2013 | 447,002 | 0.7% |
| 2012 | 443,875 | 0.5% |
| 2011 | 441,711 | 0.5% |
| 2010 | 439,639 | - |
Race / Ethnicity in Mesa
See the full breakdown
Mesa is:
60.1% White with 307,620 White residents.
3.7% African American with 18,986 African American residents.
1.3% American Indian with 6,618 American Indian residents.
2.4% Asian with 12,492 Asian residents.
0.2% Hawaiian with 1,234 Hawaiian residents.
0.5% Other with 2,376 Other residents.
4.8% Two Or More with 24,746 Two Or More residents.
26.9% Hispanic with 137,692 Hispanic residents.
| Race | Mesa | AZ | USA |
|---|---|---|---|
| White | 60.1% | 52.6% | 57.4% |
| African American | 3.7% | 4.4% | 11.9% |
| American Indian | 1.3% | 3.2% | 0.5% |
| Asian | 2.4% | 3.5% | 5.9% |
| Hawaiian | 0.2% | 0.2% | 0.2% |
| Other | 0.5% | 0.5% | 0.6% |
| Two Or More | 4.8% | 4.4% | 4.3% |
| Hispanic | 26.9% | 31.4% | 19.3% |
Gender in Mesa
See the full breakdown
Mesa is 50.0% female with 255,830 female residents.
Mesa is 50.0% male with 255,933 male residents.
| Gender | Mesa | AZ | USA |
|---|---|---|---|
| Female | 50.0% | 50.1% | 50.5% |
| Male | 50.0% | 49.9% | 49.5% |
Highest level of educational attainment in Mesa for adults over 25
See the full breakdown
4.0% of adults in Mesa completed < 9th grade.
5.0% of adults in Mesa completed 9-12th grade.
24.0% of adults in Mesa completed high school / ged.
25.0% of adults in Mesa completed some college.
10.0% of adults in Mesa completed associate's degree.
21.0% of adults in Mesa completed bachelor's degree.
8.0% of adults in Mesa completed master's degree.
2.0% of adults in Mesa completed professional degree.
1.0% of adults in Mesa completed doctorate degree.
| Education | Mesa | AZ | USA |
|---|---|---|---|
| < 9th Grade | 4.0% | 6.0% | 4.0% |
| 9-12th Grade | 5.0% | 6.0% | 6.0% |
| High School / GED | 24.0% | 23.0% | 26.0% |
| Some College | 25.0% | 23.0% | 19.0% |
| Associate's Degree | 10.0% | 9.0% | 9.0% |
| Bachelor's Degree | 21.0% | 20.0% | 22.0% |
| Master's Degree | 8.0% | 9.0% | 10.0% |
| Professional Degree | 2.0% | 2.0% | 2.0% |
| Doctorate Degree | 1.0% | 2.0% | 2.0% |
Household Income For Mesa, Arizona
See the full breakdown
4.1% of households in Mesa earn Less than $10,000.
2.1% of households in Mesa earn $10,000 to $14,999.
5.2% of households in Mesa earn $15,000 to $24,999.
6.1% of households in Mesa earn $25,000 to $34,999.
11.0% of households in Mesa earn $35,000 to $49,999.
17.0% of households in Mesa earn $50,000 to $74,999.
14.5% of households in Mesa earn $75,000 to $99,999.
19.9% of households in Mesa earn $100,000 to $149,999.
9.9% of households in Mesa earn $150,000 to $199,999.
10.3% of households in Mesa earn $200,000 or more.
| Income | Mesa | AZ | USA |
|---|---|---|---|
| Less than $10,000 | 4.1% | 5.0% | 5.0% |
| $10,000 to $14,999 | 2.1% | 2.7% | 3.4% |
| $15,000 to $24,999 | 5.2% | 5.8% | 6.3% |
| $25,000 to $34,999 | 6.1% | 6.6% | 6.6% |
| $35,000 to $49,999 | 11.0% | 10.5% | 10.1% |
| $50,000 to $74,999 | 17.0% | 16.5% | 15.5% |
| $75,000 to $99,999 | 14.5% | 13.5% | 12.6% |
| $100,000 to $149,999 | 19.9% | 18.4% | 17.5% |
| $150,000 to $199,999 | 9.9% | 9.4% | 9.6% |
| $200,000 or more | 10.3% | 11.6% | 13.4% |
Source: U.S. Census ACS 5-year estimates (2024)


