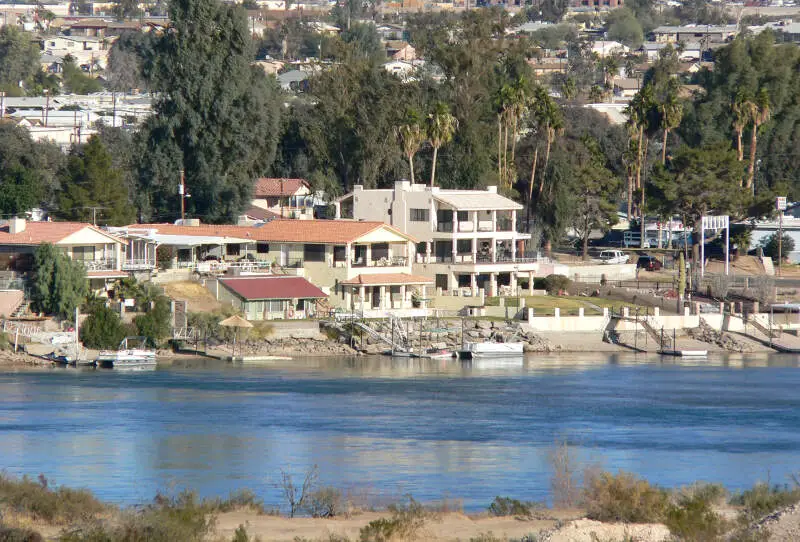

Life in Mohave County research summary. HomeSnacks has been researching the quality of life in Mohave County over the past eight years using Census data, FBI crime data, cost of living data, and other primary sources. Based on the most recently available data, we found the following about life in Mohave County:
The population in Mohave County is 214,229.
The median home value in Mohave County is $349,990.
The median income in Mohave County is $53,592.
The median rent in Mohave County is $976.
The unemployment rate in Mohave County is 7.5%.
The poverty rate in Mohave County is 16.0%.
The average high in Mohave County is 85.4° and there are 18.3 inches of rainfall annually.
The average high in Mohave County is 85.4°.
There are 63.72 nice days each year.
Expect an average of 18.3 inches of rain each year with 0.8 inches of snow.
There is an average of 8:52 hours of sun each day in Mohave County.
| Stat | Mohave County |
|---|---|
| Mean High | 85.4 |
| Nice Days | 63.72 |
| Rainfall | 18.3 |
| Snowfall | 0.8 |
| Sunny_hours | 8:52 |


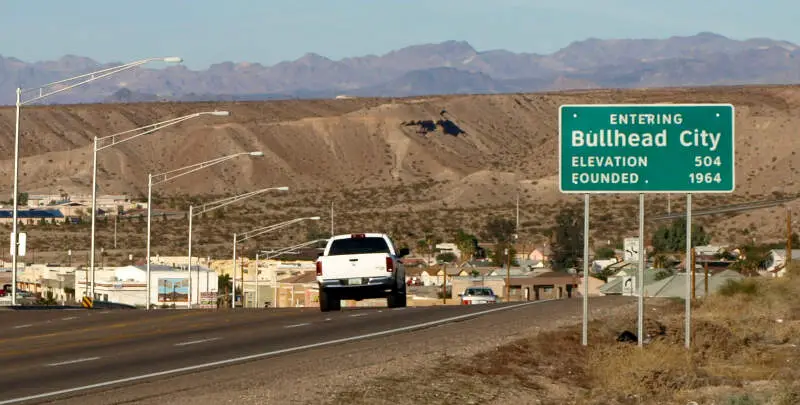
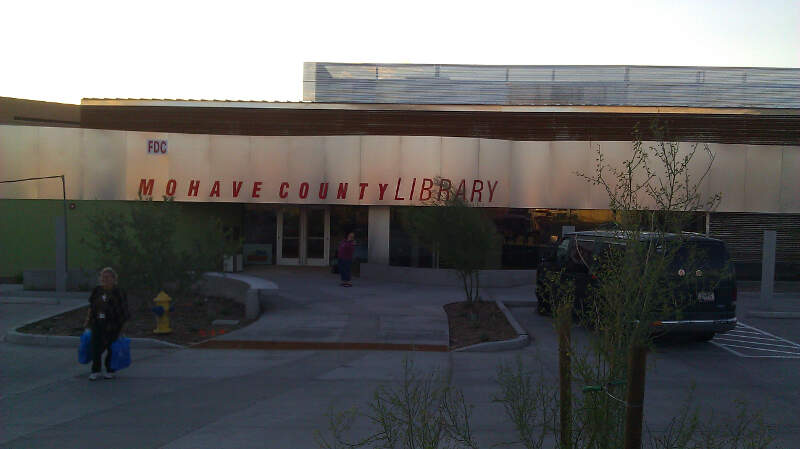
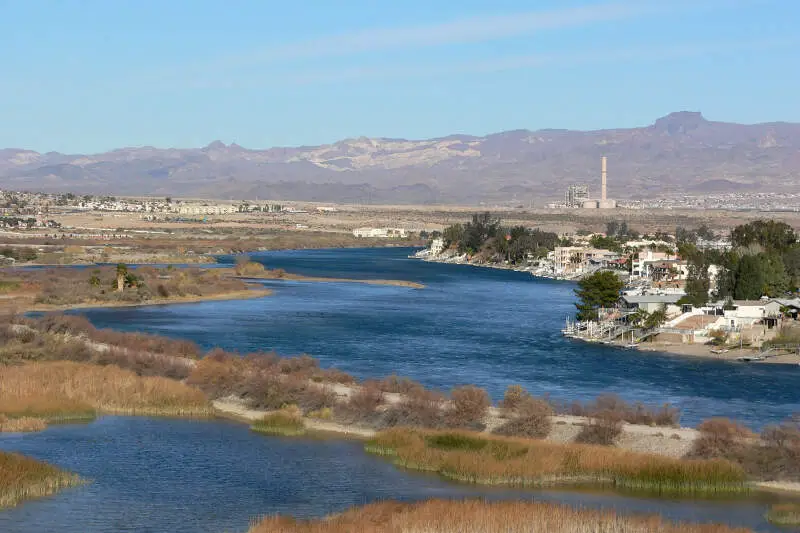
The current population in Mohave County is 214,229. The population has increased 1.7% from 2019.
| Year | Population | % Change |
|---|---|---|
| 2022 | 211,274 | 0.1% |
| 2021 | 210,998 | 1.6% |
| 2020 | 207,695 | - |
Mohave County is 49.3% female with 105,551 female residents.
Mohave County is 50.7% male with 108,677 male residents.
| Gender | Mohave County | AZ | USA |
|---|---|---|---|
| Female | 49.3% | 50.0% | 50.4% |
| Male | 50.7% | 50.0% | 49.6% |
Mohave County is:
75.5% White with 161,721 White residents.
1.1% African American with 2,312 African American residents.
1.5% American Indian with 3,215 American Indian residents.
1.1% Asian with 2,294 Asian residents.
0.2% Hawaiian with 442 Hawaiian residents.
0.1% Other with 308 Other residents.
3.1% Two Or More with 6,719 Two Or More residents.
17.4% Hispanic with 37,218 Hispanic residents.
| Race | Mohave County | AZ | USA |
|---|---|---|---|
| White | 75.5% | 53.0% | 58.9% |
| African American | 1.1% | 4.3% | 12.1% |
| American Indian | 1.5% | 3.5% | 0.6% |
| Asian | 1.1% | 3.3% | 5.7% |
| Hawaiian | 0.2% | 0.2% | 0.2% |
| Other | 0.1% | 0.3% | 0.4% |
| Two Or More | 3.1% | 3.4% | 3.5% |
| Hispanic | 17.4% | 32.0% | 18.7% |
5.7% of households in Mohave County earn Less than $10,000.
4.8% of households in Mohave County earn $10,000 to $14,999.
10.8% of households in Mohave County earn $15,000 to $24,999.
11.3% of households in Mohave County earn $25,000 to $34,999.
14.1% of households in Mohave County earn $35,000 to $49,999.
19.9% of households in Mohave County earn $50,000 to $74,999.
12.2% of households in Mohave County earn $75,000 to $99,999.
13.3% of households in Mohave County earn $100,000 to $149,999.
4.0% of households in Mohave County earn $150,000 to $199,999.
4.0% of households in Mohave County earn $200,000 or more.
| Income | Mohave County | AZ | USA |
|---|---|---|---|
| Less than $10,000 | 5.7% | 4.9% | 4.9% |
| $10,000 to $14,999 | 4.8% | 3.1% | 3.8% |
| $15,000 to $24,999 | 10.8% | 6.7% | 7.0% |
| $25,000 to $34,999 | 11.3% | 7.7% | 7.4% |
| $35,000 to $49,999 | 14.1% | 11.5% | 10.7% |
| $50,000 to $74,999 | 19.9% | 17.6% | 16.1% |
| $75,000 to $99,999 | 12.2% | 13.7% | 12.8% |
| $100,000 to $149,999 | 13.3% | 17.3% | 17.1% |
| $150,000 to $199,999 | 4.0% | 8.3% | 8.8% |
| $200,000 or more | 4.0% | 9.2% | 11.4% |
3.0% of adults in Mohave County completed < 9th grade.
9.0% of adults in Mohave County completed 9-12th grade.
34.0% of adults in Mohave County completed high school / ged.
30.0% of adults in Mohave County completed some college.
9.0% of adults in Mohave County completed associate's degree.
9.0% of adults in Mohave County completed bachelor's degree.
4.0% of adults in Mohave County completed master's degree.
1.0% of adults in Mohave County completed professional degree.
1.0% of adults in Mohave County completed doctorate degree.
| Education | Mohave County | AZ | USA |
|---|---|---|---|
| < 9th Grade | 3% | 5% | 3% |
| 9-12th Grade | 9% | 6% | 6% |
| High School / GED | 34% | 24% | 26% |
| Some College | 30% | 24% | 20% |
| Associate's Degree | 9% | 9% | 9% |
| Bachelor's Degree | 9% | 20% | 21% |
| Master's Degree | 4% | 9% | 10% |
| Professional Degree | 1% | 2% | 2% |
| Doctorate Degree | 1% | 1% | 2% |
HomeSnacks is based in Durham, NC.
We aim to deliver bite-sized pieces of infotainment about where you live.
We use data, analytics, and a sense of humor to determine quality of life for places across the nation.