Racial diversity in Arizona is a mixed bag.
There are parts of Arizona where there’s a high level of diversity. But where will you find the most diverse places in Arizona?
To answer that question, we went to the US Census data. Using Saturday Night Science, we measured the Gini coefficient for all 56 cities in Arizona to rank them from most to least diverse.
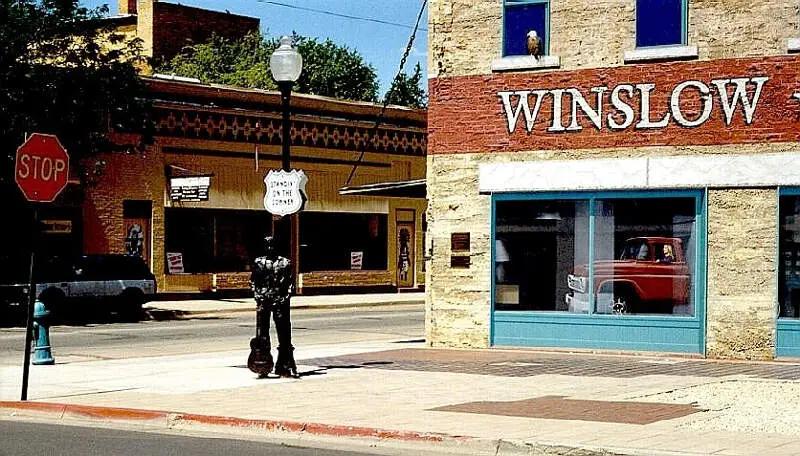
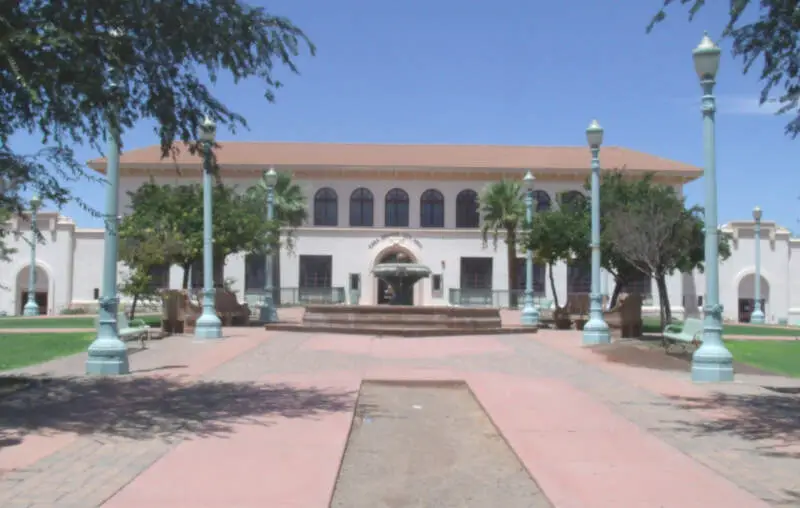
#1 most diverse in Arizona
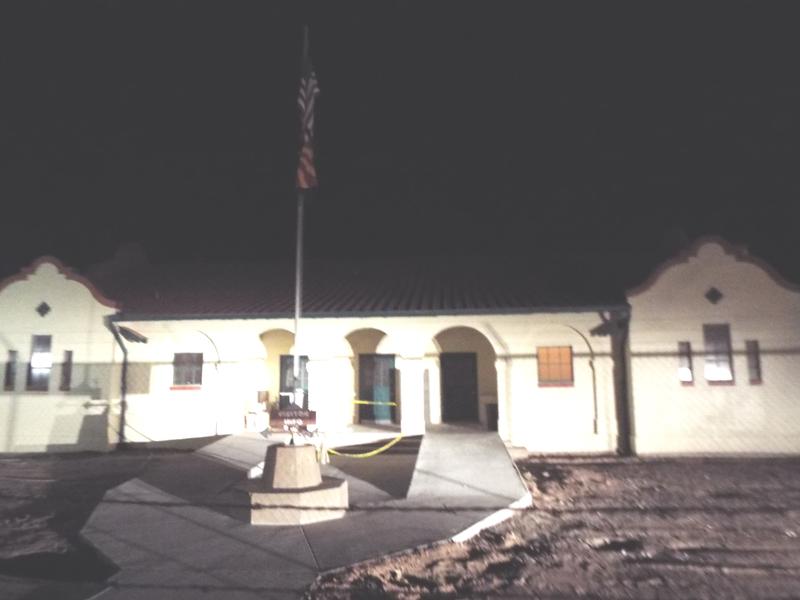
Winslow is a city in Navajo County, Arizona, United States. According to the 2010 census, the population of the city is 9,655.
Data | Crime | Cost of living | Movers
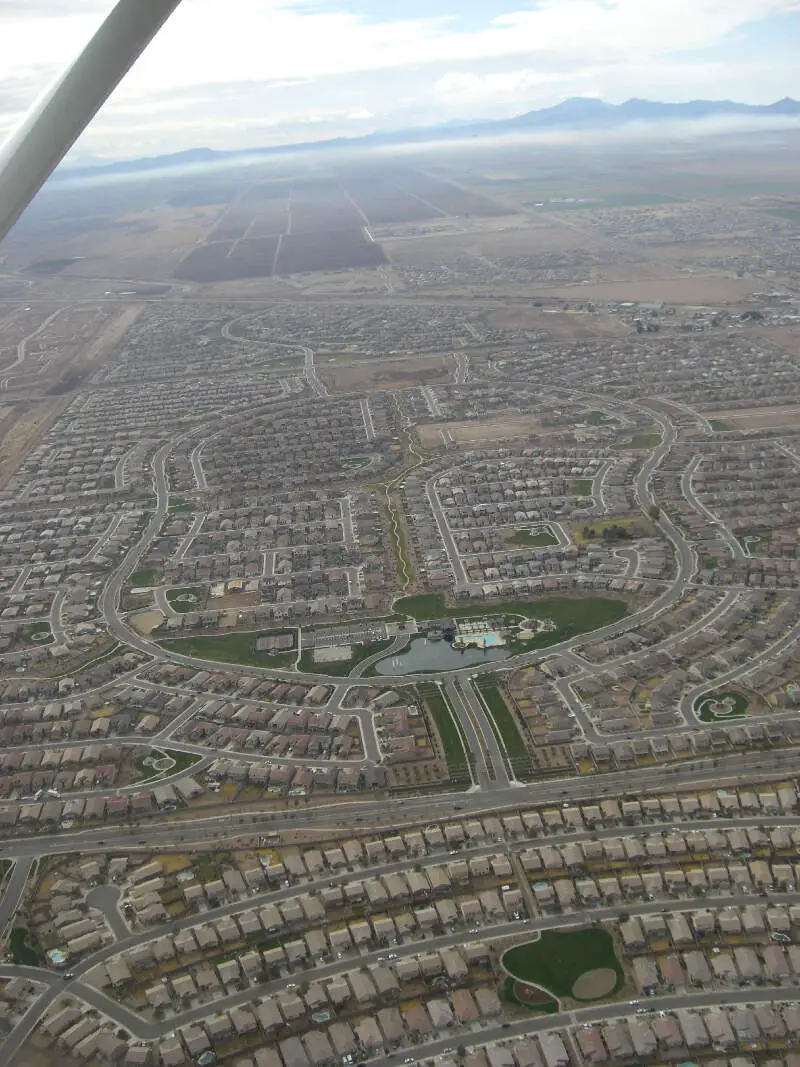
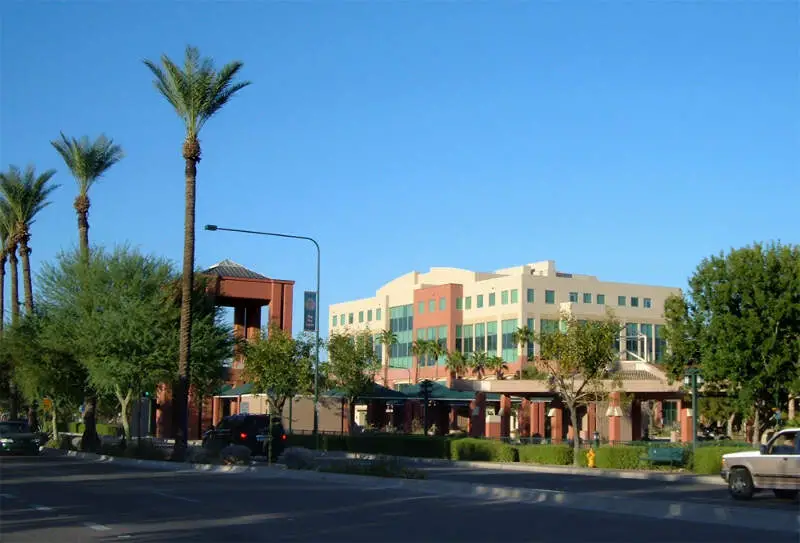
#2 most diverse in Arizona
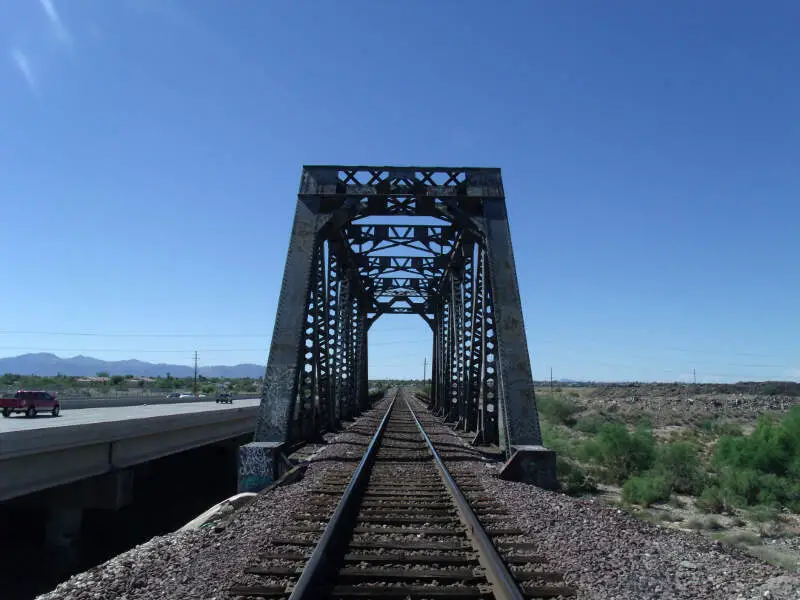
Maricopa is a city in the Gila River Valley in the State of Arizona. With an estimated 48,602 residents as of 2015, Maricopa is the second most populous incorporated city in Pinal County and eighteenth most populous in Arizona. Maricopa forms part of the Phoenix metropolitan area.
Data | Crime | Cost of living | Movers
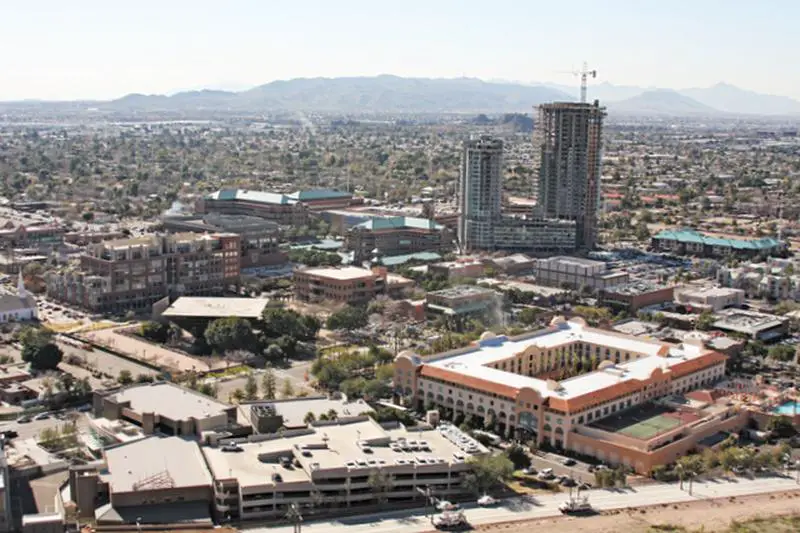
#3 most diverse in Arizona
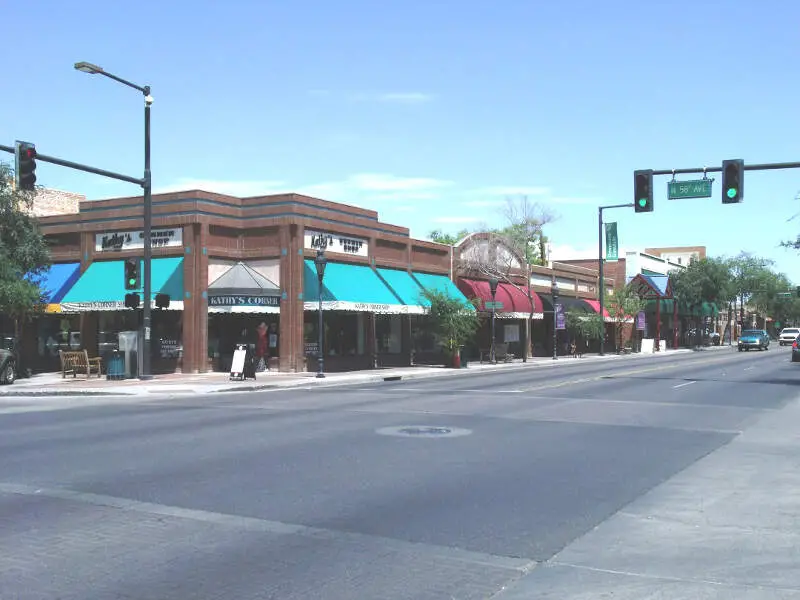
Tempe, also known as Hayden’s Ferry during the territorial times of Arizona, is a city in Maricopa County, Arizona, United States, with the Census Bureau reporting a 2010 population of 161,719. The city is named after the Vale of Tempe in Greece. Tempe is located in the East Valley section of metropolitan Phoenix; it is bordered by Phoenix and Guadalupe on the west, Scottsdale on the north, Chandler on the south, and Mesa on the east. Tempe is also the location of the main campus of Arizona State University.
Data | Crime | Cost of living | Movers | Compare
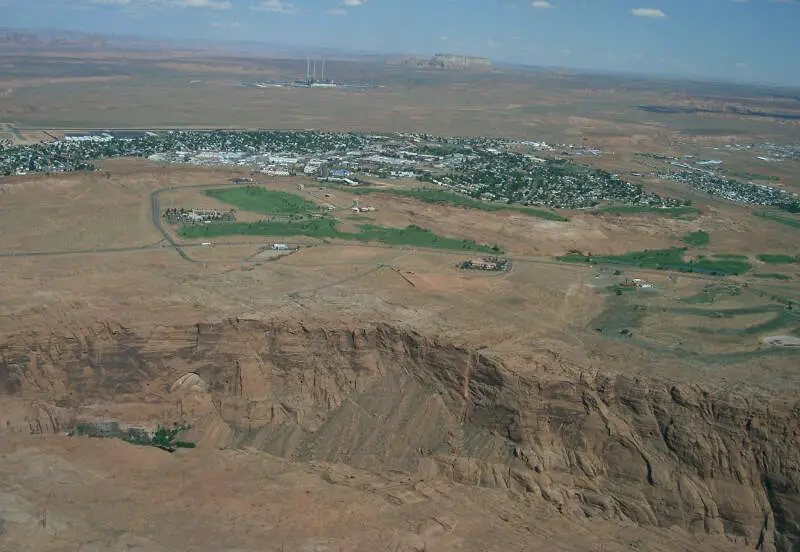
#4 most diverse in Arizona
Page is a city in Coconino County, Arizona, United States, near the Glen Canyon Dam and Lake Powell. As of the 2010 census, the population of the city was 7,247.
Data | Crime | Cost of living | Movers
#5 most diverse in Arizona
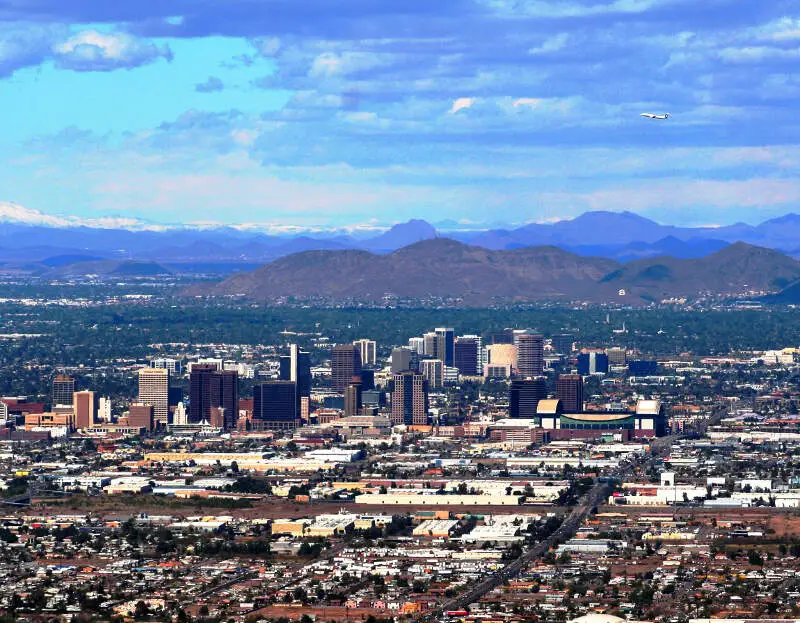
Phoenix is the capital and most populous city of the U.S. state of Arizona. With 1,615,017 people, Phoenix is the fifth most populous city nationwide, the most populous state capital in the United States, and the only state capital with a population of more than one million residents.
Data | Crime | Cost of living | Movers | Compare
#6 most diverse in Arizona
Data | Crime | Cost of living | Movers
#7 most diverse in Arizona
Glendale is a city in Maricopa County, Arizona, United States, located about nine miles northwest from Downtown Phoenix. According to the 2010 census, the population of the city is 226,721.
Data | Crime | Cost of living | Movers | Compare
#8 most diverse in Arizona
Data | Crime | Cost of living | Movers
#9 most diverse in Arizona
Chandler is a city in Maricopa County, Arizona, United States, and a prominent suburb of the Phoenix, Arizona, Metropolitan Statistical Area. It is bordered to the north and west by Tempe, to the north by Mesa, to the west by Phoenix, to the south by the Gila River Indian Community, and to the east by Gilbert. As of July 2015, the population was 260,828 according to the United States Census Bureau, According to the city’s official website, Chandler’s Transportation & Development Department estimated the population, as of May 2016, to be 247,328. It also has satellite locations for many technology companies, including Intel and Orbital ATK.
Data | Crime | Cost of living | Movers | Compare
#10 most diverse in Arizona
Casa Grande is a city in Pinal County, approximately halfway between Phoenix and Tucson in the U.S. state of Arizona. According to the 2010 census, the population of the city is 48,571. It is named after the Casa Grande Ruins National Monument, which is actually located in Coolidge. “Casa Grande” is Spanish for “big house”.
Data | Crime | Cost of living | Movers
The receipts
Compare the top ten
Pick a metric. The bars rescale. The red line is Arizona’s statewide median.
On the map
Where diversity lives in Arizona
Saturday Night Science
Methodology: How we determined the most diverse cities in Arizona for 2026
We still believe in the accuracy of data — especially from the Census — and Saturday Night Science. So that’s where we went to get the race breakdown across Arizona.
That leads us to the Census’s most recently available data, the 2020-2024 American Community Survey data from the US Census.
Specifically, we looked at table B03002: HISPANIC OR LATINO ORIGIN BY RACE. Here are the category names as defined by the Census:
- White alone*
- Black or African American alone*
- American Indian and Alaska Native alone*
- Asian alone*
- Native Hawaiian and Other Pacific Islander alone*
- Some other race alone*
- Two or more races*
- Hispanic or Latino
We limited our analysis to non-CDPs with a population greater than 5,000 people. That left us with 56 cities.
We then calculated the HHI for each city by finding the racial breakdown of a city in percent terms, squaring them, and then adding the squares together. This left us with scores ranging from 2,957 (Winslow) to 9,182 (Somerton).
Finally, we ranked each city based on the HHI, with a lower score being more diverse than a high score. Winslow took the distinction of being the most diverse, while Somerton was the least diverse city.
We updated this article for 2026. This report is our eleventh time ranking the most diverse places in Arizona.
The full plate
Race By City In Arizona For 2026
Click any column to sort. Search by city name.
| Rank | City | Population | HHI | % White | % Black | % Hispanic | % Asian |
|---|---|---|---|---|---|---|---|
| 1 | Winslow | 8,773 | 2,957 | 22.1% | 3.5% | 31.6% | 0.5% |
| 2 | Maricopa | 67,163 | 3,086 | 45.2% | 12.7% | 28.8% | 3.1% |
| 3 | Tempe | 188,065 | 3,321 | 51.0% | 6.9% | 23.1% | 9.7% |
| 4 | Page | 7,345 | 3,387 | 44.3% | 0.7% | 7.9% | 2.6% |
| 5 | Phoenix | 1,642,323 | 3,501 | 40.6% | 7.4% | 42.0% | 4.0% |
| 6 | El Mirage | 36,088 | 3,559 | 31.8% | 7.3% | 49.3% | 0.9% |
| 7 | Glendale | 252,833 | 3,589 | 41.6% | 6.0% | 42.2% | 4.2% |
| 8 | Eloy | 17,433 | 3,596 | 37.0% | 8.8% | 46.2% | 0.8% |
| 9 | Chandler | 280,136 | 3,603 | 54.2% | 5.1% | 21.7% | 11.7% |
| 10 | Casa Grande | 60,905 | 3,635 | 41.8% | 5.3% | 42.7% | 2.5% |
| 11 | Avondale | 92,477 | 3,697 | 26.5% | 10.5% | 53.4% | 4.1% |
| 12 | Coolidge | 16,636 | 3,721 | 35.8% | 6.4% | 48.6% | 0.4% |
| 13 | Tucson | 547,073 | 3,753 | 43.3% | 4.8% | 42.8% | 3.1% |
| 14 | Goodyear | 107,645 | 3,802 | 52.1% | 7.4% | 31.7% | 3.3% |
| 15 | Sierra Vista | 45,155 | 3,900 | 56.8% | 6.2% | 23.5% | 3.5% |
| 16 | Flagstaff | 76,445 | 3,902 | 57.6% | 1.8% | 19.6% | 2.3% |
| 17 | Globe | 7,195 | 3,941 | 46.5% | 0.8% | 41.6% | 4.0% |
| 18 | Youn | 7,015 | 3,974 | 45.9% | 1.9% | 42.8% | 2.7% |
| 19 | Florence | 25,570 | 4,240 | 56.4% | 8.2% | 31.4% | 0.5% |
| 20 | Sahuarita | 35,862 | 4,302 | 52.5% | 3.2% | 39.1% | 1.2% |
| 21 | Mesa | 511,764 | 4,382 | 60.1% | 3.7% | 26.9% | 2.4% |
| 22 | Marana | 56,938 | 4,395 | 60.2% | 2.9% | 27.0% | 3.7% |
| 23 | Litchfield Park | 6,916 | 4,483 | 61.7% | 1.8% | 24.8% | 4.9% |
| 24 | Safford | 10,239 | 4,504 | 47.7% | 1.4% | 47.1% | 0.5% |
| 25 | Peoria | 196,906 | 4,628 | 64.3% | 3.2% | 20.7% | 5.3% |
| 26 | Yuma | 100,139 | 4,687 | 31.2% | 1.9% | 60.8% | 1.7% |
| 27 | Gilbert | 280,262 | 4,704 | 65.6% | 3.2% | 17.9% | 6.7% |
| 28 | Surprise | 154,948 | 4,792 | 65.8% | 4.3% | 20.0% | 2.4% |
| 29 | Bullhead City | 42,496 | 5,271 | 68.7% | 1.6% | 22.8% | 1.5% |
| 30 | Queen Creek | 71,867 | 5,420 | 71.4% | 3.0% | 16.7% | 2.8% |
| 31 | Sedona | 9,777 | 5,467 | 70.8% | 1.7% | 21.0% | 2.0% |
| 32 | Cottonwood | 12,580 | 5,471 | 70.0% | 0.2% | 23.4% | 0.5% |
| 33 | Apache Junction | 41,058 | 5,566 | 71.9% | 1.4% | 19.2% | 1.7% |
| 34 | Oro Valley | 48,162 | 5,627 | 72.9% | 1.1% | 16.7% | 4.0% |
| 35 | Kingman | 34,375 | 5,701 | 73.6% | 2.0% | 16.0% | 1.7% |
| 36 | Show Low | 12,102 | 5,778 | 73.3% | 0.5% | 19.5% | 1.1% |
| 37 | Prescott Valley | 49,179 | 5,818 | 73.5% | 0.6% | 20.1% | 1.2% |
| 38 | Guadalupe | 5,272 | 5,911 | 1.5% | 2.6% | 74.5% | 1.1% |
| 39 | Thatcher | 5,439 | 6,042 | 74.2% | 0.2% | 23.2% | 0.6% |
| 40 | Camp Verde | 12,521 | 6,043 | 76.5% | 0.8% | 11.9% | 0.1% |
| 41 | Chino Valley | 13,602 | 6,066 | 75.7% | 0.3% | 17.9% | 0.3% |
| 42 | Benson | 5,417 | 6,072 | 76.2% | 0.3% | 14.8% | 0.4% |
| 43 | Scottsdale | 243,821 | 6,108 | 77.1% | 2.1% | 10.6% | 4.9% |
| 44 | Tolleson | 7,668 | 6,459 | 9.5% | 6.4% | 79.5% | 0.0% |
| 45 | Lake Havasu City | 58,359 | 6,597 | 79.7% | 0.5% | 15.3% | 0.7% |
| 46 | Paradise Valley | 12,611 | 6,608 | 80.6% | 0.4% | 7.8% | 4.8% |
| 47 | Douglas | 15,981 | 6,823 | 11.8% | 3.2% | 81.7% | 0.5% |
| 48 | Snowflake | 6,444 | 6,888 | 82.4% | 4.5% | 6.7% | 0.0% |
| 49 | Payson | 16,622 | 6,915 | 82.2% | 0.4% | 12.3% | 0.6% |
| 50 | Prescott | 47,400 | 6,967 | 82.8% | 0.5% | 10.0% | 2.1% |
| 51 | Wickenburg | 8,059 | 7,265 | 84.8% | 1.0% | 7.8% | 0.4% |
| 52 | Fountain Hills | 23,789 | 7,824 | 88.3% | 2.3% | 3.6% | 2.1% |
| 53 | Cave Creek | 5,091 | 7,839 | 88.3% | 1.4% | 4.0% | 1.2% |
| 54 | San Luis | 37,337 | 8,556 | 4.7% | 1.9% | 92.4% | 0.1% |
| 55 | Nogales | 19,841 | 8,752 | 4.4% | 0.2% | 93.4% | 0.3% |
| 56 | Somerton | 14,574 | 9,182 | 3.2% | 0.3% | 95.8% | 0.0% |
Source: U.S. Census ACS 2020-2024. 56 cities with more than 5,000 residents.
Summary
Summary: Diversity Across Arizona
If you’re looking for a scientific breakdown of diversity across Arizona, this is an accurate list.
The most diverse cities in Arizona are Winslow, Maricopa, Tempe, Page, Phoenix, El Mirage, Glendale, Eloy, Chandler, and Casa Grande. Not sold on Arizona? Take the two-minute Find Your Place quiz and see which state actually fits you.
Questions and answers
Most Diverse Cities In Arizona FAQs
What is the most diverse city in Arizona?
Winslow is the most diverse city in Arizona for 2026, posting the lowest diversity index (2,957) of the 56 places we measured. Maricopa and Tempe are next.
What are the 10 most diverse cities in Arizona?
The ten most diverse cities in Arizona are Winslow, Maricopa, Tempe, Page, Phoenix, El Mirage, Glendale, Eloy, Chandler, and Casa Grande. We ranked all 56 places with more than 5,000 residents by their racial-diversity HHI.
How do you measure diversity?
We use a Herfindahl-Hirschman Index (HHI) across each city’s White, Black, Hispanic, and Asian population shares from the Census American Community Survey. A lower score means the mix is more even, so the lowest HHI wins.
What is the least diverse city in Arizona?
Somerton is the least diverse city in Arizona, with a diversity index of 9,182. That means one group makes up most of its population.
Where does this data come from?
All population shares come from the Census Bureau’s American Community Survey (2020-2024). Diversity scores in Arizona range from 2,957 in Winslow to 9,182 in Somerton.


