
Pima County, AZ
Demographics & Statistics
Updated: 2025-10-25

Updated: 2025-10-25
Life in Pima County research summary. HomeSnacks has been researching the quality of life in Pima County over the past eight years using Census data, FBI crime data, cost of living data, and other primary sources. Based on the most recently available data, we found the following about life in Pima County:
The population in Pima County is 1,049,947.
The median home value in Pima County is $342,635.
The median income in Pima County is $67,929.
The median rent in Pima County is $1,154.
The unemployment rate in Pima County is 5.7%.
The poverty rate in Pima County is 14.4%.
The average high in Pima County is 86.5° and there are 24.7 inches of rainfall annually.
The average high in Pima County is 86.5°.
There are 66.14 nice days each year.
Expect an average of 24.7 inches of rain each year with 0.3 inches of snow.
There is an average of 8:37 hours of sun each day in Pima County.
| Stat | Pima County |
|---|---|
| Mean High | 86.5 |
| Nice Days | 66.14 |
| Rainfall | 24.7 |
| Snowfall | 0.3 |
| Sunny Hours | 8:37 |


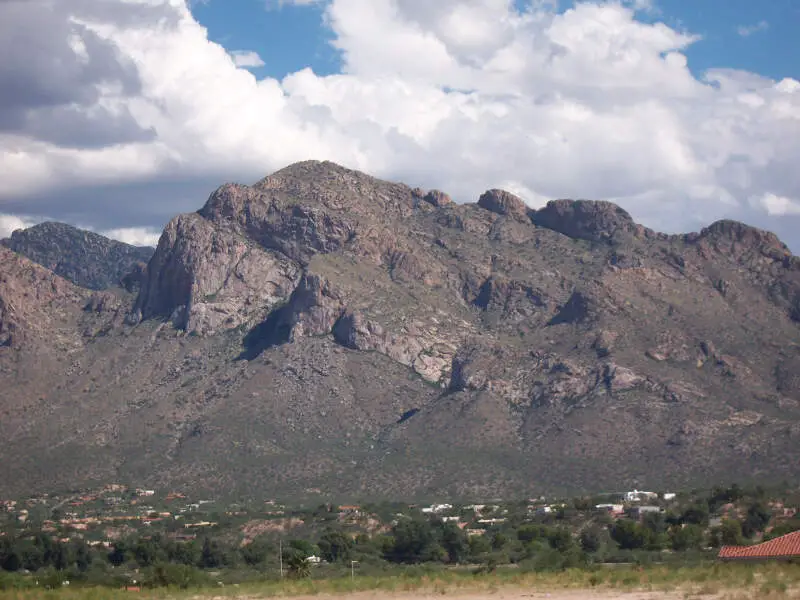


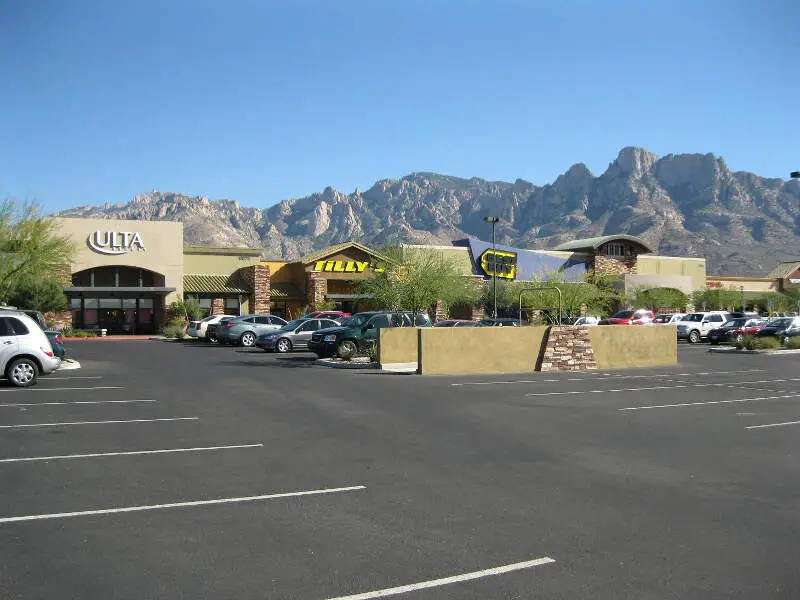
The current population in Pima County is 1,049,947. The population has increased 0.8% from 2019.
| Year | Population | % Change |
|---|---|---|
| 2023 | 1,035,063 | -0.3% |
| 2022 | 1,038,476 | 1.1% |
| 2021 | 1,027,207 | - |
Pima County is 50.6% female with 530,949 female residents.
Pima County is 49.4% male with 518,997 male residents.
| Gender | Pima County | AZ | USA |
|---|---|---|---|
| Female | 50.6% | 50.1% | 50.5% |
| Male | 49.4% | 49.9% | 49.5% |
Pima County is:
51.2% White with 537,936 White residents.
3.3% African American with 34,497 African American residents.
2.0% American Indian with 21,245 American Indian residents.
2.9% Asian with 30,038 Asian residents.
0.1% Hawaiian with 1,504 Hawaiian residents.
0.4% Other with 3,903 Other residents.
3.9% Two Or More with 41,276 Two Or More residents.
36.1% Hispanic with 379,548 Hispanic residents.
| Race | Pima County | AZ | USA |
|---|---|---|---|
| White | 51.2% | 53.4% | 58.2% |
| African American | 3.3% | 4.4% | 12.0% |
| American Indian | 2.0% | 3.4% | 0.5% |
| Asian | 2.9% | 3.3% | 5.7% |
| Hawaiian | 0.1% | 0.2% | 0.2% |
| Other | 0.4% | 0.4% | 0.5% |
| Two Or More | 3.9% | 3.9% | 3.9% |
| Hispanic | 36.1% | 31.0% | 19.0% |
5.4% of households in Pima County earn Less than $10,000.
3.9% of households in Pima County earn $10,000 to $14,999.
7.6% of households in Pima County earn $15,000 to $24,999.
8.5% of households in Pima County earn $25,000 to $34,999.
12.3% of households in Pima County earn $35,000 to $49,999.
16.7% of households in Pima County earn $50,000 to $74,999.
12.8% of households in Pima County earn $75,000 to $99,999.
16.7% of households in Pima County earn $100,000 to $149,999.
7.7% of households in Pima County earn $150,000 to $199,999.
8.3% of households in Pima County earn $200,000 or more.
| Income | Pima County | AZ | USA |
|---|---|---|---|
| Less than $10,000 | 5.4% | 4.9% | 4.9% |
| $10,000 to $14,999 | 3.9% | 2.9% | 3.6% |
| $15,000 to $24,999 | 7.6% | 6.1% | 6.6% |
| $25,000 to $34,999 | 8.5% | 6.9% | 6.8% |
| $35,000 to $49,999 | 12.3% | 10.9% | 10.4% |
| $50,000 to $74,999 | 16.7% | 17.0% | 15.7% |
| $75,000 to $99,999 | 12.8% | 13.6% | 12.7% |
| $100,000 to $149,999 | 16.7% | 18.1% | 17.4% |
| $150,000 to $199,999 | 7.7% | 9.0% | 9.3% |
| $200,000 or more | 8.3% | 10.6% | 12.6% |
5.0% of adults in Pima County completed < 9th grade.
6.0% of adults in Pima County completed 9-12th grade.
21.0% of adults in Pima County completed high school / ged.
24.0% of adults in Pima County completed some college.
9.0% of adults in Pima County completed associate's degree.
20.0% of adults in Pima County completed bachelor's degree.
11.0% of adults in Pima County completed master's degree.
2.0% of adults in Pima County completed professional degree.
2.0% of adults in Pima County completed doctorate degree.
| Education | Pima County | AZ | USA |
|---|---|---|---|
| < 9th Grade | 5% | 6% | 5% |
| 9-12th Grade | 6% | 6% | 6% |
| High School / GED | 21% | 23% | 26% |
| Some College | 24% | 24% | 19% |
| Associate's Degree | 9% | 9% | 9% |
| Bachelor's Degree | 20% | 20% | 21% |
| Master's Degree | 11% | 9% | 10% |
| Professional Degree | 2% | 2% | 2% |
| Doctorate Degree | 2% | 1% | 2% |
HomeSnacks is based in Durham, NC.
We aim to deliver bite-sized pieces of infotainment about where you live.
We use data, analytics, and a sense of humor to determine quality of life for places across the nation.