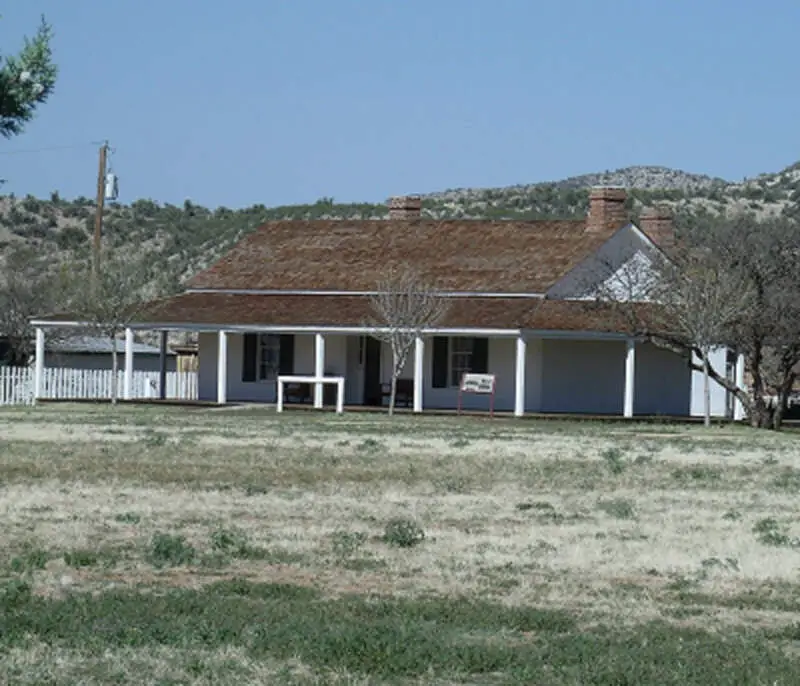

Life in Yavapai County research summary. HomeSnacks has been researching the quality of life in Yavapai County over the past eight years using Census data, FBI crime data, cost of living data, and other primary sources. Based on the most recently available data, we found the following about life in Yavapai County:
The population in Yavapai County is 237,830.
The median home value in Yavapai County is $493,954.
The median income in Yavapai County is $62,430.
The median rent in Yavapai County is $1,128.
The unemployment rate in Yavapai County is 4.9%.
The poverty rate in Yavapai County is 12.3%.
The average high in Yavapai County is 76.1° and there are 34.6 inches of rainfall annually.
The average high in Yavapai County is 76.1°.
There are 84.46 nice days each year.
Expect an average of 34.6 inches of rain each year with 5.7 inches of snow.
There is an average of 8:02 hours of sun each day in Yavapai County.
| Stat | Yavapai County |
|---|---|
| Mean High | 76.1 |
| Nice Days | 84.46 |
| Rainfall | 34.6 |
| Snowfall | 5.7 |
| Sunny_hours | 8:02 |


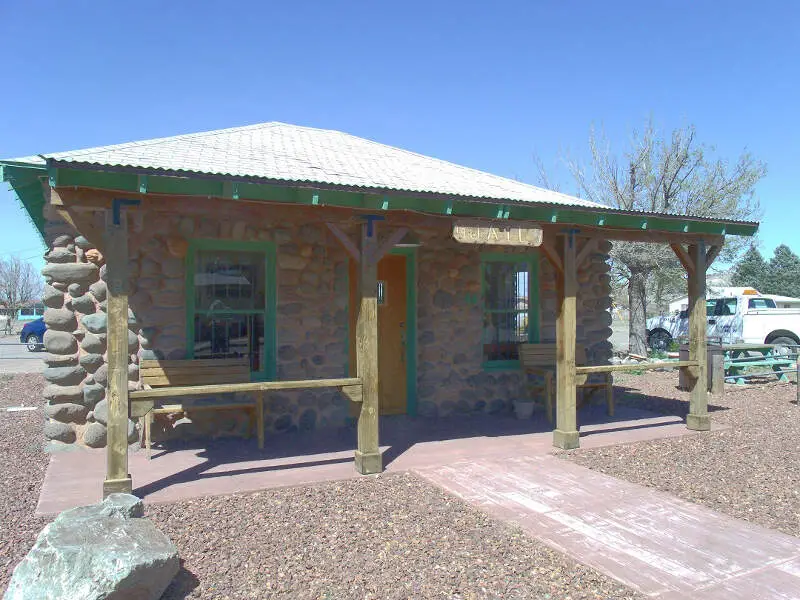
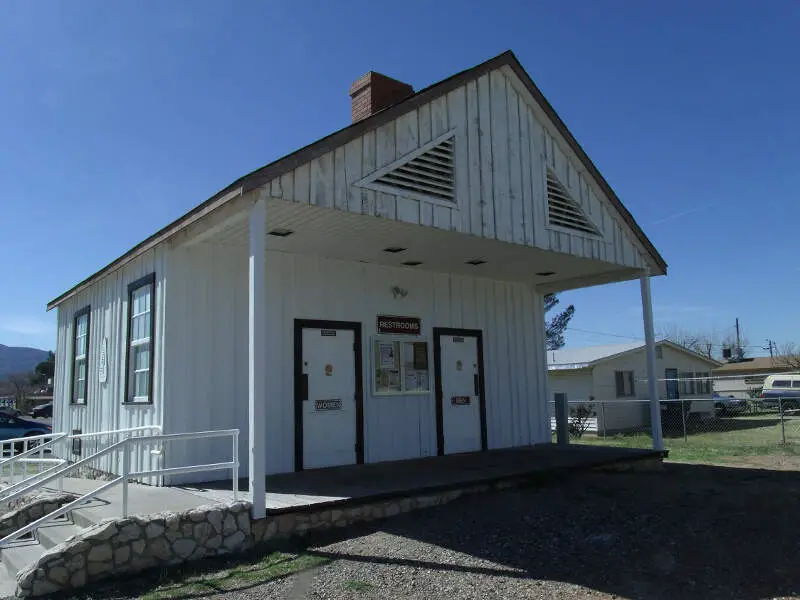
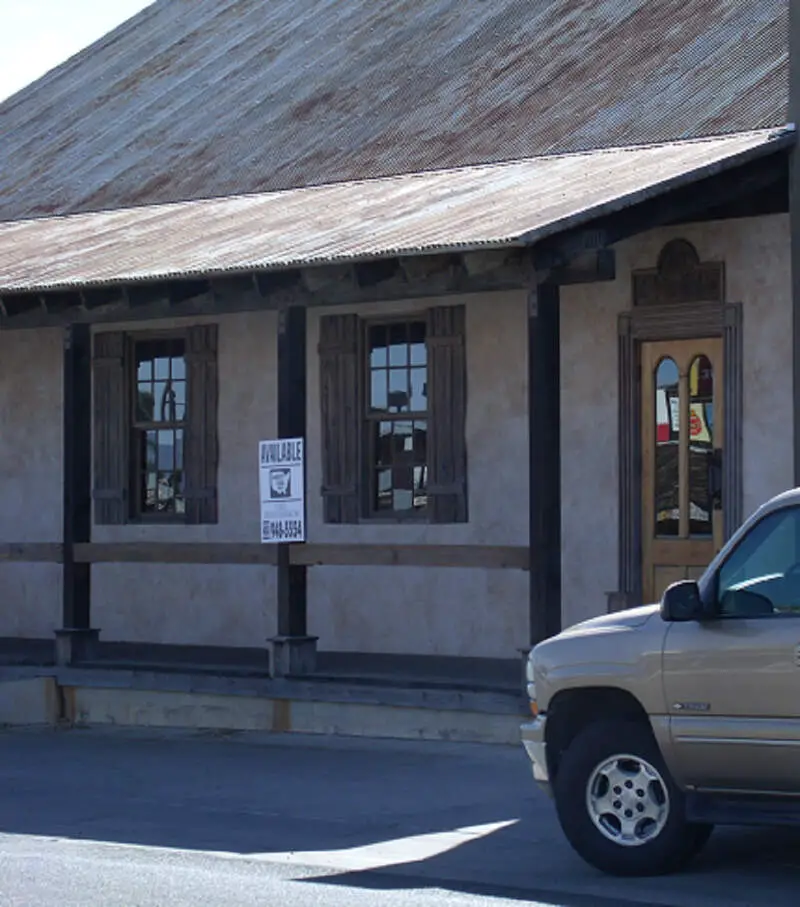

The current population in Yavapai County is 237,830. The population has increased 2.5% from 2019.
| Year | Population | % Change |
|---|---|---|
| 2022 | 233,789 | 0.6% |
| 2021 | 232,396 | 1.9% |
| 2020 | 228,067 | - |
Yavapai County is 50.7% female with 120,478 female residents.
Yavapai County is 49.3% male with 117,352 male residents.
| Gender | Yavapai County | AZ | USA |
|---|---|---|---|
| Female | 50.7% | 50.0% | 50.4% |
| Male | 49.3% | 50.0% | 49.6% |
Yavapai County is:
78.8% White with 187,377 White residents.
0.6% African American with 1,493 African American residents.
1.1% American Indian with 2,636 American Indian residents.
1.0% Asian with 2,321 Asian residents.
0.1% Hawaiian with 128 Hawaiian residents.
0.2% Other with 581 Other residents.
3.0% Two Or More with 7,214 Two Or More residents.
15.2% Hispanic with 36,080 Hispanic residents.
| Race | Yavapai County | AZ | USA |
|---|---|---|---|
| White | 78.8% | 53.0% | 58.9% |
| African American | 0.6% | 4.3% | 12.1% |
| American Indian | 1.1% | 3.5% | 0.6% |
| Asian | 1.0% | 3.3% | 5.7% |
| Hawaiian | 0.1% | 0.2% | 0.2% |
| Other | 0.2% | 0.3% | 0.4% |
| Two Or More | 3.0% | 3.4% | 3.5% |
| Hispanic | 15.2% | 32.0% | 18.7% |
4.5% of households in Yavapai County earn Less than $10,000.
3.6% of households in Yavapai County earn $10,000 to $14,999.
9.0% of households in Yavapai County earn $15,000 to $24,999.
9.6% of households in Yavapai County earn $25,000 to $34,999.
13.4% of households in Yavapai County earn $35,000 to $49,999.
18.6% of households in Yavapai County earn $50,000 to $74,999.
13.8% of households in Yavapai County earn $75,000 to $99,999.
15.4% of households in Yavapai County earn $100,000 to $149,999.
5.9% of households in Yavapai County earn $150,000 to $199,999.
6.1% of households in Yavapai County earn $200,000 or more.
| Income | Yavapai County | AZ | USA |
|---|---|---|---|
| Less than $10,000 | 4.5% | 4.9% | 4.9% |
| $10,000 to $14,999 | 3.6% | 3.1% | 3.8% |
| $15,000 to $24,999 | 9.0% | 6.7% | 7.0% |
| $25,000 to $34,999 | 9.6% | 7.7% | 7.4% |
| $35,000 to $49,999 | 13.4% | 11.5% | 10.7% |
| $50,000 to $74,999 | 18.6% | 17.6% | 16.1% |
| $75,000 to $99,999 | 13.8% | 13.7% | 12.8% |
| $100,000 to $149,999 | 15.4% | 17.3% | 17.1% |
| $150,000 to $199,999 | 5.9% | 8.3% | 8.8% |
| $200,000 or more | 6.1% | 9.2% | 11.4% |
2.0% of adults in Yavapai County completed < 9th grade.
6.0% of adults in Yavapai County completed 9-12th grade.
25.0% of adults in Yavapai County completed high school / ged.
29.0% of adults in Yavapai County completed some college.
9.0% of adults in Yavapai County completed associate's degree.
17.0% of adults in Yavapai County completed bachelor's degree.
8.0% of adults in Yavapai County completed master's degree.
2.0% of adults in Yavapai County completed professional degree.
2.0% of adults in Yavapai County completed doctorate degree.
| Education | Yavapai County | AZ | USA |
|---|---|---|---|
| < 9th Grade | 2% | 5% | 3% |
| 9-12th Grade | 6% | 6% | 6% |
| High School / GED | 25% | 24% | 26% |
| Some College | 28% | 24% | 20% |
| Associate's Degree | 9% | 9% | 9% |
| Bachelor's Degree | 17% | 20% | 21% |
| Master's Degree | 8% | 9% | 10% |
| Professional Degree | 2% | 2% | 2% |
| Doctorate Degree | 2% | 1% | 2% |
HomeSnacks is based in Durham, NC.
We aim to deliver bite-sized pieces of infotainment about where you live.
We use data, analytics, and a sense of humor to determine quality of life for places across the nation.