Some of you might be asking yourself, at this very moment, is Illinois a good place?
The answer is unequivocally yes… if you know where to locate the best counties to live in Illinois.
Lucky for you, we’re here to help you identify the best counties to live in the Prairie State based on the most recently available data from the Census. And this isn’t our first rodeo — we’ve been using Saturday Night Science to rank places for years.
The question becomes if you wanted to relocate to the best part of Illinois, where would you go? To answer that, we looked at crime, cost of living, and demographic data for all 102 counties in the state.
Table Of Contents: Top Ten | Methodology | Table | FAQs | Summary
The 10 Best Counties To Live In Illinois For 2026
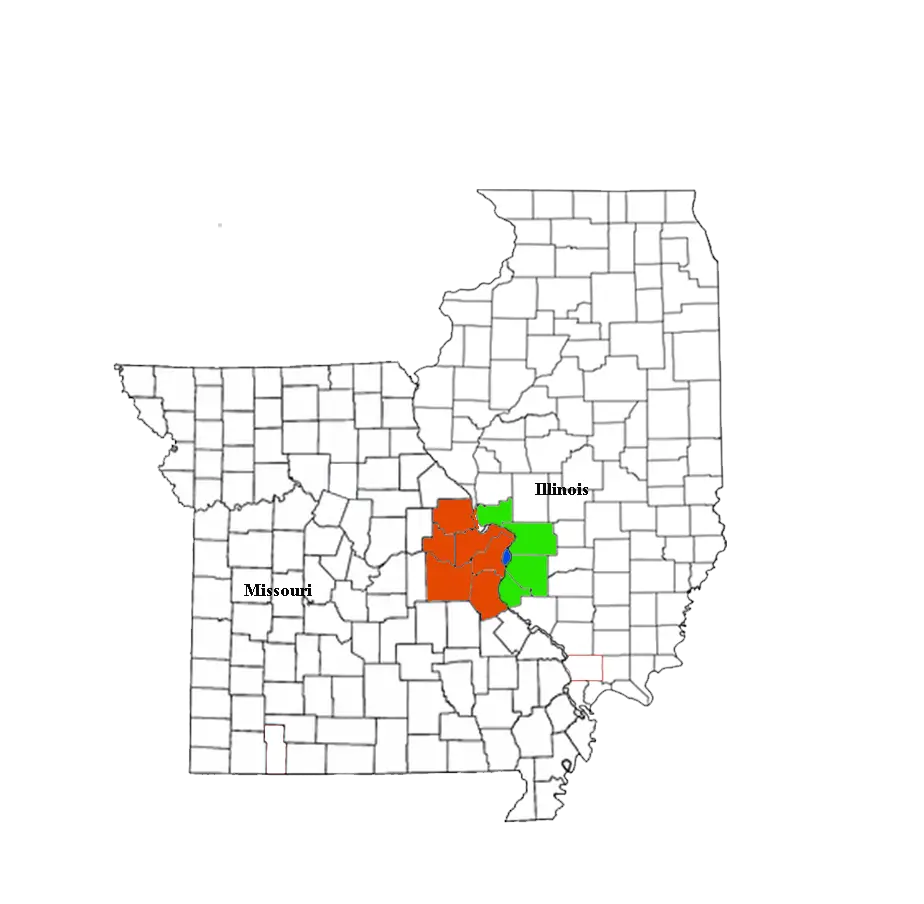
Monroe County is the county to be when it comes to living the good life in Illinois. And you should avoid Alexander County if you can — at least according to the data.
Now you know exactly where to move in Illinois. Keep on reading for more about the top ten and a detailed methodology.
Or, check out the best places to live in Illinois and the cheapest places to live in Illinois.
Table Of Contents: Top Ten | Methodology | Summary | Table
The Best Counties To Live In Illinois For 2026
1. Monroe County
Biggest Place: Waterloo
Population: 35,036
Median Income: $102,880 (7th best)
Median Home Price: $325,385 (8th best)
Unemployment Rate: 1.9% (2nd best)
More on Monroe County: Data
2. Piatt County
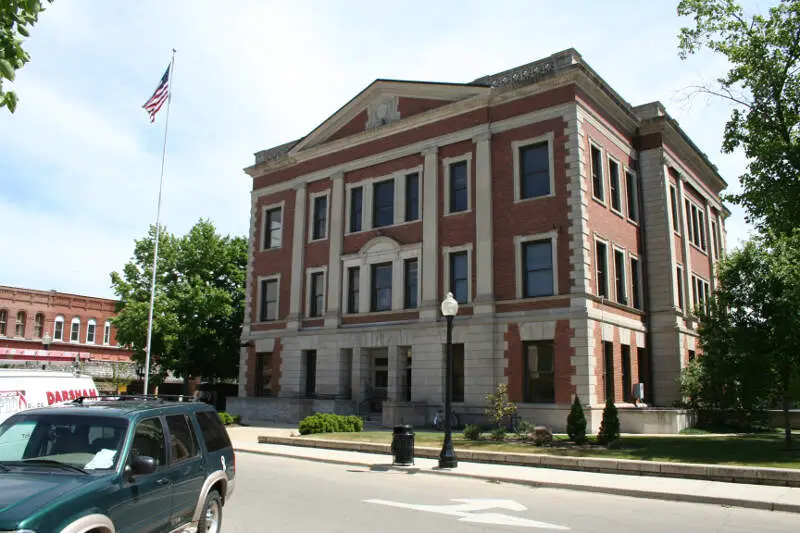
Biggest Place: Monticello
Population: 16,695
Median Income: $94,811 (8th best)
Median Home Price: $215,217 (19th best)
Unemployment Rate: 2.8% (9th best)
More on Piatt County: Data
3. Calhoun County

Biggest Place: Hardin
Population: 4,330
Median Income: $93,203 (9th best)
Median Home Price: $191,064 (26th best)
Unemployment Rate: 3.2% (18th best)
More on Calhoun County: Data
4. Kendall County
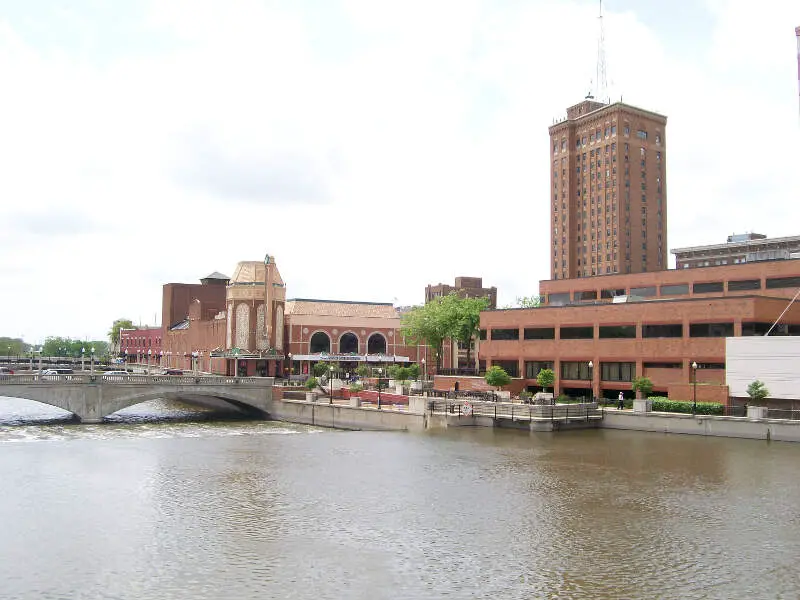
Biggest Place: Aurora
Population: 137,675
Median Income: $111,601 (2nd best)
Median Home Price: $389,875 (2nd best)
Unemployment Rate: 4.3% (47th best)
More on Kendall County: Data
5. Menard County
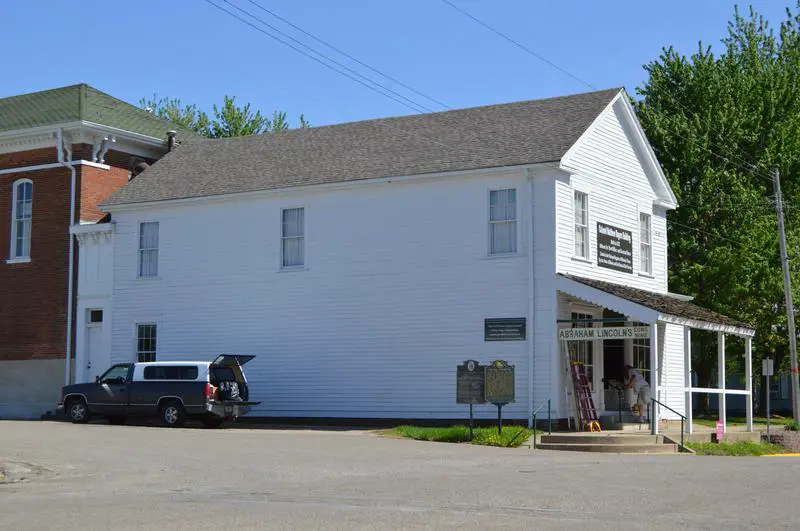
Biggest Place: Petersburg
Population: 12,095
Median Income: $82,176 (15th best)
Median Home Price: $199,169 (22nd best)
Unemployment Rate: 3.5% (25th best)
More on Menard County: Data
6. Grundy County
Biggest Place: Morris
Population: 53,219
Median Income: $92,235 (10th best)
Median Home Price: $315,210 (9th best)
Unemployment Rate: 4.6% (57th best)
More on Grundy County: Data
7. Putnam County
Biggest Place: Granville
Population: 5,601
Median Income: $75,590 (24th best)
Median Home Price: $179,202 (3best)
Unemployment Rate: 4.2% (40th best)
More on Putnam County: Data
8. Mchenry County

Biggest Place: Crystal Lake
Population: 312,591
Median Income: $104,802 (5th best)
Median Home Price: $357,916 (6th best)
Unemployment Rate: 4.7% (59th best)
More on Mchenry County: Data
9. Woodford County
Biggest Place: Eureka
Population: 38,312
Median Income: $91,483 (11th best)
Median Home Price: $221,362 (15th best)
Unemployment Rate: 3.5% (24th best)
More on Woodford County: Data
10. Clinton County

Biggest Place: Centralia
Population: 36,954
Median Income: $86,588 (12th best)
Median Home Price: $217,319 (18th best)
Unemployment Rate: 3.4% (2best)
More on Clinton County: Data
Methodology: How do you determine which Illinois county is the best?
To give you the best county in Illinois, we have to look at a handful of metrics that signal the quality of a place. To do that, we made assumptions about what’s in a “best county” and what isn’t. For reference, we are trying to make the kind of argument you’d make at a bar using facts, Saturday Night Science.
With that in mind, we went to two of the best data sources on the internet. Namely, the American Community Survey data and FBI Crime data for the most recent period.
We paid particular attention to:
- Violent Crime Rates
- Property Crime Rates
- Median Home Values
- Median Income
- Unemployment Rates
- Adult Education Levels
- Health Insurance Coverage
- Poverty Rates
We then ranked each county in Illinois across each of the criteria from one to 102, with one being the best.
Taking the average rank across all criteria, we created a quality of life score with the county posting the lowest overall score being the “Best County To Live In Illinois.”
The result is some of the safest, quietest, and best counties to raise a family in the Prairie State.
We updated this article for 2026. This report is our eleventh time ranking the best counties to live in Illinois.
Read on to see why Monroe County is the best county, while Alexander County is probably in contention for being the worst county in Illinois.
Summary: The Best Counties In Illinois To Call Home For 2026
Living in Illinois can vary from one part of the state to the next — who woulda thought?
The best counties in Illinois are Monroe County, Piatt County, Calhoun County, Kendall County, Menard County, Grundy County, Putnam County, McHenry County, Woodford County, and Clinton County.
But now you know the outstanding parts and the parts to avoid, and that’s why you came here to learn at the end of the day.
You are welcome.
Here’s a look at the worst counties in Illinois according to the data:
- Alexander County
- Franklin County
- Lawrence County
For more Illinois reading, check out:
- Safest Places In Illinois
- Best Places To Buy A House In Illinois
- Best Places To Retire In Illinois
- Best Counties To Live In Illinois
Detailed List Of The Best Counties In Illinois
| Rank | County | Population | Median Income | Median Home Price |
|---|---|---|---|---|
| 1 | Monroe County | 35,036 | $102,880 | $325,385 |
| 2 | Piatt County | 16,695 | $94,811 | $215,217 |
| 3 | Calhoun County | 4,330 | $93,203 | $191,064 |
| 4 | Kendall County | 137,675 | $111,601 | $389,875 |
| 5 | Menard County | 12,095 | $82,176 | $199,169 |
| 6 | Grundy County | 53,219 | $92,235 | $315,210 |
| 7 | Putnam County | 5,601 | $75,590 | $179,202 |
| 8 | Mchenry County | 312,591 | $104,802 | $357,916 |
| 9 | Woodford County | 38,312 | $91,483 | $221,362 |
| 10 | Clinton County | 36,954 | $86,588 | $217,319 |
| 11 | Mclean County | 171,556 | $79,905 | $251,617 |
| 12 | Shelby County | 20,720 | $72,095 | $161,882 |
| 13 | Mercer County | 15,495 | $74,182 | $163,935 |
| 14 | Jo Daviess County | 21,851 | $73,993 | $247,008 |
| 15 | Tazewell County | 130,290 | $77,982 | $183,602 |
| 16 | Jersey County | 21,274 | $80,361 | $196,451 |
| 17 | Dupage County | 930,024 | $112,096 | $432,424 |
| 18 | Effingham County | 34,522 | $80,404 | $211,543 |
| 19 | Will County | 701,462 | $109,984 | $366,079 |
| 20 | Washington County | 13,627 | $78,224 | $157,366 |
| 21 | Cumberland County | 10,334 | $73,327 | $160,741 |
| 22 | De Witt County | 15,373 | $71,678 | $141,402 |
| 23 | Henry County | 48,643 | $71,911 | $163,772 |
| 24 | Sangamon County | 194,947 | $75,357 | $190,359 |
| 25 | Ogle County | 51,495 | $82,132 | $218,879 |
| 26 | Madison County | 264,238 | $75,793 | $193,116 |
| 27 | Clark County | 15,266 | $72,927 | $139,900 |
| 28 | Adams County | 64,754 | $66,220 | $177,655 |
| 29 | Jasper County | 9,180 | $74,755 | $168,590 |
| 30 | Macoupin County | 44,350 | $70,805 | $134,474 |
| 31 | Lake County | 714,223 | $110,416 | $384,534 |
| 32 | Brown County | 6,322 | $67,917 | $152,416 |
| 33 | Marshall County | 11,647 | $71,585 | $134,024 |
| 34 | Logan County | 27,713 | $66,358 | $136,794 |
| 35 | Livingston County | 35,565 | $73,790 | $163,480 |
| 36 | Lasalle County | 108,714 | $73,045 | $175,695 |
| 37 | Pope County | 3,739 | $60,050 | $150,792 |
| 38 | Lee County | 33,869 | $70,292 | $174,240 |
| 39 | Kane County | 517,255 | $103,163 | $373,804 |
| 40 | Bond County | 16,716 | $65,959 | $162,558 |
| 41 | Champaign County | 208,741 | $63,683 | $231,346 |
| 42 | Douglas County | 19,751 | $77,320 | $154,287 |
| 43 | St. Clair County | 253,694 | $73,854 | $195,663 |
| 44 | Moultrie County | 14,424 | $71,784 | $181,415 |
| 45 | Scott County | 4,937 | $66,705 | $89,289 |
| 46 | Crawford County | 18,511 | $71,674 | $122,029 |
| 47 | Christian County | 33,538 | $62,611 | $128,569 |
| 48 | Hardin County | 3,605 | $54,271 | $98,798 |
| 49 | Whiteside County | 54,947 | $67,500 | $138,238 |
| 50 | Williamson County | 66,876 | $65,604 | $149,240 |
| 51 | Stephenson County | 43,768 | $64,043 | $153,776 |
| 52 | Stark County | 5,308 | $62,878 | $131,532 |
| 53 | Bureau County | 32,866 | $69,257 | $143,492 |
| 54 | Kankakee County | 106,635 | $71,281 | $217,321 |
| 55 | Boone County | 53,230 | $84,571 | $280,539 |
| 56 | Hancock County | 17,281 | $65,865 | $110,781 |
| 57 | Dekalb County | 100,703 | $70,724 | $289,254 |
| 58 | Macon County | 101,849 | $62,666 | $123,098 |
| 59 | Richland County | 15,598 | $62,455 | $133,090 |
| 60 | Cook County | 5,182,090 | $83,498 | $326,038 |
| 61 | Mason County | 12,745 | $62,845 | $92,675 |
| 62 | Greene County | 11,683 | $62,192 | $101,092 |
| 63 | Montgomery County | 27,942 | $63,620 | $121,154 |
| 64 | Warren County | 16,447 | $67,385 | $112,082 |
| 65 | Morgan County | 33,021 | $66,306 | $128,347 |
| 66 | Carroll County | 15,576 | $60,758 | $156,363 |
| 67 | Iroquois County | 26,449 | $66,255 | $149,561 |
| 68 | Ford County | 13,406 | $62,439 | $150,970 |
| 69 | Pike County | 14,469 | $59,777 | $113,375 |
| 70 | Wabash County | 11,119 | $57,086 | $119,813 |
| 71 | Henderson County | 6,193 | $62,227 | $122,062 |
| 72 | Randolph County | 30,058 | $68,131 | $153,970 |
| 73 | Peoria County | 179,645 | $65,108 | $156,124 |
| 74 | Jefferson County | 36,550 | $63,118 | $134,910 |
| 75 | Cass County | 12,784 | $68,125 | $96,602 |
| 76 | Rock Island County | 142,757 | $67,159 | $151,236 |
| 77 | Winnebago County | 283,292 | $65,837 | $202,625 |
| 78 | Johnson County | 13,376 | $62,528 | $189,505 |
| 79 | Fulton County | 33,020 | $60,599 | $95,759 |
| 80 | Edgar County | 16,535 | $59,941 | $98,376 |
| 81 | Knox County | 49,046 | $57,030 | $111,708 |
| 82 | Hamilton County | 7,916 | $65,746 | $110,772 |
| 83 | Perry County | 20,639 | $62,118 | $104,883 |
| 84 | Massac County | 13,865 | $65,116 | $112,646 |
| 85 | Fayette County | 21,315 | $60,944 | $142,740 |
| 86 | Clay County | 13,052 | $60,417 | $107,023 |
| 87 | Schuyler County | 6,787 | $65,948 | $145,815 |
| 88 | White County | 13,619 | $54,813 | $104,282 |
| 89 | Union County | 16,997 | $55,728 | $150,462 |
| 90 | Wayne County | 15,973 | $55,521 | $121,052 |
| 91 | Edwards County | 6,075 | $60,519 | $115,420 |
| 92 | Vermilion County | 72,386 | $56,877 | $95,715 |
| 93 | Pulaski County | 5,015 | $42,463 | $69,791 |
| 94 | Marion County | 37,000 | $61,240 | $117,480 |
| 95 | Gallatin County | 4,819 | $59,219 | $79,256 |
| 96 | Mcdonough County | 26,920 | $52,795 | $92,985 |
| 97 | Jackson County | 53,064 | $48,763 | $123,803 |
| 98 | Coles County | 46,777 | $56,478 | $140,128 |
| 99 | Saline County | 23,213 | $53,117 | $84,756 |
| 100 | Lawrence County | 15,031 | $55,324 | $95,311 |


