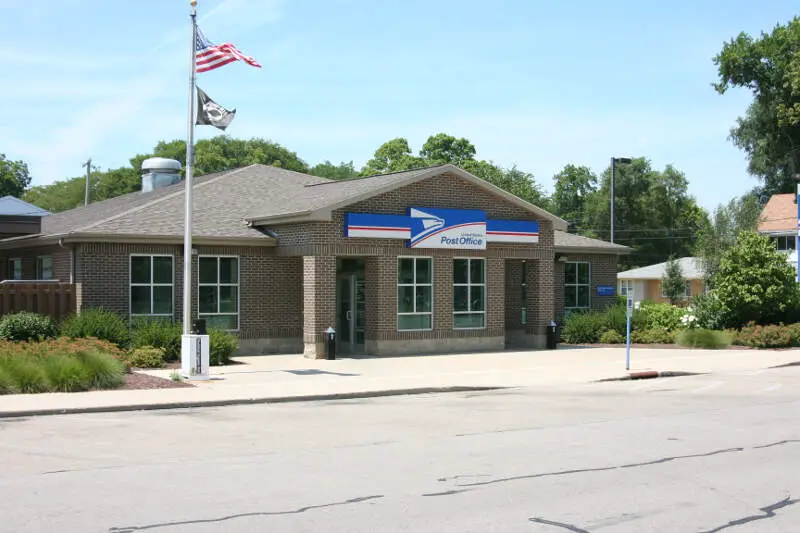

Life in Ogle County research summary. HomeSnacks has been researching the quality of life in Ogle County over the past eight years using Census data, FBI crime data, cost of living data, and other primary sources. Based on the most recently available data, we found the following about life in Ogle County:
The population in Ogle County is 51,672.
The median home value in Ogle County is $192,381.
The median income in Ogle County is $75,782.
The median rent in Ogle County is $841.
The unemployment rate in Ogle County is 6.0%.
The poverty rate in Ogle County is 8.3%.
The average high in Ogle County is 67.0° and there are 85.7 inches of rainfall annually.
The average high in Ogle County is 67.0°.
There are 74.7 nice days each year.
Expect an average of 85.7 inches of rain each year with 10.9 inches of snow.
There is an average of 4:40 hours of sun each day in Ogle County.
| Stat | Ogle County |
|---|---|
| Mean High | 67.0 |
| Nice Days | 74.7 |
| Rainfall | 85.7 |
| Snowfall | 10.9 |
| Sunny_hours | 4:40 |


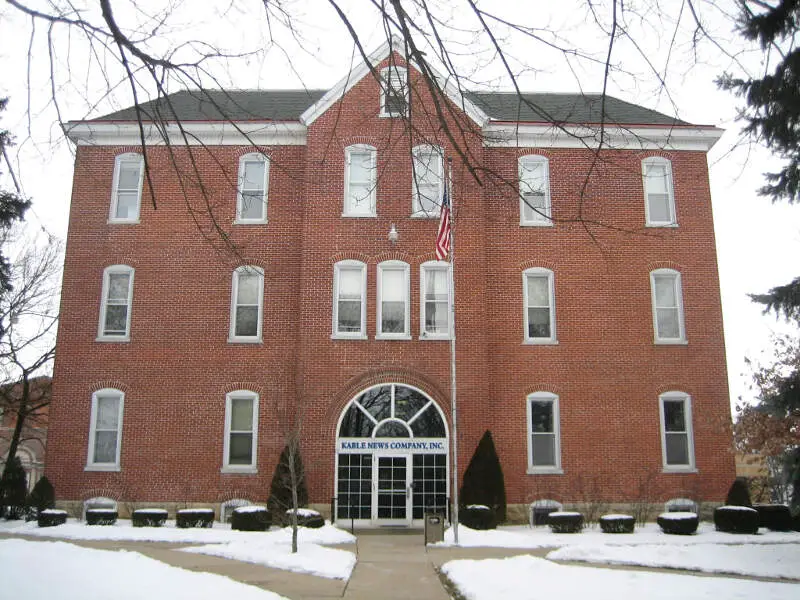
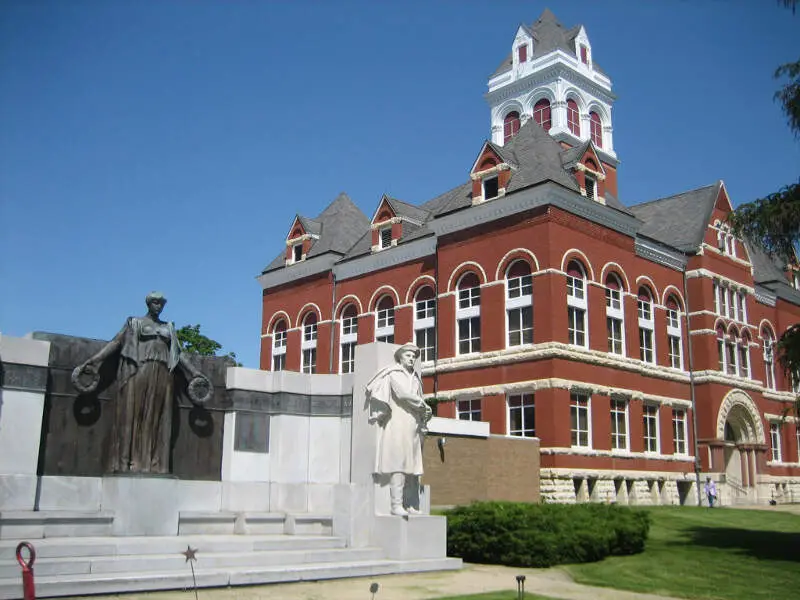
The current population in Ogle County is 51,672. The population has increased 1.5% from 2019.
| Year | Population | % Change |
|---|---|---|
| 2022 | 51,787 | 2.0% |
| 2021 | 50,793 | -0.5% |
| 2020 | 51,025 | - |
Ogle County is 50.0% female with 25,836 female residents.
Ogle County is 50.0% male with 25,836 male residents.
| Gender | Ogle County | IL | USA |
|---|---|---|---|
| Female | 50.0% | 50.5% | 50.4% |
| Male | 50.0% | 49.5% | 49.6% |
Ogle County is:
84.6% White with 43,699 White residents.
1.1% African American with 556 African American residents.
0.1% American Indian with 53 American Indian residents.
0.5% Asian with 249 Asian residents.
0.0% Hawaiian with 0 Hawaiian residents.
0.3% Other with 135 Other residents.
2.6% Two Or More with 1,335 Two Or More residents.
10.9% Hispanic with 5,645 Hispanic residents.
| Race | Ogle County | IL | USA |
|---|---|---|---|
| White | 84.6% | 59.6% | 58.9% |
| African American | 1.1% | 13.7% | 12.1% |
| American Indian | 0.1% | 0.1% | 0.6% |
| Asian | 0.5% | 5.7% | 5.7% |
| Hawaiian | 0.0% | 0.0% | 0.2% |
| Other | 0.3% | 0.3% | 0.4% |
| Two Or More | 2.6% | 2.8% | 3.5% |
| Hispanic | 10.9% | 17.8% | 18.7% |
4.3% of households in Ogle County earn Less than $10,000.
2.8% of households in Ogle County earn $10,000 to $14,999.
8.6% of households in Ogle County earn $15,000 to $24,999.
6.6% of households in Ogle County earn $25,000 to $34,999.
9.9% of households in Ogle County earn $35,000 to $49,999.
17.1% of households in Ogle County earn $50,000 to $74,999.
16.3% of households in Ogle County earn $75,000 to $99,999.
20.6% of households in Ogle County earn $100,000 to $149,999.
7.7% of households in Ogle County earn $150,000 to $199,999.
6.2% of households in Ogle County earn $200,000 or more.
| Income | Ogle County | IL | USA |
|---|---|---|---|
| Less than $10,000 | 4.3% | 5.3% | 4.9% |
| $10,000 to $14,999 | 2.8% | 3.5% | 3.8% |
| $15,000 to $24,999 | 8.6% | 6.7% | 7.0% |
| $25,000 to $34,999 | 6.6% | 7.1% | 7.4% |
| $35,000 to $49,999 | 9.9% | 10.1% | 10.7% |
| $50,000 to $74,999 | 17.1% | 15.4% | 16.1% |
| $75,000 to $99,999 | 16.3% | 12.9% | 12.8% |
| $100,000 to $149,999 | 20.6% | 17.6% | 17.1% |
| $150,000 to $199,999 | 7.7% | 9.4% | 8.8% |
| $200,000 or more | 6.2% | 12.1% | 11.4% |
2.0% of adults in Ogle County completed < 9th grade.
5.0% of adults in Ogle County completed 9-12th grade.
34.0% of adults in Ogle County completed high school / ged.
24.0% of adults in Ogle County completed some college.
11.0% of adults in Ogle County completed associate's degree.
15.0% of adults in Ogle County completed bachelor's degree.
7.0% of adults in Ogle County completed master's degree.
1.0% of adults in Ogle County completed professional degree.
1.0% of adults in Ogle County completed doctorate degree.
| Education | Ogle County | IL | USA |
|---|---|---|---|
| < 9th Grade | 2% | 6% | 3% |
| 9-12th Grade | 5% | 5% | 6% |
| High School / GED | 34% | 25% | 26% |
| Some College | 24% | 20% | 20% |
| Associate's Degree | 11% | 8% | 9% |
| Bachelor's Degree | 15% | 22% | 21% |
| Master's Degree | 7% | 11% | 10% |
| Professional Degree | 1% | 2% | 2% |
| Doctorate Degree | 1% | 1% | 2% |
HomeSnacks is based in Durham, NC.
We aim to deliver bite-sized pieces of infotainment about where you live.
We use data, analytics, and a sense of humor to determine quality of life for places across the nation.