Some of you might be asking yourself, at this very moment, is Texas a good place?
The answer is unequivocally yes… if you know where to locate the best counties to live in Texas.
Lucky for you, we’re here to help you identify the best counties to live in the Lone Star State based on the most recently available data from the Census. And this isn’t our first rodeo — we’ve been using Saturday Night Science to rank places for years.
The question becomes if you wanted to relocate to the best part of Texas, where would you go? To answer that, we looked at crime, cost of living, and demographic data for all 250 counties in the state.
Table Of Contents: Top Ten | Methodology | Table | FAQs | Summary
The 10 Best Counties To Live In Texas For 2025
- Comal County
- Rockwall County
- Collin County
- Williamson County
- Denton County
- Kendall County
- Armstrong County
- Fayette County
- Randall County
- Parker County
Comal County is the county to be when it comes to living the good life in Texas. And you should avoid Starr County if you can — at least according to the data.
Now you know exactly where to move in Texas. Keep on reading for more about the top ten and a detailed methodology.
Or, check out the best places to live in Texas and the cheapest places to live in Texas.
Table Of Contents: Top Ten | Methodology | Summary | Table
The Best Counties To Live In Texas For 2025
1. Comal County

Biggest Place: San Antonio
Population: 174,552
Median Income: $99,015 (10th best)
Median Home Price: $398,800 (7th best)
Unemployment Rate: 3.5% (74th best)
More on Comal County:
2. Rockwall County

Biggest Place: Dallas
Population: 116,931
Median Income: $124,917 (best)
Median Home Price: $386,000 (9th best)
Unemployment Rate: 4.0% (105th best)
More on Rockwall County:
3. Collin County

Biggest Place: Dallas
Population: 1,116,601
Median Income: $117,588 (2nd best)
Median Home Price: $447,600 (3rd best)
Unemployment Rate: 4.1% (111th best)
More on Collin County:
4. Williamson County

Biggest Place: Austin
Population: 643,889
Median Income: $108,309 (5th best)
Median Home Price: $414,600 (5th best)
Unemployment Rate: 4.0% (102nd best)
More on Williamson County:
5. Denton County
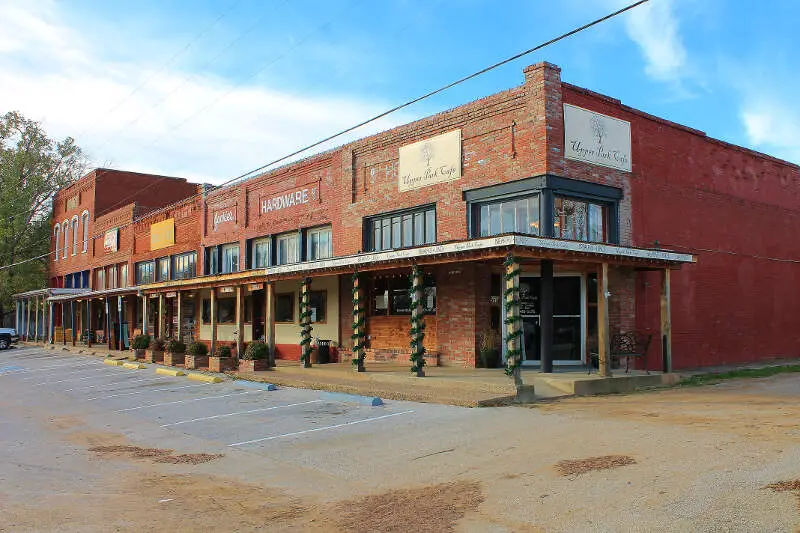
Biggest Place: Dallas
Population: 945,644
Median Income: $108,185 (6th best)
Median Home Price: $403,400 (6th best)
Unemployment Rate: 4.0% (100th best)
More on Denton County:
6. Kendall County
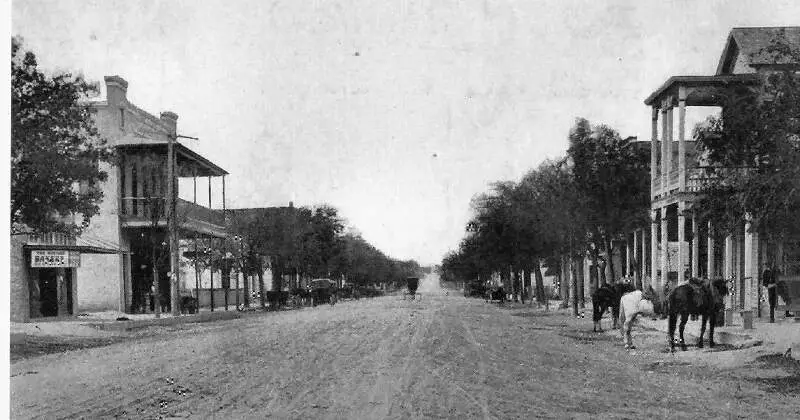
Biggest Place: Boerne
Population: 46,971
Median Income: $110,498 (4th best)
Median Home Price: $489,800 (best)
Unemployment Rate: 4.7% (139th best)
More on Kendall County:
7. Armstrong County
Biggest Place: Claude
Population: 1,883
Median Income: $68,462 (80th best)
Median Home Price: $185,700 (8best)
Unemployment Rate: 0.9% (16th best)
More on Armstrong County:
8. Fayette County
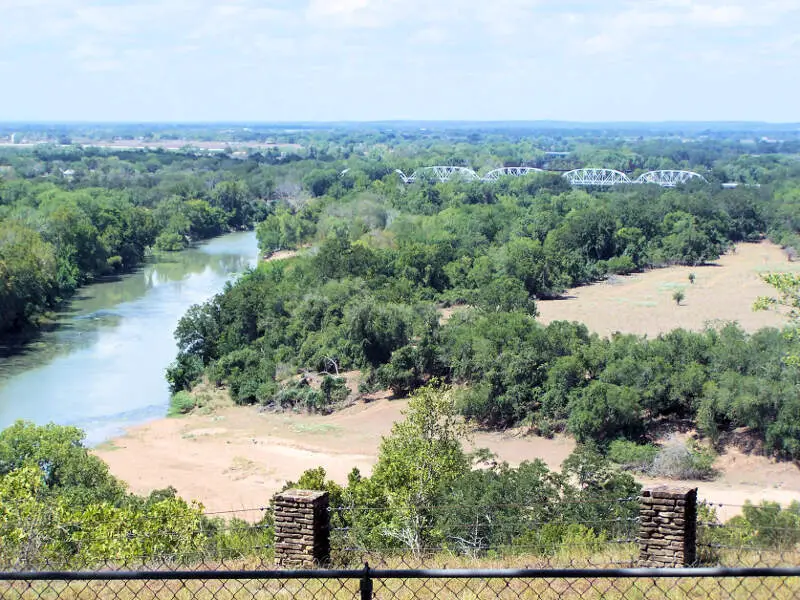
Biggest Place: La Grange
Population: 24,783
Median Income: $76,541 (42nd best)
Median Home Price: $271,100 (32nd best)
Unemployment Rate: 2.9% (59th best)
More on Fayette County:
9. Randall County

Biggest Place: Amarillo
Population: 143,791
Median Income: $80,905 (34th best)
Median Home Price: $227,500 (48th best)
Unemployment Rate: 2.9% (57th best)
More on Randall County:
10. Parker County
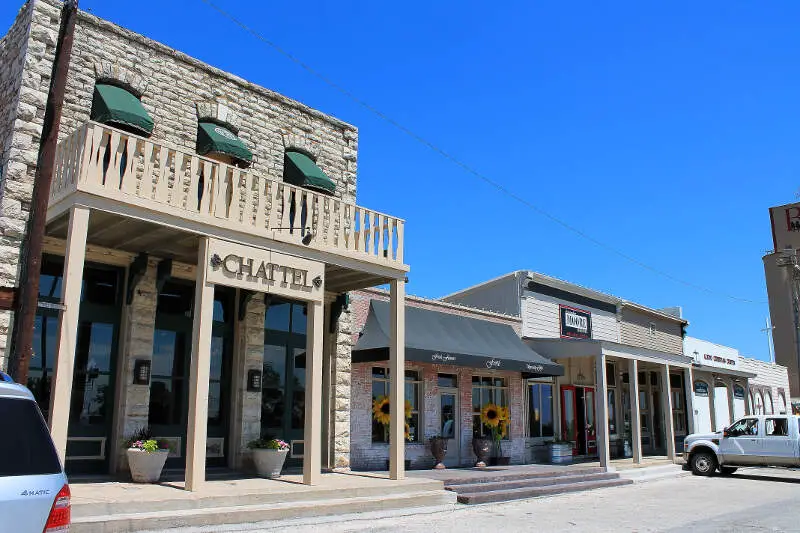
Biggest Place: Fort Worth
Population: 158,079
Median Income: $102,099 (9th best)
Median Home Price: $343,600 (12th best)
Unemployment Rate: 3.9% (97th best)
More on Parker County:
Methodology: How do you determine which Texas county is the best?
To give you the best county in Texas, we have to look at a handful of metrics that signal the quality of a place. To do that, we made assumptions about what’s in a “best county” and what isn’t. For reference, we are trying to make the kind of argument you’d make at a bar using facts, Saturday Night Science.
With that in mind, we went to two of the best data sources on the internet. Namely, the American Community Survey data and FBI Crime data for the most recent period.
We paid particular attention to:
- Violent Crime Rates
- Property Crime Rates
- Median Home Values
- Median Income
- Unemployment Rates
- Adult Education Levels
- Health Insurance Coverage
- Poverty Rates
We then ranked each county in Texas across each of the criteria from one to 250, with one being the best.
Taking the average rank across all criteria, we created a quality of life score with the county posting the lowest overall score being the “Best County To Live In Texas.”
The result is some of the safest, quietest, and best counties to raise a family in the Lone Star State.
We updated this article for 2025. This report is our tenth time ranking the best counties to live in Texas.
Read on to see why Comal County is the best county, while Starr County is probably in contention for being the worst county in Texas.
Summary: The Best Counties In Texas To Call Home For 2025
Living in Texas can vary from one part of the state to the next — who woulda thought?
The best counties in Texas are Comal County, Rockwall County, Collin County, Williamson County, Denton County, Kendall County, Armstrong County, Fayette County, Randall County, and Parker County.
But now you know the outstanding parts and the parts to avoid, and that’s why you came here to learn at the end of the day.
You are welcome.
Here’s a look at the worst counties in Texas according to the data:
- Starr County
- Hudspeth County
- Zapata County
For more Texas reading, check out:
- Best Counties To Live In Texas
- Safest Places In Texas
- Best Places To Retire In Texas
- Richest Cities In Texas
Detailed List Of The Best Counties In Texas
| Rank | County | Population | Median Income | Median Home Price |
|---|---|---|---|---|
| 1 | Comal County | 174,552 | $99,015 | $398,800 |
| 2 | Rockwall County | 116,931 | $124,917 | $386,000 |
| 3 | Collin County | 1,116,601 | $117,588 | $447,600 |
| 4 | Williamson County | 643,889 | $108,309 | $414,600 |
| 5 | Denton County | 945,644 | $108,185 | $403,400 |
| 6 | Kendall County | 46,971 | $110,498 | $489,800 |
| 7 | Armstrong County | 1,883 | $68,462 | $185,700 |
| 8 | Fayette County | 24,783 | $76,541 | $271,100 |
| 9 | Randall County | 143,791 | $80,905 | $227,500 |
| 10 | Parker County | 158,079 | $102,099 | $343,600 |
| 11 | Fort Bend County | 859,721 | $113,409 | $350,300 |
| 12 | Somervell County | 9,510 | $83,382 | $253,600 |
| 13 | Roberts County | 785 | $66,118 | $176,800 |
| 14 | Guadalupe County | 178,368 | $93,776 | $285,900 |
| 15 | Travis County | 1,307,625 | $97,169 | $487,600 |
| 16 | Blanco County | 12,008 | $87,564 | $396,200 |
| 17 | Wilson County | 51,501 | $92,461 | $286,300 |
| 18 | Carson County | 5,802 | $84,583 | $140,600 |
| 19 | Brazoria County | 381,650 | $95,155 | $276,800 |
| 20 | Hays County | 256,429 | $85,827 | $371,400 |
| 21 | Burnet County | 51,064 | $77,158 | $310,500 |
| 22 | Montgomery County | 654,722 | $97,266 | $317,500 |
| 24 | Borden County | 723 | $64,250 | $105,400 |
| 25 | Ellis County | 203,927 | $95,898 | $306,400 |
| 26 | Lampasas County | 22,267 | $76,919 | $236,000 |
| 27 | Washington County | 36,156 | $75,085 | $270,100 |
| 28 | Mason County | 3,951 | $68,750 | $274,600 |
| 29 | Brewster County | 9,464 | $52,612 | $216,000 |
| 30 | Mills County | 4,499 | $64,494 | $200,200 |
| 31 | Hood County | 64,198 | $86,802 | $281,300 |
| 32 | Hartley County | 5,307 | $82,122 | $213,200 |
| 33 | Galveston County | 354,721 | $85,348 | $284,900 |
| 34 | Gillespie County | 27,202 | $67,799 | $432,300 |
| 35 | Midland County | 171,496 | $93,984 | $293,000 |
| 36 | Kaufman County | 160,718 | $88,606 | $290,800 |
| 37 | Medina County | 52,419 | $73,462 | $220,000 |
| 38 | Lavaca County | 20,479 | $61,768 | $220,900 |
| 39 | Grayson County | 139,988 | $70,455 | $228,300 |
| 40 | Glasscock County | 1,070 | $106,806 | $248,600 |
| 41 | Taylor County | 144,259 | $66,406 | $190,300 |
| 42 | Terrell County | 851 | $46,989 | $152,200 |
| 43 | Johnson County | 188,820 | $81,826 | $254,600 |
| 44 | Kerr County | 53,166 | $67,927 | $285,100 |
| 45 | Clay County | 10,402 | $77,355 | $161,300 |
| 46 | Rains County | 12,505 | $64,874 | $214,900 |
| 47 | Wise County | 72,359 | $89,897 | $277,200 |
| 48 | Colorado County | 20,736 | $68,554 | $194,000 |
| 49 | Irion County | 1,432 | $58,125 | $152,600 |
| 50 | Tom Green County | 119,398 | $66,254 | $186,700 |
| 51 | Burleson County | 18,327 | $72,888 | $174,000 |
| 52 | Tarrant County | 2,135,743 | $81,905 | $294,100 |
| 53 | Archer County | 8,734 | $71,958 | $175,300 |
| 54 | Llano County | 22,011 | $65,636 | $322,300 |
| 55 | Austin County | 30,712 | $75,994 | $270,900 |
| 56 | Coryell County | 83,772 | $68,904 | $177,400 |
| 58 | Delta County | 5,345 | $62,855 | $149,400 |
| 59 | Smith County | 238,014 | $71,923 | $220,800 |
| 60 | Chambers County | 49,178 | $108,114 | $289,900 |
| 61 | Sterling County | 1,389 | $78,750 | $143,200 |
| 62 | Calhoun County | 19,921 | $71,870 | $150,000 |
| 63 | Cooke County | 42,473 | $72,472 | $224,600 |
| 64 | Hardin County | 57,126 | $72,532 | $188,200 |
| 65 | Bosque County | 18,546 | $69,339 | $184,500 |
| 66 | Crockett County | 2,881 | $81,739 | $140,000 |
| 67 | Shackelford County | 3,169 | $64,659 | $176,900 |
| 68 | Hemphill County | 3,311 | $72,052 | $214,900 |
| 69 | Bandera County | 21,589 | $69,703 | $249,800 |
| 70 | Franklin County | 10,522 | $66,800 | $213,200 |
| 71 | Fisher County | 3,661 | $64,700 | $77,600 |
| 72 | Callahan County | 14,017 | $68,455 | $144,800 |
| 73 | Fannin County | 36,525 | $68,377 | $213,500 |
| 74 | Freestone County | 19,813 | $58,460 | $164,400 |
| 75 | Oldham County | 2,097 | $76,402 | $144,800 |
| 76 | Kent County | 727 | $71,420 | $108,900 |
| 77 | Childress County | 6,772 | $60,333 | $115,100 |
| 78 | Kimble County | 4,355 | $65,703 | $173,100 |
| 79 | Van Zandt County | 61,323 | $68,274 | $199,500 |
| 80 | Upshur County | 41,864 | $62,794 | $171,200 |
| 81 | Orange County | 84,993 | $73,372 | $163,400 |
| 82 | Sherman County | 2,434 | $74,167 | $125,500 |
| 83 | Hunt County | 104,917 | $70,112 | $210,900 |
| 84 | Mclennan County | 263,608 | $63,888 | $219,200 |
| 85 | Rusk County | 52,613 | $67,506 | $166,900 |
| 86 | Donley County | 3,276 | $56,648 | $90,500 |
| 87 | Bell County | 379,811 | $66,051 | $221,100 |
| 88 | Kinney County | 3,140 | $66,341 | $88,500 |
| 89 | Martin County | 5,230 | $77,083 | $162,200 |
| 90 | Hutchinson County | 20,413 | $65,470 | $102,200 |
| 91 | Lubbock County | 314,633 | $63,367 | $199,600 |
| 92 | Wood County | 46,094 | $62,524 | $195,100 |
| 93 | Bexar County | 2,037,344 | $70,571 | $244,100 |
| 94 | Brazos County | 237,980 | $58,388 | $279,700 |
| 95 | Goliad County | 7,096 | $59,556 | $182,800 |
| 96 | Victoria County | 91,281 | $70,101 | $197,600 |
| 97 | Montague County | 20,599 | $62,818 | $189,400 |
| 98 | Reagan County | 3,259 | $70,288 | $163,700 |
| 99 | Aransas County | 24,449 | $61,754 | $236,800 |
| 100 | Bastrop County | 102,370 | $82,730 | $269,500 |
| 101 | Bowie County | 92,321 | $59,295 | $161,300 |
| 102 | Stonewall County | 1,244 | $61,250 | $54,700 |
