Compare Dallas to…
Dallas SnackAbility
Overall SnackAbility
Crime in Dallas summary. We use data from the FBI to determine the crime rates in Dallas. Key points include:
There were 52,993 total crimes in Dallas in the last reporting year.
The overall crime rate per 100,000 people in Dallas is 4,010.1 / 100k people.
The violent crime rate per 100,000 people in Dallas is 658.2 / 100k people.
The property crime rate per 100,000 people in Dallas is 3,351.9 / 100k people.
Overall, crime in Dallas is 89.22% above the national average.
Total Crimes
Above National Average
Crime In Dallas Comparison Table
| Statistic | Count Raw |
Dallas / 100k People |
Texas / 100k People |
National / 100k People |
|---|---|---|---|---|
| Total Crimes Per 100K | 52,993 | 4,010.1 | 2,429.9 | 2,119.2 |
| Violent Crime | 8,698 | 658.2 | 389.4 | 359.0 |
| Murder | 180 | 13.6 | 5.2 | 5.0 |
| Robbery | 2,227 | 168.5 | 63.5 | 61.0 |
| Aggravated Assault | 5,816 | 440.1 | 270.7 | 256.0 |
| Property Crime | 44,295 | 3,351.9 | 2,040.5 | 1,760.0 |
| Burglary | 6,133 | 464.1 | 284.3 | 229.0 |
| Larceny | 23,619 | 1,787.3 | 1,425.6 | 1,272.0 |
| Car Theft | 14,543 | 1,100.5 | 330.7 | 259.0 |
Source: FBI Uniform Crime Reporting (2024)
Cost of living in Dallas summary. We use data on the cost of living to determine how expensive it is to live in Dallas. Real estate prices drive most of the variance in cost of living around Texas. Key points include:
The cost of living in Dallas is 106 with 100 being average.
The cost of living in Dallas is 1.1x higher than the national average.
The median home value in Dallas is $309,420.
The median income in Dallas is $70,518.
Dallas's Overall Cost Of Living
Higher Than The National Average
Cost Of Living In Dallas Comparison Table
| Living Expense | Dallas | Texas | National Average |
|---|---|---|---|
| Overall | 106 | 93 | 100 |
| Services | 102 | 100 | 100 |
| Groceries | 103 | 99 | 100 |
| Health | 115 | 81 | 100 |
| Housing | 106 | 97 | 100 |
| Transportation | 108 | 103 | 100 |
| Utilities | 104 | 100 | 100 |
Source: Cost of living index, normalized to US average = 100
Dallas, TX Weather
The average high in Dallas is 76.3° and the average low is 55.6°.
There are 53.5 days of precipitation each year.
Expect an average of 38.5 inches of precipitation each year with 1.3 inches of snow.
| Stat | Dallas |
|---|---|
| Average Annual High | 76.3 |
| Average Annual Low | 55.6 |
| Annual Precipitation Days | 53.5 |
| Average Annual Precipitation | 38.5 |
| Average Annual Snowfall | 1.3 |
Average High
Days of Rain
Source: NOAA climate normals (30-year)
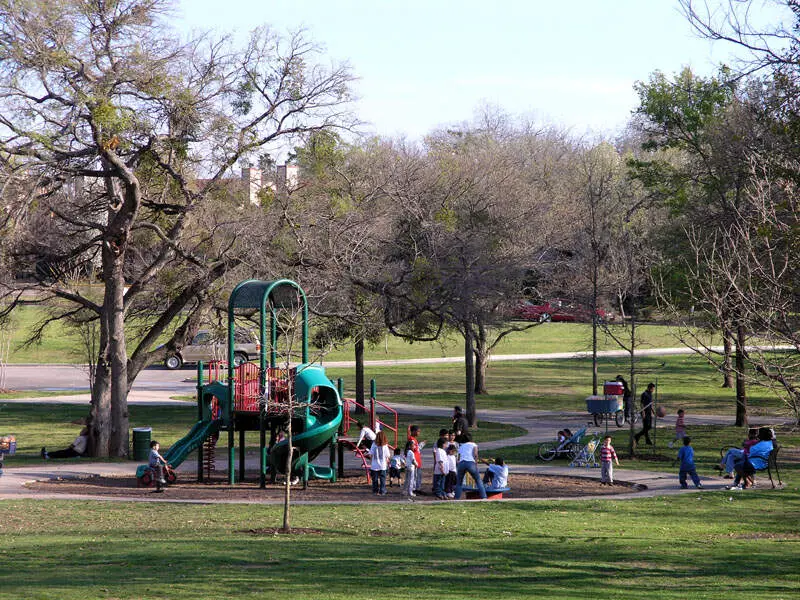
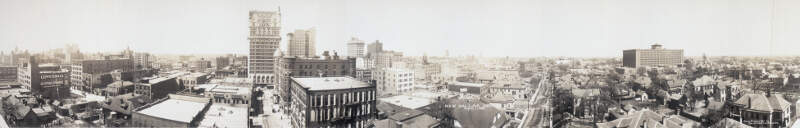
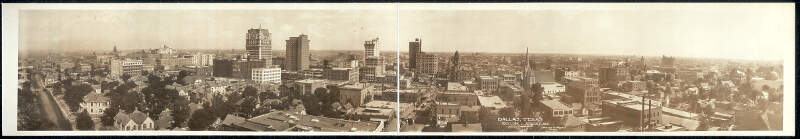
Dallas, TX Photos


17 Reviews & Comments About Dallas

I live in Dallas. Crime is bad, traffic is horrendous, schools are questionable, you almost cannot get a job unless you speak Spanish
Dallas is my favorite place to live in America. I studied here during college.
There is lot of good foods available, especially if you like the Tex Mex kind of foods.
I moved to Dallas 5 years ago and lived there for 2 years learning the flooring trade. Great people I met there and the atmosphere is awesome. The tall beautiful buildings are awesome and I loved the rain because I love rain it rained a lot there the 2 years that I was there. They have so many businesses and good places to go visit and have fun to go see things downtown. I really liked living down there and meeting the nice people that I met through work and while I was out and about. I will definitely would want to move back.
What stood out to me was all the great food places you can try. So many was so great especially all the different barbeque places. The bad thing at that time may be still going on is the construction on the roads. Also, so many people are moving there and it is growing fast which can be good but at the same time not so good. It was very congested a few years ago and need to go back to see if it is still congested. For being a big city the crime and the construction is what is bad in my opinion about Dallas. Other than that it is an awesome place to visit and live.
i love my school life and college life..because i am staying at 40 years in my city...i love my place and i love my country...my neighborhood is so nice..maximum i spent my time at neighbor house...no problems no irritated
I like to watch a new movies...so, my entertainment place is mall..i love that place..my place is very calm and simply smooth going on my time..
Dallas is a large city with a lot of different things to do, and has something that everyone can enjoy. The Perot Museum is a great place to take your children to have a fun, hands-on learning experience about different subjects, and also has fun things for adults. Dallas also offers several neighborhoods with clubs and bars that cater towards younger individuals that like to engage in nightlife. For those who like to be outdoors, there are a lot of parks in the Dallas area, several of which are home to various Pokestops and Gyms for people who enjoy playing Pokemon GO.
As with any city, there are definitely a few places and neighborhoods that should be avoided. If you stick to the main areas of Dallas, you shouldn't experience too many issues. Be warned, DART which handles Dallas' bus and train line, can have some issues, so if you plan on using this as your mode of travel, remember to compensate for delays.
Dallas is surprising more lively than I would have originally expected. There is a good bit of diversity amongst the people and cultures. Dallas is the kind of city that encourages me to physically explore my surrounds more do to the abundance of unique sites to see. The neighborhoods are beautiful yet slightly anxiety-inducing because they consist of very elaborate mansion-like home that can be at times overwhelming to look at. The schools seem to be inviting and inclusive to the community.
My partner and I found one of the best restaurants we have ever visited in Dallas. "Rodeo Goat" was the perfect spot to grab unique burgers at an open atmosphere. I also noticed that some restaurants were interactive with providing games for the public such as volleyball. The only con to Dallas is the horrible traffic. Sometimes it takes a whole extra hour to get to a destination that should have only taken 15 minutes.
Everything was good. I stayed down there for 2 years. So many things to do.
Everything stood out. There tall buildings and rainy days stood out the most. Also the many things u can think of stood out.
Dallas is a great place it's very beautiful and clean the people are very nice and the streets are wide plenty of room
The tall buildings and the sports
I have been in dallas 14 years now coming from Lubbock Texas. Dallas is a very busy metropolitan city that is growing fast. We have many shops and different bars and restaurants to go to that are quite good. I have visited California and the beach was wonderful, but the city itself was not comparable to Dallas. The people are very friendly and the city has many jobs.
I like to try new restaurants and bars and dallas has many good ones to go to. The cost of living in Dallas is reasonable and its growing.
I really like dalla texa for its beautiful things that this beautiful state gives us
the bad thing is that there is not as much security as in the times before I would like to see that security again
I consider that Dallas, TX is the place to be. Is the second largest state in the American Union.
It is full of great places for adventure, music festivals, incredible museums and a spectacular gastronomy.
My favorite place is the Perot Museum of Nature and Science, this place has a skeleton replica of T-Rex, as if from a movie. Also is the Bishop Art District, which is an option for those looking for something different. Located in one of the most elegant and central areas of the city. In this place you will find clothing stores, theaters, restaurants and art galleries; Walking it on foot will be a good experience, like coming out of a movie
a very safe city in all the time I have been here I have not had problems, assaults, a very attentive police and you feel the security in every avenue and route, the schools are literally close, the school routes always pass on time and the schools They are very efficient
the center of dallas is very beautiful is my favorite place in the city, however sometimes it has a difficult access
very good experience living here in dallas there are very good things very good tourism many cars both classic and modern there is something to see in this beautiful city
I still have not got anything bad I can not complain about anything yet thanks to G*d everything is going very well and I hope it keeps going like this in my
Dallas texas is a great place to be. This city is a modern metropolis of North Texas and a commercial and cultural center of the region. The most dangerous parts of Texas, in general, are not the largest cities, only the five most populated cities. West Texas also has a higher crime rate than the rest of the state and Austin is basically a fairy tale land populated by elves and hobbits.
Dallas offers different ways to appreciate it. The Arts District is a wonderful place that includes a lot of museums, buildings of ingenious architecture and cultural centers, or venturing into its incredible ecotourism activities. This multifaceted city is also recognized for its impressive skyscrapers, fairs and attractions.
Dallas city is a beautiful city to live with comparatively less crime records and lots of schools are there in the city for providing education.
There are many things to watch out for in Dallas.My favorite place is Dallas Heritage Village
lately there have been several crimes in these neighborhoods
my phone was almost stolen
Dallas is cool alot of job opportunities and Buisness friendly,real estate is reasonable and alot of great places to eat,alot of fun things to do,good club scene one of fast growing Metropolitan in U.S,downside spread out traffic,is crazy but better then la or NYC or bay area,schools moderate,but the suburbs are excellent,crime is moderate most crimes in poverty neighborhoods which that in every city including Oklahoma or North Portland but quality of life a plus
Deep elum,Uptown,Cedar springs area bishop district, North Dallas and parts of Oak cliff are good neighborhoods,other areas are older with crime and poverty. The suburbs are great Plano,Irving,Frisco,Desoto,Grand parie
Rankings & Articles For Dallas


Locations Around Dallas
Map Of Dallas, TX
Best Places Around Dallas
Murphy, TX
Population 21,188
Plano, TX
Population 290,594
University Park, TX
Population 25,155
Coppell, TX
Population 42,154
Carrollton, TX
Population 133,740
Richardson, TX
Population 118,731
Sachse, TX
Population 30,491
Farmers Branch, TX
Population 36,645
Euless, TX
Population 60,421
Rowlett, TX
Population 65,463
Dallas Demographics And Statistics
Population over time in Dallas
The current population in Dallas is 1,307,930. The population has increased 10.2% from 2010.
| Year | Population | % Change |
|---|---|---|
| 2024 | 1,307,930 | 0.6% |
| 2023 | 1,299,553 | -0.1% |
| 2022 | 1,300,642 | 0.0% |
| 2021 | 1,300,239 | -2.9% |
| 2020 | 1,338,846 | 0.6% |
| 2019 | 1,330,612 | 0.9% |
| 2018 | 1,318,806 | 1.4% |
| 2017 | 1,300,122 | 1.7% |
| 2016 | 1,278,433 | 1.4% |
| 2015 | 1,260,688 | 1.6% |
| 2014 | 1,240,985 | 1.5% |
| 2013 | 1,222,167 | 1.2% |
| 2012 | 1,207,202 | 0.9% |
| 2011 | 1,196,258 | 0.8% |
| 2010 | 1,187,285 | - |
Race / Ethnicity in Dallas
See the full breakdown
Dallas is:
27.6% White with 361,309 White residents.
22.9% African American with 299,064 African American residents.
0.2% American Indian with 2,179 American Indian residents.
3.8% Asian with 49,936 Asian residents.
0.1% Hawaiian with 828 Hawaiian residents.
0.3% Other with 3,962 Other residents.
2.6% Two Or More with 33,748 Two Or More residents.
42.6% Hispanic with 556,904 Hispanic residents.
| Race | Dallas | TX | USA |
|---|---|---|---|
| White | 27.6% | 39.1% | 57.4% |
| African American | 22.9% | 11.9% | 11.9% |
| American Indian | 0.2% | 0.1% | 0.5% |
| Asian | 3.8% | 5.5% | 5.9% |
| Hawaiian | 0.1% | 0.1% | 0.2% |
| Other | 0.3% | 0.4% | 0.6% |
| Two Or More | 2.6% | 3.1% | 4.3% |
| Hispanic | 42.6% | 39.7% | 19.3% |
Gender in Dallas
See the full breakdown
Dallas is 50.0% female with 653,610 female residents.
Dallas is 50.0% male with 654,319 male residents.
| Gender | Dallas | TX | USA |
|---|---|---|---|
| Female | 50.0% | 50.1% | 50.5% |
| Male | 50.0% | 49.9% | 49.5% |
Highest level of educational attainment in Dallas for adults over 25
See the full breakdown
12.0% of adults in Dallas completed < 9th grade.
8.0% of adults in Dallas completed 9-12th grade.
21.0% of adults in Dallas completed high school / ged.
16.0% of adults in Dallas completed some college.
5.0% of adults in Dallas completed associate's degree.
23.0% of adults in Dallas completed bachelor's degree.
10.0% of adults in Dallas completed master's degree.
3.0% of adults in Dallas completed professional degree.
2.0% of adults in Dallas completed doctorate degree.
| Education | Dallas | TX | USA |
|---|---|---|---|
| < 9th Grade | 12.0% | 8.0% | 4.0% |
| 9-12th Grade | 8.0% | 7.0% | 6.0% |
| High School / GED | 21.0% | 24.0% | 26.0% |
| Some College | 16.0% | 20.0% | 19.0% |
| Associate's Degree | 5.0% | 8.0% | 9.0% |
| Bachelor's Degree | 23.0% | 21.0% | 22.0% |
| Master's Degree | 10.0% | 9.0% | 10.0% |
| Professional Degree | 3.0% | 2.0% | 2.0% |
| Doctorate Degree | 2.0% | 1.0% | 2.0% |
Household Income For Dallas, Texas
See the full breakdown
6.0% of households in Dallas earn Less than $10,000.
4.2% of households in Dallas earn $10,000 to $14,999.
6.4% of households in Dallas earn $15,000 to $24,999.
7.3% of households in Dallas earn $25,000 to $34,999.
11.4% of households in Dallas earn $35,000 to $49,999.
17.9% of households in Dallas earn $50,000 to $74,999.
12.6% of households in Dallas earn $75,000 to $99,999.
14.3% of households in Dallas earn $100,000 to $149,999.
7.2% of households in Dallas earn $150,000 to $199,999.
12.6% of households in Dallas earn $200,000 or more.
| Income | Dallas | TX | USA |
|---|---|---|---|
| Less than $10,000 | 6.0% | 5.0% | 5.0% |
| $10,000 to $14,999 | 4.2% | 3.3% | 3.4% |
| $15,000 to $24,999 | 6.4% | 6.3% | 6.3% |
| $25,000 to $34,999 | 7.3% | 6.8% | 6.6% |
| $35,000 to $49,999 | 11.4% | 10.5% | 10.1% |
| $50,000 to $74,999 | 17.9% | 16.1% | 15.5% |
| $75,000 to $99,999 | 12.6% | 12.8% | 12.6% |
| $100,000 to $149,999 | 14.3% | 17.3% | 17.5% |
| $150,000 to $199,999 | 7.2% | 9.5% | 9.6% |
| $200,000 or more | 12.6% | 12.5% | 13.4% |
Source: U.S. Census ACS 5-year estimates (2024)


