Suppose real estate is the most significant investment a majority of people make in their lifetime. In that case, it’s best to understand the places in Illinois with best potential return on investment.
After working in real estate adjacent roles for over a decade, I had the hypothesis that the best place to buy for a return on investment would be up-and-coming cities. Smaller cities where crime might be high now, but people still move to.
To test my hypothesis, we are going to look at places in Illinois that are growing faster than average, but where home prices are below average, and crime rates are higher than average.
In everyday terms, these might be “deals”. The best deal in Illinois at the moment according to Saturday Night Science? That would be Coal City.
Table Of Contents: Top Ten | Methodology | Summary | Table
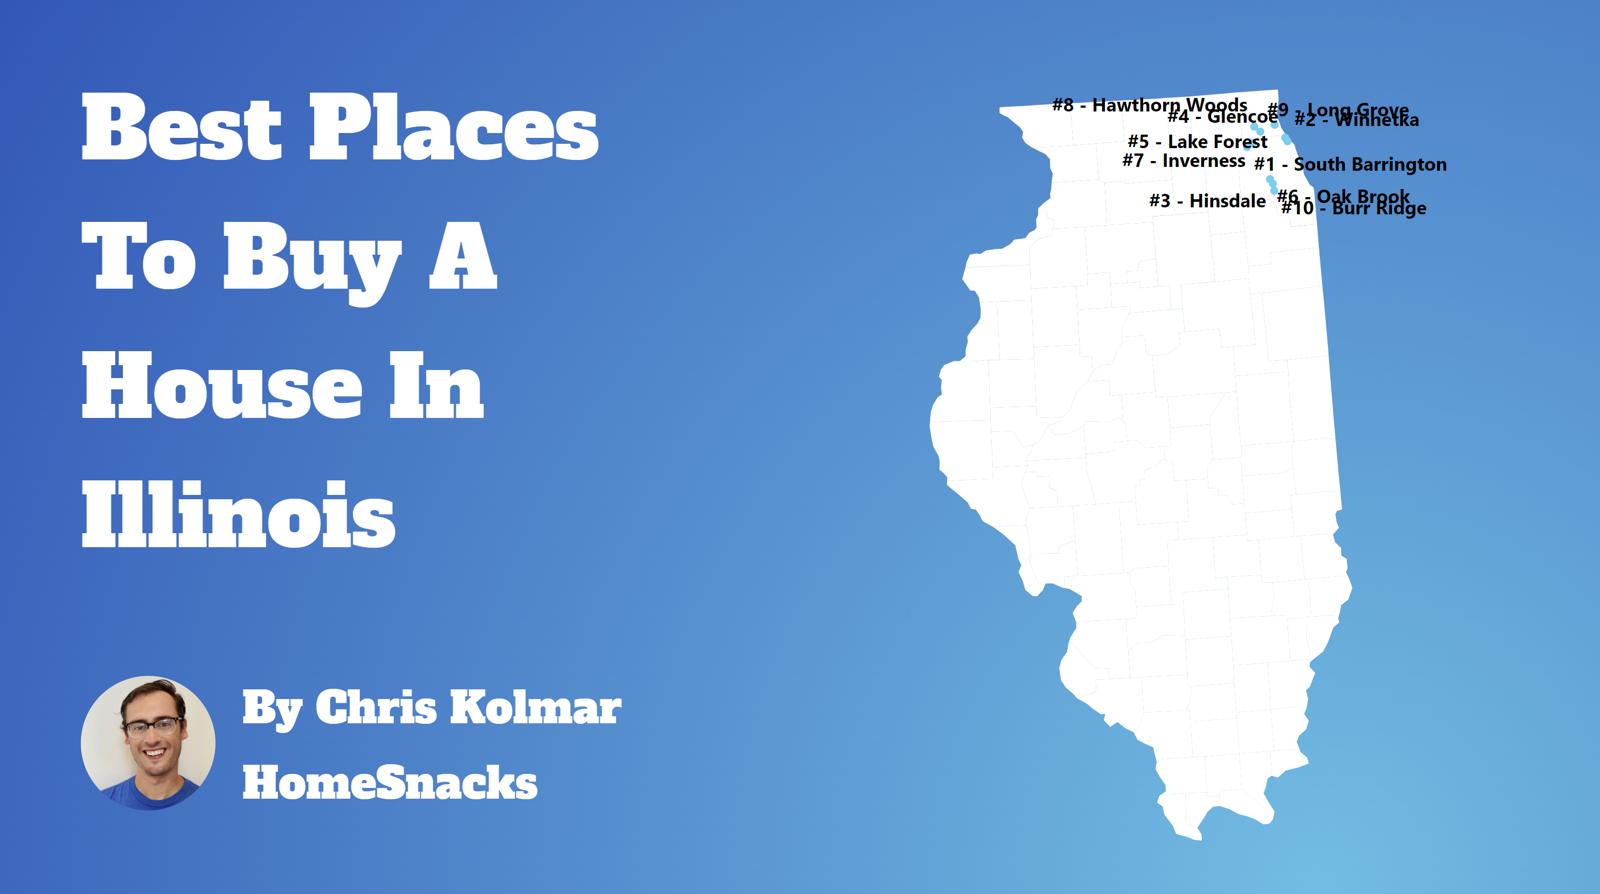
The 10 Best Places To Buy A Home In Illinois For 2026
The methodology that wen’t into this can be a bit complicated, so we’ll break it down for you in as much detail as we can below.
For more Illinois reading:
- Best Counties To Live In Illinois
- Best Places To Raise A Family In Illinois
- Best Places To Retire In Illinois
The 10 Best Cities To Buy A House In Illinois For 2026
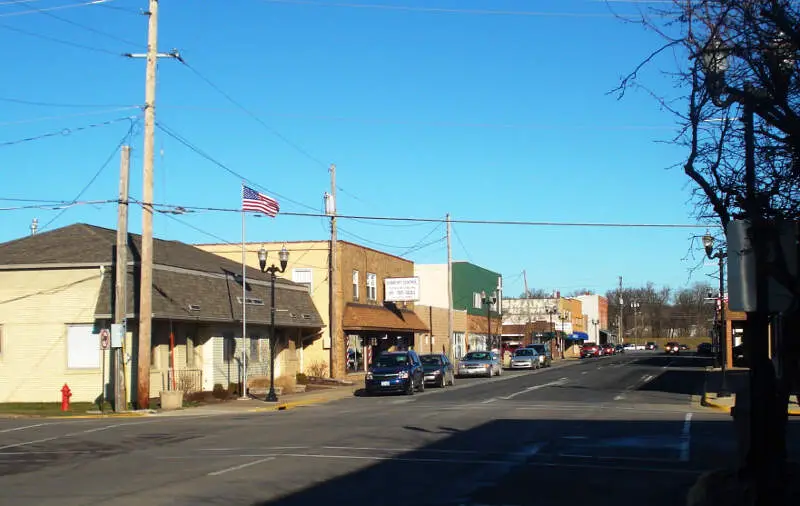
1. Coal City

/10
Population: 5,317
Median Home Price: $264,378
Population Change: 3.3%
Home Price Change: 2.0%
More on Coal City: Movers
/10
/10
Population: 5,034
Median Home Price: $184,801
Population Change: -0.1%
Home Price Change: -2.9%
More on Milan: Data | Crime | Cost Of Living | Movers
/10
Population: 5,199
Median Home Price: $292,137
Population Change: -0.4%
Home Price Change: 0.3%
More on Berkeley: Data | Crime | Cost Of Living | Movers
/10
Population: 5,108
Median Home Price: $337,963
Population Change: 0.1%
Home Price Change: -0.1%
More on Monee: Data | Crime | Cost Of Living | Movers
/10
Population: 5,492
Median Home Price: $310,628
Population Change: -3.4%
Home Price Change: 2.2%
More on Genoa: Data | Crime | Cost Of Living | Movers
/10
Population: 5,442
Median Home Price: $534,062
Population Change: 0.8%
Home Price Change: 1.1%
More on Lake Barrington: Data | Cost Of Living | Movers
/10
Population: 5,476
Median Home Price: $138,946
Population Change: -0.6%
Home Price Change: -2.6%
More on Spring Valley: Data | Crime | Cost Of Living | Movers
/10
Population: 5,034
Median Home Price: $81,733
Population Change: -0.1%
Home Price Change: 9.6%
More on Hoopeston: Data | Crime | Cost Of Living | Movers
/10
Population: 5,301
Median Home Price: $467,497
Population Change: 1.1%
Home Price Change: -0.0%
More on Highwood: Data | Crime | Cost Of Living | Movers
Methodology: How do you determine the best places to buy a home in Illinois for 2026?
We were in real estate for almost five years and have worked on this site for another 11. Suffice it to say we’ve put a lot of thought into finding an excellent place to buy a home.
So all that thinking has come to this moment where we get to spell out how we’d approach finding an up-and-coming place to live in Illinois. Put differently, the analysis will try to find places in Illinois with undervalued homes relative to pent-up demand using Saturday Night Science.
To do that, we looked at the most recent American Community Survey Census data for 2020-2024 and compared it to the previous vintage. Specifically, we used the following criteria:
- Y-o-Y Change In Population (People want to live here)
- Y-o-Y Change In Median Home Prices (People are willing to pay for it)
- Home Prices Relative To The State Average (It’s still kinda cheap)
We want places that are growing, have seen home prices increase in recent years, and are still “cheap” for Illinois with the following caveats:
- Home prices had to be within 20% of the state average (Much lower than that, and you get to some of the more dangerous places)
- Home prices increased in the last year, and
- Above 5,000 people (Bigger cities have more data points)
So of the 0 cities and towns in Illinois, only 330 places made it through our initial filters to even be considered.
We then ranked each place from 1 to 330 for the above criteria, with 1 being the best. We averaged the rankings to create a “best place to buy” index, with the place having the lowest index being the best.
Turns out that Coal City is the best potential gem in the not-so-rough in the Prairie State.
Summary: The Best Places To Purchase A House In Illinois for 2026
There’s our analysis of the best places to buy a house in Illinois. And, to be clear, we aren’t necessarily saying these places are the best places to live, just that it looks like they might be in a couple of years based on the data.
In fact, every place in the following table meets our criteria, so even though it may not look super long, remember we started off with all 0 places in the state.
The best cities to buy a house in Illinois are Coal City, South Barrington, Milan, Berkeley, Monee, Genoa, Lake Barrington, Spring Valley, Hoopeston, and Highwood.
So if we’d could rent or buy in these cities, we’d definitely buy.
For more Illinois reading, check out:
Best Places To Buy A Home In Illinois
| Rank | City | Population | Median Home Price | Population Change | Home Price Increase |
|---|---|---|---|---|---|
| 1 | Coal City | 5,317 | $264,378 | 3.3% | 2.0% |
| 2 | South Barrington | 5,021 | $1,108,364 | 0.3% | 0.1% |
| 3 | Milan | 5,034 | $184,801 | -0.1% | -2.9% |
| 4 | Berkeley | 5,199 | $292,137 | -0.4% | 0.3% |
| 5 | Monee | 5,108 | $337,963 | 0.1% | -0.1% |
| 6 | Genoa | 5,492 | $310,628 | -3.4% | 2.2% |
| 7 | Lake Barrington | 5,442 | $534,062 | 0.8% | 1.1% |
| 8 | Spring Valley | 5,476 | $138,946 | -0.6% | -2.6% |
| 9 | Hoopeston | 5,034 | $81,733 | -0.1% | 9.6% |
| 10 | Highwood | 5,301 | $467,497 | 1.1% | -0.0% |
| 11 | Colona | 5,139 | $177,129 | -1.0% | -1.5% |
| 12 | Pana | 5,217 | $104,180 | -1.1% | 1.4% |
| 13 | Pinckneyville | 5,018 | $124,846 | -0.7% | 0.3% |
| 14 | Eureka | 5,007 | $205,467 | -1.7% | -1.8% |
| 15 | Volo | 6,706 | $366,347 | 4.8% | -0.3% |
| 16 | Beardstown | 6,169 | $87,128 | 2.0% | 0.9% |
| 17 | Lake Bluff | 6,041 | $633,529 | 3.5% | 2.9% |
| 18 | Elburn | 6,354 | $448,721 | 5.0% | 0.8% |
| 19 | Willow Springs | 5,868 | $386,669 | -0.1% | 3.1% |
| 20 | Carlinville | 5,480 | $140,570 | -1.7% | -0.7% |
| 21 | Spring Grove | 5,917 | $406,655 | 0.9% | 0.0% |
| 22 | Northfield | 5,487 | $841,445 | -3.4% | 3.9% |
| 23 | Mount Zion | 5,660 | $193,289 | -6.8% | -0.1% |
| 24 | Du Quoin | 5,726 | $95,487 | -0.9% | -1.3% |
| 25 | Posen | 5,292 | $188,148 | -0.7% | -1.0% |
| 26 | Monticello | 6,304 | $267,358 | -0.4% | -0.6% |
| 27 | Lakemoor | 6,467 | $283,780 | 10.0% | 0.4% |
| 28 | Pontoon Beach | 6,025 | $187,320 | -1.7% | -0.3% |
| 29 | Peoria Heights | 5,825 | $115,398 | -0.2% | -0.9% |
| 30 | Carterville | 5,818 | $178,565 | -0.1% | -2.3% |
| 31 | Wilmington | 5,494 | $263,749 | -0.2% | 0.5% |
| 32 | Hampshire | 8,524 | $407,966 | 2.1% | 2.5% |
| 33 | Countryside | 6,267 | $374,268 | -0.4% | 2.8% |
| 34 | East Alton | 5,689 | $93,630 | -0.7% | -5.0% |
| 35 | Metropolis | 5,864 | $117,764 | -0.6% | 4.8% |
| 36 | Bartonville | 5,841 | $130,911 | -0.2% | -2.5% |
| 37 | Hillsboro | 5,803 | $139,938 | 1.9% | 2.4% |
| 38 | Chillicothe | 5,900 | $177,740 | -4.6% | -1.1% |
| 39 | Braidwood | 6,062 | $273,094 | -1.8% | -0.9% |
| 40 | Johnsburg | 6,386 | $393,344 | 0.2% | 0.6% |
| 41 | North Riverside | 7,249 | $340,576 | -3.3% | 0.3% |
| 42 | Geneseo | 6,673 | $238,661 | 1.5% | 0.6% |
| 43 | Stickney | 6,952 | $286,404 | -0.1% | -0.6% |
| 44 | Vandalia | 5,796 | $125,377 | -4.1% | 0.5% |
| 45 | Litchfield | 6,834 | $121,156 | 0.3% | -0.6% |
| 46 | Winthrop Harbor | 6,559 | $292,813 | -1.6% | -1.9% |
| 47 | Greenville | 7,235 | $171,260 | 1.1% | 3.4% |
| 48 | Mount Carmel | 6,854 | $106,342 | -0.6% | -3.9% |
| 49 | Mendota | 6,994 | $173,549 | 1.1% | -1.0% |
| 50 | Benton | 6,863 | $104,190 | -3.0% | 1.4% |
| 51 | Clinton | 6,985 | $143,891 | -0.4% | 0.1% |
| 52 | Salem | 7,236 | $141,416 | -1.4% | 1.7% |
| 53 | Orland Hills | 6,719 | $327,783 | -0.6% | 0.5% |
| 54 | University Park | 7,306 | $184,105 | 2.8% | -2.6% |
| 55 | Sandwich | 7,219 | $319,504 | 1.4% | 0.5% |
| 56 | Robinson | 7,084 | $101,121 | 1.1% | 2.0% |
| 57 | Silvis | 7,955 | $153,476 | 0.2% | -2.6% |
| 58 | Princeton | 7,975 | $167,664 | 1.9% | 0.1% |
| 59 | West Frankfort | 7,118 | $87,998 | -0.5% | -1.7% |
| 60 | Park City | 7,827 | $272,660 | 2.6% | -0.2% |
| 61 | Broadview | 7,896 | $265,075 | -0.0% | -0.8% |
| 62 | Lincolnshire | 7,980 | $714,055 | 0.5% | 0.2% |
| 63 | Rockton | 7,974 | $288,099 | -3.2% | 2.1% |
| 64 | Murphysboro | 6,735 | $113,681 | -1.0% | 7.1% |
| 65 | South Beloit | 7,946 | $233,138 | 0.2% | 2.1% |
| 66 | Round Lake Park | 7,919 | $220,880 | 1.1% | 2.1% |
| 67 | Jerseyville | 7,445 | $142,963 | 0.2% | 1.2% |
| 68 | Marengo | 7,040 | $349,011 | -1.2% | -0.3% |
| 69 | Long Grove | 8,305 | $924,480 | 0.5% | 0.6% |
| 70 | West Dundee | 7,906 | $411,112 | 0.5% | 2.4% |
| 71 | Hillside | 8,084 | $278,960 | -0.6% | 1.2% |
| 72 | Gilberts | 8,606 | $409,640 | 2.6% | 3.7% |
| 73 | Inverness | 7,275 | $787,209 | -3.5% | 2.3% |
| 74 | Maryville | 8,316 | $325,041 | 0.4% | -0.2% |
| 75 | Crete | 8,386 | $287,366 | 0.0% | -3.9% |
| 76 | Oak Brook | 8,056 | $966,776 | 0.3% | 5.3% |
| 77 | Island Lake | 8,014 | $295,209 | -0.1% | 1.3% |
| 78 | Manhattan | 11,026 | $385,490 | 6.9% | 0.5% |
| 79 | Chester | 6,797 | $114,646 | -0.5% | 4.2% |
| 80 | Hawthorn Woods | 9,143 | $727,355 | -0.0% | 1.0% |
| 81 | Calumet Park | 6,855 | $159,229 | 0.3% | -0.2% |
| 82 | Harwood Heights | 8,821 | $377,396 | -0.3% | 1.9% |
| 83 | Mascoutah | 8,816 | $264,428 | 0.8% | 2.0% |
| 84 | Manteno | 9,030 | $307,922 | 1.0% | -0.9% |
| 85 | Harrisburg | 8,372 | $87,980 | -2.7% | -0.5% |
| 86 | Lake Villa | 8,683 | $370,653 | -0.3% | 1.6% |
| 87 | Willowbrook | 9,131 | $322,189 | -0.1% | 3.6% |
| 88 | Paris | 8,276 | $99,912 | 1.5% | -0.6% |
| 89 | Riverside | 9,039 | $547,998 | -0.4% | 2.5% |
| 90 | Pingree Grove | 10,914 | $369,701 | 3.2% | 0.5% |
| 91 | Savoy | 8,968 | $345,247 | 1.8% | -0.3% |
| 92 | Clarendon Hills | 8,659 | $666,350 | 0.2% | 4.5% |
| 93 | Glencoe | 8,701 | $1,577,964 | -0.2% | 4.8% |
| 94 | Monmouth | 8,581 | $105,664 | -2.4% | 1.0% |
| 95 | Glenwood | 8,603 | $203,368 | -0.2% | -2.4% |
| 96 | Olney | 8,577 | $132,106 | -3.2% | 4.7% |
| 97 | Mahomet | 10,049 | $339,545 | 3.0% | 1.1% |
| 98 | Rock Falls | 8,587 | $114,963 | -1.1% | -1.1% |
| 99 | Rochelle | 9,529 | $187,169 | 0.5% | -0.2% |
| 100 | Lasalle | 9,498 | $123,171 | 0.3% | -0.6% |