Marengo SnackAbility
Overall SnackAbility
Cost of living in Marengo summary. We use data on the cost of living to determine how expensive it is to live in Marengo. Real estate prices drive most of the variance in cost of living around Illinois. Key points include:
The cost of living in Marengo is 99 with 100 being average.
The cost of living in Marengo is 1.0x lower than the national average.
The median home value in Marengo is $349,011.
The median income in Marengo is $73,523.
Marengo's Overall Cost Of Living
Lower Than The National Average
Cost Of Living In Marengo Comparison Table
| Living Expense | Marengo | Illinois | National Average |
|---|---|---|---|
| Overall | 99 | 98 | 100 |
| Services | 102 | 99 | 100 |
| Groceries | 102 | 99 | 100 |
| Health | 88 | 96 | 100 |
| Housing | 98 | 101 | 100 |
| Transportation | 97 | 99 | 100 |
| Utilities | 98 | 101 | 100 |
Source: Cost of living index, normalized to US average = 100
Marengo, IL Weather
The average high in Marengo is 58.1° and the average low is 38.0°.
There are 69.6 days of precipitation each year.
Expect an average of 35.6 inches of precipitation each year with 31.2 inches of snow.
| Stat | Marengo |
|---|---|
| Average Annual High | 58.1 |
| Average Annual Low | 38.0 |
| Annual Precipitation Days | 69.6 |
| Average Annual Precipitation | 35.6 |
| Average Annual Snowfall | 31.2 |
Average High
Days of Rain
Source: NOAA climate normals (30-year)
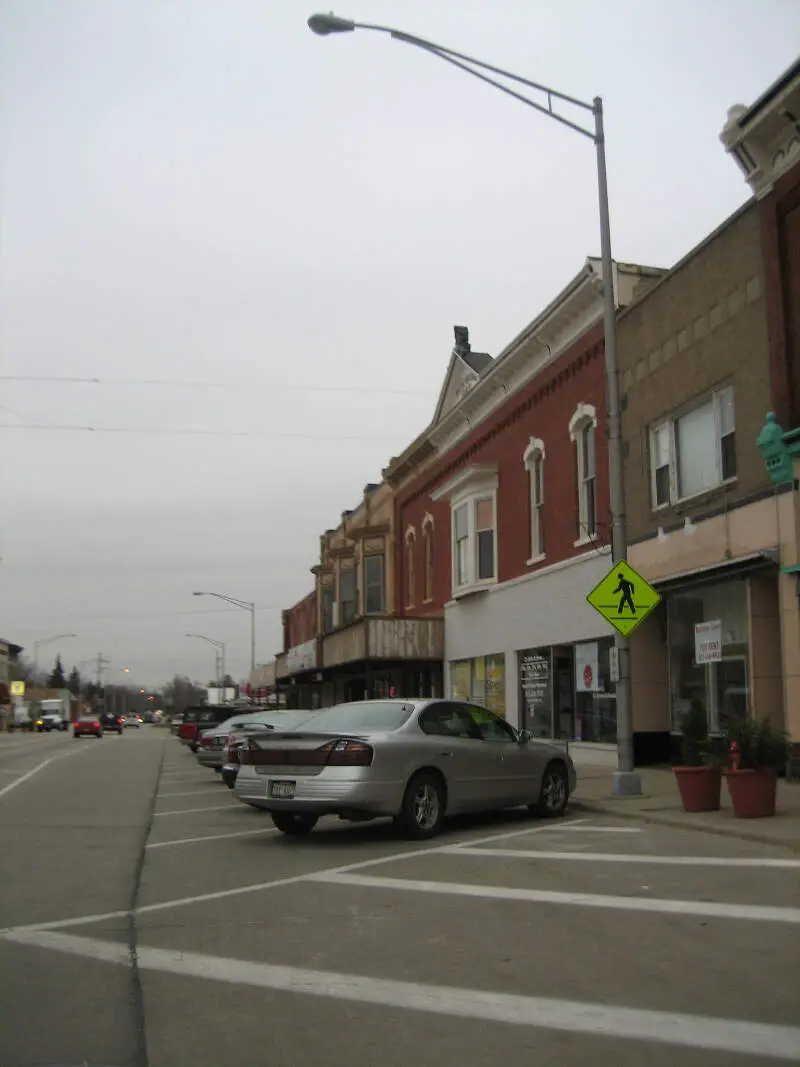
Marengo, IL Photos
Rankings & Articles For Marengo


Locations Around Marengo
Map Of Marengo, IL
Best Places Around Marengo
Cary, IL
Population 17,923
Algonquin, IL
Population 30,067
Lake in the Hills, IL
Population 28,800
Genoa, IL
Population 5,492
Huntley, IL
Population 28,005
Crystal Lake, IL
Population 40,579
Gilberts, IL
Population 8,606
Sycamore, IL
Population 18,559
Hampshire, IL
Population 8,524
West Dundee, IL
Population 7,906
Marengo Demographics And Statistics
Population over time in Marengo
The current population in Marengo is 7,040. The population has decreased 10.7% from 2010.
| Year | Population | % Change |
|---|---|---|
| 2024 | 7,040 | -1.2% |
| 2023 | 7,123 | -4.7% |
| 2022 | 7,471 | 0.1% |
| 2021 | 7,466 | -5.1% |
| 2020 | 7,871 | -1.2% |
| 2019 | 7,969 | -2.5% |
| 2018 | 8,175 | -1.3% |
| 2017 | 8,280 | 2.5% |
| 2016 | 8,081 | 4.8% |
| 2015 | 7,714 | 3.5% |
| 2014 | 7,451 | -0.3% |
| 2013 | 7,475 | -2.6% |
| 2012 | 7,675 | -1.5% |
| 2011 | 7,794 | -1.1% |
| 2010 | 7,881 | - |
Race / Ethnicity in Marengo
See the full breakdown
Marengo is:
85.3% White with 6,007 White residents.
0.4% African American with 29 African American residents.
0.0% American Indian with 0 American Indian residents.
0.1% Asian with 4 Asian residents.
0.0% Hawaiian with 0 Hawaiian residents.
0.0% Other with 0 Other residents.
2.9% Two Or More with 202 Two Or More residents.
11.3% Hispanic with 798 Hispanic residents.
| Race | Marengo | IL | USA |
|---|---|---|---|
| White | 85.3% | 58.1% | 57.4% |
| African American | 0.4% | 13.3% | 11.9% |
| American Indian | 0.0% | 0.1% | 0.5% |
| Asian | 0.1% | 5.9% | 5.9% |
| Hawaiian | 0.0% | 0.0% | 0.2% |
| Other | 0.0% | 0.4% | 0.6% |
| Two Or More | 2.9% | 3.4% | 4.3% |
| Hispanic | 11.3% | 18.8% | 19.3% |
Gender in Marengo
See the full breakdown
Marengo is 48.0% female with 3,381 female residents.
Marengo is 52.0% male with 3,659 male residents.
| Gender | Marengo | IL | USA |
|---|---|---|---|
| Female | 48.0% | 50.6% | 50.5% |
| Male | 52.0% | 49.4% | 49.5% |
Highest level of educational attainment in Marengo for adults over 25
See the full breakdown
2.0% of adults in Marengo completed < 9th grade.
3.0% of adults in Marengo completed 9-12th grade.
42.0% of adults in Marengo completed high school / ged.
28.0% of adults in Marengo completed some college.
10.0% of adults in Marengo completed associate's degree.
13.0% of adults in Marengo completed bachelor's degree.
2.0% of adults in Marengo completed master's degree.
0.0% of adults in Marengo completed professional degree.
0.0% of adults in Marengo completed doctorate degree.
| Education | Marengo | IL | USA |
|---|---|---|---|
| < 9th Grade | 2.0% | 5.0% | 4.0% |
| 9-12th Grade | 3.0% | 5.0% | 6.0% |
| High School / GED | 42.0% | 25.0% | 26.0% |
| Some College | 28.0% | 19.0% | 19.0% |
| Associate's Degree | 10.0% | 8.0% | 9.0% |
| Bachelor's Degree | 13.0% | 23.0% | 22.0% |
| Master's Degree | 2.0% | 11.0% | 10.0% |
| Professional Degree | 0.0% | 2.0% | 2.0% |
| Doctorate Degree | 0.0% | 2.0% | 2.0% |
Household Income For Marengo, Illinois
See the full breakdown
10.3% of households in Marengo earn Less than $10,000.
6.5% of households in Marengo earn $10,000 to $14,999.
8.0% of households in Marengo earn $15,000 to $24,999.
10.5% of households in Marengo earn $25,000 to $34,999.
8.7% of households in Marengo earn $35,000 to $49,999.
7.6% of households in Marengo earn $50,000 to $74,999.
9.0% of households in Marengo earn $75,000 to $99,999.
18.4% of households in Marengo earn $100,000 to $149,999.
10.7% of households in Marengo earn $150,000 to $199,999.
10.3% of households in Marengo earn $200,000 or more.
| Income | Marengo | IL | USA |
|---|---|---|---|
| Less than $10,000 | 10.3% | 5.4% | 5.0% |
| $10,000 to $14,999 | 6.5% | 3.2% | 3.4% |
| $15,000 to $24,999 | 8.0% | 5.9% | 6.3% |
| $25,000 to $34,999 | 10.5% | 6.3% | 6.6% |
| $35,000 to $49,999 | 8.7% | 9.7% | 10.1% |
| $50,000 to $74,999 | 7.6% | 14.8% | 15.5% |
| $75,000 to $99,999 | 9.0% | 12.6% | 12.6% |
| $100,000 to $149,999 | 18.4% | 18.0% | 17.5% |
| $150,000 to $199,999 | 10.7% | 10.1% | 9.6% |
| $200,000 or more | 10.3% | 13.8% | 13.4% |
Source: U.S. Census ACS 5-year estimates (2024)


