Spring Valley SnackAbility
Overall SnackAbility
Crime in Spring Valley summary. We use data from the FBI to determine the crime rates in Spring Valley. Key points include:
There were 33 total crimes in Spring Valley in the last reporting year.
The overall crime rate per 100,000 people in Spring Valley is 610.8 / 100k people.
The violent crime rate per 100,000 people in Spring Valley is 18.5 / 100k people.
The property crime rate per 100,000 people in Spring Valley is 592.3 / 100k people.
Overall, crime in Spring Valley is -71.18% below the national average.
Total Crimes
Below National Average
Crime In Spring Valley Comparison Table
| Statistic | Count Raw |
Spring Valley / 100k People |
Illinois / 100k People |
National / 100k People |
|---|---|---|---|---|
| Total Crimes Per 100K | 33 | 610.8 | 2,004.4 | 2,119.2 |
| Violent Crime | 1 | 18.5 | 289.2 | 359.0 |
| Murder | 0 | 0.0 | 5.8 | 5.0 |
| Robbery | 0 | 0.0 | 90.2 | 61.0 |
| Aggravated Assault | 0 | 0.0 | 146.3 | 256.0 |
| Property Crime | 32 | 592.3 | 1,715.2 | 1,760.0 |
| Burglary | 3 | 55.5 | 290.5 | 229.0 |
| Larceny | 22 | 407.2 | 1,134.4 | 1,272.0 |
| Car Theft | 7 | 129.6 | 290.4 | 259.0 |
Source: FBI Uniform Crime Reporting (2024)
Cost of living in Spring Valley summary. We use data on the cost of living to determine how expensive it is to live in Spring Valley. Real estate prices drive most of the variance in cost of living around Illinois. Key points include:
The cost of living in Spring Valley is 88 with 100 being average.
The cost of living in Spring Valley is 0.9x lower than the national average.
The median home value in Spring Valley is $138,946.
The median income in Spring Valley is $70,598.
Spring Valley's Overall Cost Of Living
Lower Than The National Average
Cost Of Living In Spring Valley Comparison Table
| Living Expense | Spring Valley | Illinois | National Average |
|---|---|---|---|
| Overall | 88 | 98 | 100 |
| Services | 100 | 99 | 100 |
| Groceries | 100 | 99 | 100 |
| Health | 58 | 96 | 100 |
| Housing | 102 | 101 | 100 |
| Transportation | 101 | 99 | 100 |
| Utilities | 102 | 101 | 100 |
Source: Cost of living index, normalized to US average = 100
Spring Valley, IL Weather
The average high in Spring Valley is 60.0° and the average low is 39.6°.
There are 67.9 days of precipitation each year.
Expect an average of 36.2 inches of precipitation each year with 24.4 inches of snow.
| Stat | Spring Valley |
|---|---|
| Average Annual High | 60.0 |
| Average Annual Low | 39.6 |
| Annual Precipitation Days | 67.9 |
| Average Annual Precipitation | 36.2 |
| Average Annual Snowfall | 24.4 |
Average High
Days of Rain
Source: NOAA climate normals (30-year)
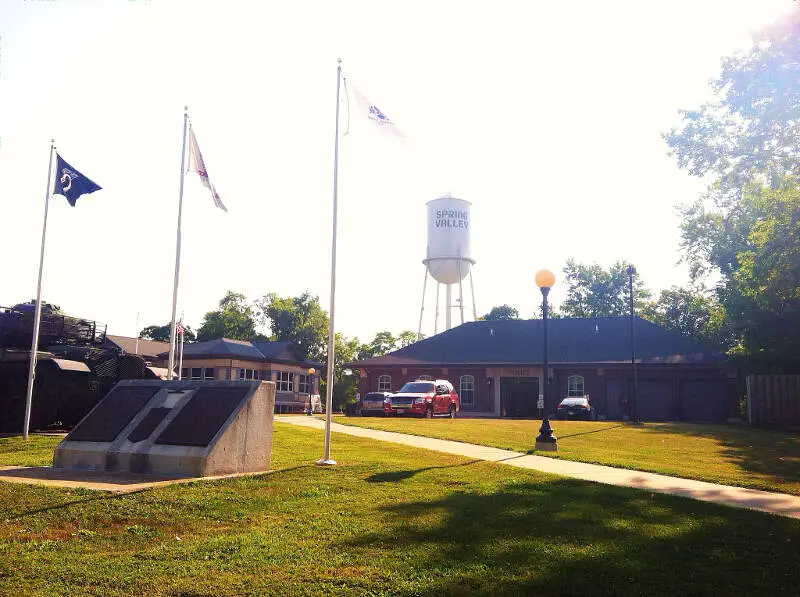
Spring Valley, IL Photos

Rankings & Articles For Spring Valley


Locations Around Spring Valley
Map Of Spring Valley, IL
Best Places Around Spring Valley
Windsor, CA
Population 26,081
Winters, CA
Population 7,583
Ukiah, CA
Population 16,304
Larkfield-Wikiup, CA
Population 8,765
Cloverdale, CA
Population 8,886
Sebastopol, CA
Population 7,445
Santa Rosa, CA
Population 177,090
Williams, CA
Population 5,585
Healdsburg, CA
Population 11,243
Spring Valley Demographics And Statistics
Population over time in Spring Valley
The current population in Spring Valley is 5,476. The population has decreased 1.2% from 2010.
| Year | Population | % Change |
|---|---|---|
| 2024 | 5,476 | -0.6% |
| 2023 | 5,508 | -0.2% |
| 2022 | 5,518 | -0.6% |
| 2021 | 5,551 | 7.3% |
| 2020 | 5,172 | -1.0% |
| 2019 | 5,223 | -1.1% |
| 2018 | 5,282 | -0.9% |
| 2017 | 5,331 | -0.6% |
| 2016 | 5,365 | -0.7% |
| 2015 | 5,405 | -0.7% |
| 2014 | 5,441 | -0.8% |
| 2013 | 5,486 | -0.8% |
| 2012 | 5,530 | -0.2% |
| 2011 | 5,540 | 0.0% |
| 2010 | 5,540 | - |
Race / Ethnicity in Spring Valley
See the full breakdown
Spring Valley is:
76.7% White with 4,198 White residents.
0.7% African American with 40 African American residents.
0.1% American Indian with 7 American Indian residents.
0.5% Asian with 30 Asian residents.
0.0% Hawaiian with 0 Hawaiian residents.
0.5% Other with 30 Other residents.
2.8% Two Or More with 152 Two Or More residents.
18.6% Hispanic with 1,019 Hispanic residents.
| Race | Spring Valley | IL | USA |
|---|---|---|---|
| White | 76.7% | 58.1% | 57.4% |
| African American | 0.7% | 13.3% | 11.9% |
| American Indian | 0.1% | 0.1% | 0.5% |
| Asian | 0.5% | 5.9% | 5.9% |
| Hawaiian | 0.0% | 0.0% | 0.2% |
| Other | 0.5% | 0.4% | 0.6% |
| Two Or More | 2.8% | 3.4% | 4.3% |
| Hispanic | 18.6% | 18.8% | 19.3% |
Gender in Spring Valley
See the full breakdown
Spring Valley is 53.1% female with 2,907 female residents.
Spring Valley is 46.9% male with 2,569 male residents.
| Gender | Spring Valley | IL | USA |
|---|---|---|---|
| Female | 53.1% | 50.6% | 50.5% |
| Male | 46.9% | 49.4% | 49.5% |
Highest level of educational attainment in Spring Valley for adults over 25
See the full breakdown
4.0% of adults in Spring Valley completed < 9th grade.
7.0% of adults in Spring Valley completed 9-12th grade.
40.0% of adults in Spring Valley completed high school / ged.
21.0% of adults in Spring Valley completed some college.
11.0% of adults in Spring Valley completed associate's degree.
12.0% of adults in Spring Valley completed bachelor's degree.
4.0% of adults in Spring Valley completed master's degree.
1.0% of adults in Spring Valley completed professional degree.
0.0% of adults in Spring Valley completed doctorate degree.
| Education | Spring Valley | IL | USA |
|---|---|---|---|
| < 9th Grade | 4.0% | 5.0% | 4.0% |
| 9-12th Grade | 7.0% | 5.0% | 6.0% |
| High School / GED | 40.0% | 25.0% | 26.0% |
| Some College | 21.0% | 19.0% | 19.0% |
| Associate's Degree | 11.0% | 8.0% | 9.0% |
| Bachelor's Degree | 12.0% | 23.0% | 22.0% |
| Master's Degree | 4.0% | 11.0% | 10.0% |
| Professional Degree | 1.0% | 2.0% | 2.0% |
| Doctorate Degree | 0.0% | 2.0% | 2.0% |
Household Income For Spring Valley, Illinois
See the full breakdown
3.4% of households in Spring Valley earn Less than $10,000.
3.4% of households in Spring Valley earn $10,000 to $14,999.
5.7% of households in Spring Valley earn $15,000 to $24,999.
12.4% of households in Spring Valley earn $25,000 to $34,999.
10.7% of households in Spring Valley earn $35,000 to $49,999.
18.8% of households in Spring Valley earn $50,000 to $74,999.
9.6% of households in Spring Valley earn $75,000 to $99,999.
25.5% of households in Spring Valley earn $100,000 to $149,999.
5.4% of households in Spring Valley earn $150,000 to $199,999.
5.1% of households in Spring Valley earn $200,000 or more.
| Income | Spring Valley | IL | USA |
|---|---|---|---|
| Less than $10,000 | 3.4% | 5.4% | 5.0% |
| $10,000 to $14,999 | 3.4% | 3.2% | 3.4% |
| $15,000 to $24,999 | 5.7% | 5.9% | 6.3% |
| $25,000 to $34,999 | 12.4% | 6.3% | 6.6% |
| $35,000 to $49,999 | 10.7% | 9.7% | 10.1% |
| $50,000 to $74,999 | 18.8% | 14.8% | 15.5% |
| $75,000 to $99,999 | 9.6% | 12.6% | 12.6% |
| $100,000 to $149,999 | 25.5% | 18.0% | 17.5% |
| $150,000 to $199,999 | 5.4% | 10.1% | 9.6% |
| $200,000 or more | 5.1% | 13.8% | 13.4% |
Source: U.S. Census ACS 5-year estimates (2024)


