Editor’s Note: This is not investment advice, and we are not financial advisers.
Suppose real estate is the most significant investment a majority of people make in their lifetime. In that case, it’s best to understand the places in Massachusetts with best potential return on investment.
After working in real estate adjacent roles for over a decade, I had the hypothesis that the best place to buy for a return on investment would be up-and-coming cities. Smaller cities where crime might be high now, but people still move to.
To test my hypothesis, we are going to look at places in Massachusetts that are growing faster than average, but where home prices are below average, and crime rates are higher than average.
In everyday terms, these might be “deals”. The best deal in Massachusetts at the moment according to Saturday Night Science? That would be Palmer Town.
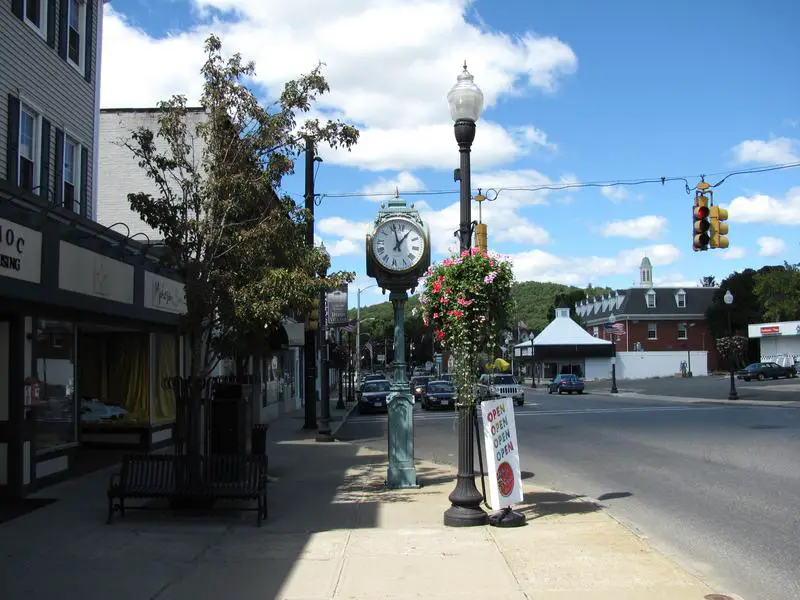
0.1% population growth · 0.7% home price growth
Palmer is a city in Hampden County, Massachusetts, United States. The population was 12,140 at the 2010 census. It is part of the Springfield, Massachusetts Metropolitan Statistical Area. Palmer adopted a home rule charter in 2004 with a council-manager form of government. Palmer is one of fourteen Massachusetts municipalities that have applied for, and been granted, city forms of government but wish to retain “The town of- in their official names.
Data | Crime | Cost of living | Movers
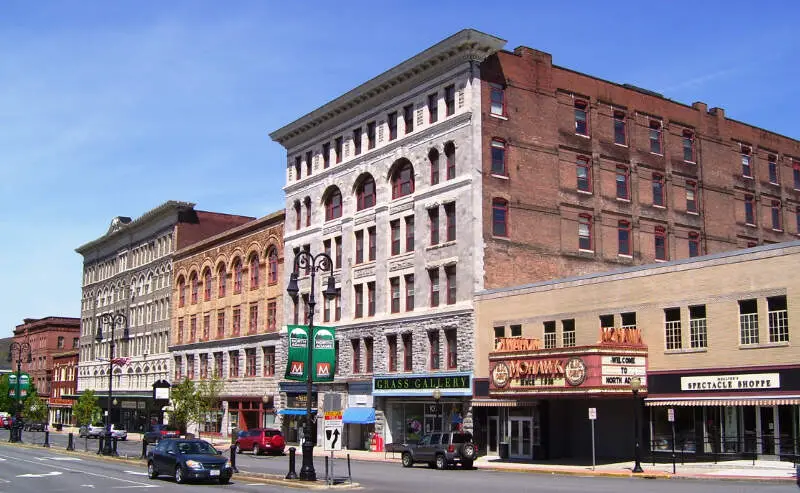
-0.4% population growth · 0.2% home price growth
 Located in
Berkshire County, Massachusetts
Located in
Berkshire County, Massachusetts
North Adams is a city in Berkshire County, Massachusetts, United States. It is part of the Pittsfield, Massachusetts Metropolitan Statistical Area. Its population was 13,708 as of the 2010 census, making it the least populous city in the state. Best known as the home of the largest contemporary art museum in the United States, the Massachusetts Museum of Contemporary Art, North Adams has in recent years become a center for tourism, culture and recreation.
Data | Crime | Cost of living | Movers
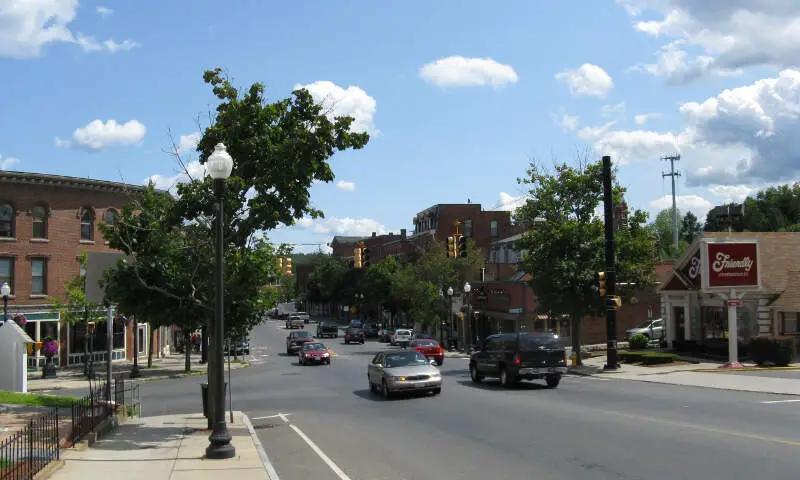
0.7% population growth · 4.5% home price growth
The Town of Southbridge has a city form of government with a city council legislative body, but via a statute calls itself a Town. It is located in Worcester County, Massachusetts, United States. The population was 16,719 at the 2010 census. Southbridge is one of fourteen Massachusetts municipalities that have applied for, and been granted, city forms of government but wish to retain “The town of- in their official names.
Data | Crime | Cost of living | Movers
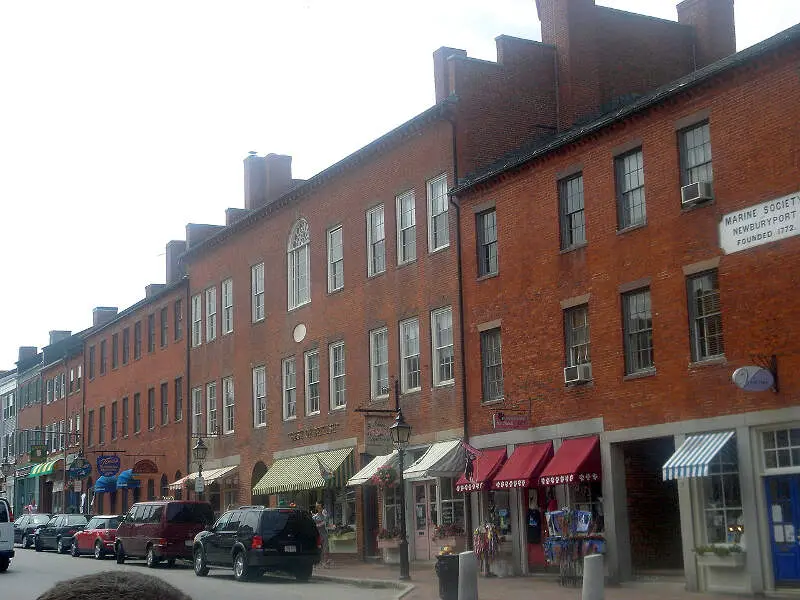
1.1% population growth · 0.8% home price growth
 Located in
Essex County, Massachusetts
Located in
Essex County, Massachusetts
Newburyport is a small coastal, scenic, and historic city in Essex County, Massachusetts, United States, 35 miles northeast of Boston. The population was 17,416 at the 2010 census. A historic seaport with a vibrant tourism industry, Newburyport includes part of Plum Island. The mooring, winter storage and maintenance of recreational boats, motor and sail, still contribute a large part of the city’s income. A Coast Guard station oversees boating activity, especially in the swift tidal currents of the Merrimack River.
Data | Crime | Cost of living | Movers
-0.3% population growth · 1.3% home price growth
Winthrop is a city in Suffolk County, Massachusetts, United States. The population was 17,497 at the 2010 census. Winthrop is an ocean-side suburban community in Greater Boston situated at the north entrance to Boston Harbor, close to Logan International Airport. It is located on a peninsula, 1.6 square miles in area, connected to Revere by a narrow isthmus and to East Boston by a bridge over the harbor inlet to the Belle Isle Marsh Reservation. Settled in 1630, Winthrop is one of the oldest communities in the United States. It is also one of the smallest and most densely populated municipalities in Massachusetts. It is one of the four cities in Suffolk County. It is the southernmost part of the North Shore, with a 7-mile shoreline that provides views of the Atlantic Ocean to the east and of the Boston skyline to the west.
Data | Crime | Cost of living | Movers
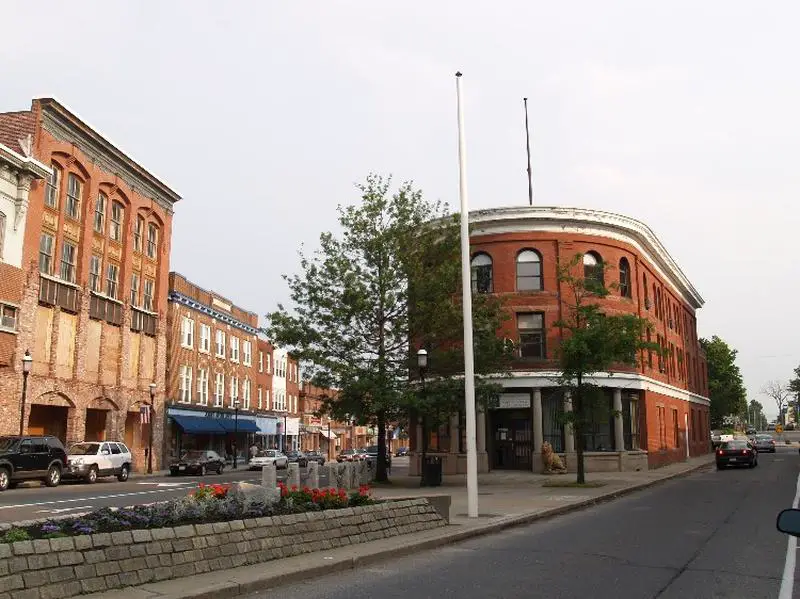
0.3% population growth · 0.7% home price growth
 Located in
Worcester County, Massachusetts
Located in
Worcester County, Massachusetts
Gardner is a city in Worcester County, Massachusetts, United States. The population was 20,228 at the 2010 census. Gardner is home to Dunn State Park, Gardner Heritage State Park, Lake Wampanoag Wildlife Sanctuary, and Mount Wachusett Community College.
Data | Crime | Cost of living | Movers
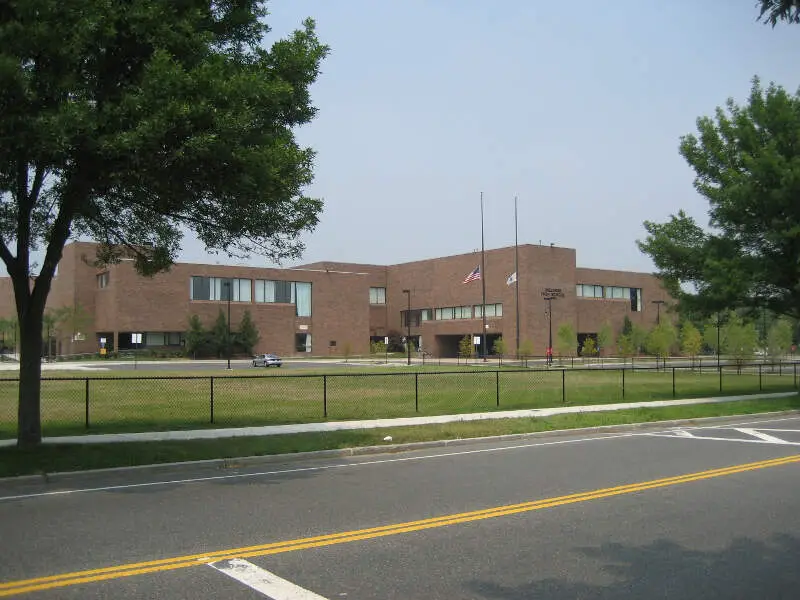
0.5% population growth · 2.9% home price growth
 Located in
Middlesex County, Massachusetts
Located in
Middlesex County, Massachusetts
Melrose is a city located in the Greater Boston metropolitan area in Middlesex County, Massachusetts. Its population as per the 2010 United States Census is 26,983. It is a suburb located approximately seven miles north of Boston and is situated in the center of the triangle created by Interstates 93, 95 and US Route 1.
Data | Crime | Cost of living | Movers
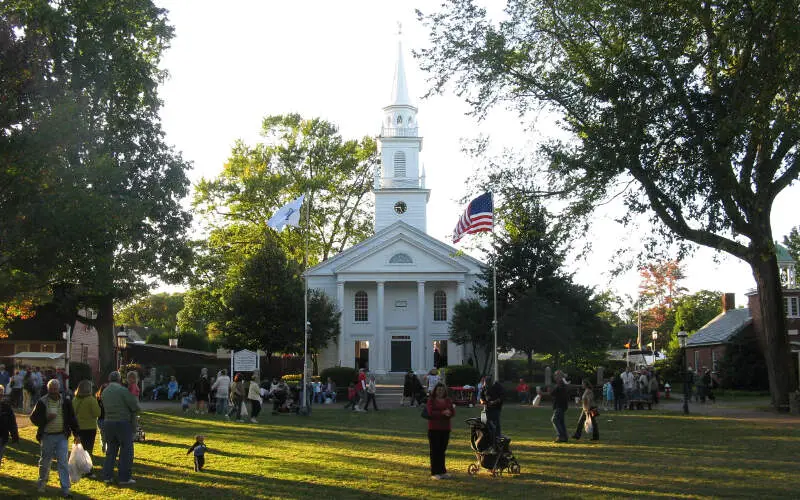
0.5% population growth · -1.2% home price growth
West Springfield is a city in Hampden County, Massachusetts, United States. It is part of the Springfield, Massachusetts Metropolitan Statistical Area. The population was 28,391 at the 2010 census. The city is also known as “West Side”, in reference to the fact that it is on the western side of the Connecticut River from Springfield, a fact which played a major part in the town’s early history.
Data | Crime | Cost of living | Movers
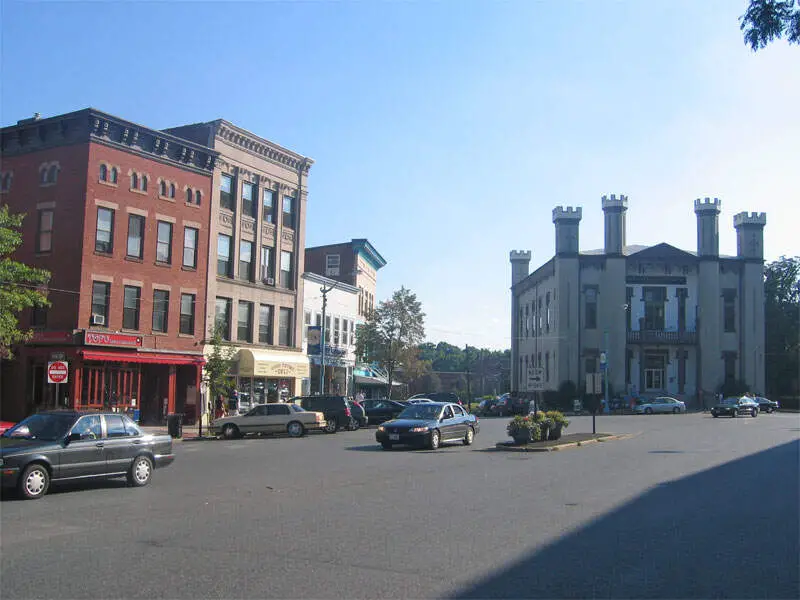
8.1% population growth · 2.3% home price growth
 Located in
Hampshire County, Massachusetts
Located in
Hampshire County, Massachusetts
The city of Northampton ) is the county seat of Hampshire County, Massachusetts, United States. As of the 2010 census, the population of Northampton was 28,549.
Data | Crime | Cost of living | Movers
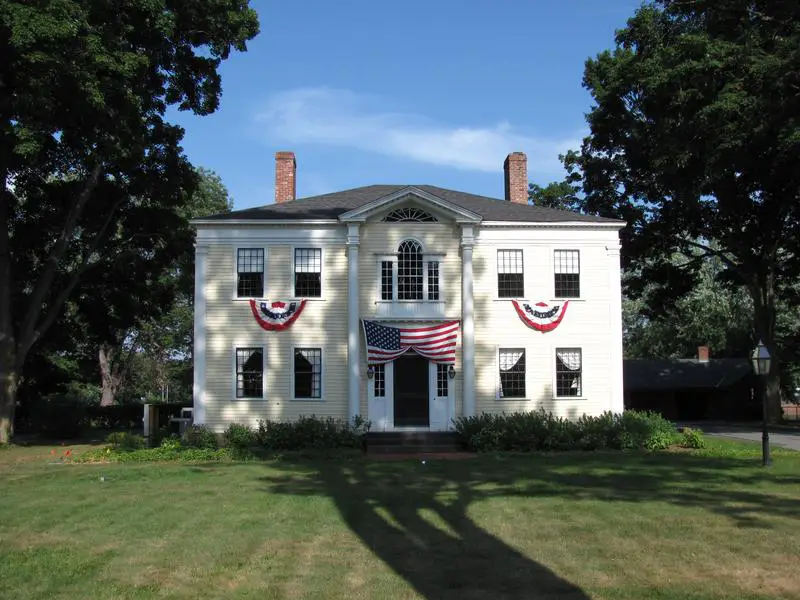
0.1% population growth · 1.7% home price growth
Data | Crime | Cost of living | Movers
The receipts
Compare the top ten
Pick a metric. The bars rescale. The red line is Massachusetts’s statewide median.
Massachusetts statewide median: $656,690
On the map
Where Massachusetts’s best buys are
Saturday Night Science
Methodology: How do you determine the best places to buy a home in Massachusetts for 2026?
We were in real estate for almost five years and have worked on this site for over a decade. Suffice it to say we’ve put a lot of thought into finding an excellent place to buy a home.
So all that thinking has come to this moment where we get to spell out how we’d approach finding an up-and-coming place to live in Massachusetts. Put differently, the analysis will try to find places in Massachusetts with undervalued homes relative to pent-up demand using Saturday Night Science.
To do that, we looked at the most recent American Community Survey Census data for 2020-2024 and compared it to the previous vintage. Specifically, we used the following criteria:
- Y-o-Y Change In Population (People want to live here)
- Y-o-Y Change In Median Home Prices (People are willing to pay for it)
- Home Prices Relative To The State Average (It’s still kinda cheap)
We want places that are growing, have seen home prices increase in recent years, and are still “cheap” for Massachusetts, with these caveats: home prices had to be within 20% of the state average, home prices increased in the last year, and the city had above 12,000 people.
So of the 245 cities and towns in Massachusetts, only 48 places made it through our initial filters to even be considered.
We then ranked each place from 1 to 48 for the above criteria, with 1 being the best. We averaged the rankings to create a “best place to buy” index, with the place having the lowest index being the best.
Turns out that Palmer Town is the best potential gem in the not-so-rough in the Bay State. The median Massachusetts home is 61 years old — old enough that it pays to compare home warranty plans before something expensive breaks.
The full plate
Best Places To Buy A Home In Massachusetts
Click any column to sort. Search by city name.
| Rank | City | Population | Median Home Price | Population Change | Home Price Increase |
|---|---|---|---|---|---|
| 1 | Palmer Town | 12,381 | $317,071 | 0.1% | 0.7% |
| 2 | North Adams | 12,606 | $252,589 | -0.4% | 0.2% |
| 3 | Southbridge Town | 17,928 | $344,409 | 0.7% | 4.5% |
| 4 | Newburyport | 18,652 | $923,543 | 1.1% | 0.8% |
| 5 | Winthrop Town | 18,759 | $758,915 | -0.3% | 1.3% |
| 6 | Gardner | 21,148 | $369,177 | 0.3% | 0.7% |
| 7 | Melrose | 29,650 | $908,131 | 0.5% | 2.9% |
| 8 | West Springfield Town | 28,772 | $375,602 | 0.5% | -1.2% |
| 9 | Northampton | 30,962 | $486,075 | 8.1% | 2.3% |
| 10 | Agawam Town | 28,539 | $364,036 | 0.1% | 1.7% |
| 11 | Gloucester | 30,075 | $760,558 | 0.7% | 0.2% |
| 12 | Franklin Town | 33,154 | $714,637 | 0.3% | 2.1% |
| 13 | Braintree Town | 38,899 | $767,327 | 0.4% | -0.3% |
| 14 | Marlborough | 41,647 | $578,934 | 0.6% | 1.2% |
| 15 | Chelsea | 39,908 | $526,190 | 1.1% | 0.1% |
| 16 | Holyoke | 37,813 | $322,895 | -0.4% | 1.9% |
| 17 | Woburn | 41,939 | $758,603 | 1.8% | 2.2% |
| 18 | Fitchburg | 41,798 | $396,820 | 0.4% | 0.5% |
| 19 | Westfield | 40,378 | $378,738 | -0.7% | 1.0% |
| 20 | Leominster | 43,909 | $463,494 | 0.5% | 0.9% |
| 21 | Beverly | 42,665 | $755,767 | 0.6% | 2.4% |
| 22 | Pittsfield | 43,457 | $302,831 | -0.2% | -1.0% |
| 23 | Salem | 44,795 | $606,559 | 1.3% | -0.1% |
| 24 | Barnstable Town | 49,568 | $703,889 | 0.7% | 2.0% |
| 25 | Attleboro | 46,762 | $532,570 | 0.6% | 0.7% |
| 26 | Everett | 50,045 | $639,070 | 1.6% | 2.0% |
| 27 | Peabody | 54,695 | $694,094 | 1.0% | 0.9% |
| 28 | Revere | 60,012 | $612,971 | 0.1% | 0.6% |
| 29 | Chicopee | 55,295 | $311,123 | 0.1% | 0.4% |
| 30 | Weymouth Town | 58,505 | $645,008 | 1.2% | 1.2% |
| 31 | Taunton | 60,433 | $513,322 | 1.2% | 2.1% |
| 32 | Medford | 59,354 | $842,298 | 0.5% | 1.4% |
| 33 | Malden | 65,906 | $684,055 | 0.6% | 2.7% |
| 34 | Waltham | 64,902 | $826,437 | 0.3% | 1.4% |
| 35 | Haverhill | 67,698 | $543,992 | 0.5% | 1.6% |
| 36 | Lawrence | 88,736 | $504,150 | 0.5% | 0.8% |
| 37 | Somerville | 81,036 | $940,239 | 0.6% | 0.5% |
| 38 | Newton | 89,044 | $1,528,894 | 0.6% | 1.9% |
| 39 | Fall River | 94,082 | $445,781 | 0.3% | 1.7% |
| 40 | Lynn | 101,709 | $580,316 | 0.8% | 0.8% |
| 41 | Quincy | 102,114 | $675,959 | 0.7% | 1.0% |
| 42 | New Bedford | 100,998 | $434,262 | 0.3% | 1.5% |
| 43 | Brockton | 105,386 | $503,833 | 0.3% | 1.2% |
| 44 | Lowell | 118,368 | $480,319 | 3.1% | 0.7% |
| 45 | Cambridge | 118,796 | $1,041,569 | 0.9% | 0.2% |
| 46 | Springfield | 154,749 | $294,613 | -0.0% | 0.5% |
| 47 | Worcester | 207,055 | $430,112 | 0.8% | 0.1% |
| 48 | Boston | 666,442 | $798,217 | 0.4% | 1.7% |
Source: U.S. Census ACS 2020-2024 via Saturday Night Science. 48 Massachusetts cities cleared the filters.
Summary
Summary: The Best Places To Purchase A House In Massachusetts for 2026
There’s our analysis of the best places to buy a house in Massachusetts. And, to be clear, we aren’t necessarily saying these places are the best places to live, just that it looks like they might be in a couple of years based on the data.
In fact, every place in the following table meets our criteria, so even though it may not look super long, remember we started off with all 245 places in the state.
The best cities to buy a house in Massachusetts are Palmer Town, North Adams, Southbridge Town, Newburyport, Winthrop Town, Gardner, Melrose, West Springfield Town, Northampton, and Agawam Town.
So if we could rent or buy in these cities, we’d definitely buy. Not sold on Massachusetts? Take the two-minute Find Your Place quiz and see which state actually fits you.
Questions and answers
Best Places To Buy A House In Massachusetts FAQs
What is the best city in Massachusetts to buy a house?
Palmer Town is the best place to buy a house in Massachusetts for 2026. Its population is growing, home values are rising, and the median home still costs $317,071. North Adams and Southbridge Town are next on the list.
What are the best cities to buy a home in Massachusetts?
The best cities to buy a house in Massachusetts are Palmer Town, North Adams, Southbridge Town, Newburyport, Winthrop Town, Gardner, Melrose, West Springfield Town, Northampton, and Agawam Town. Only 48 of the 245 places in Massachusetts cleared our filters on growth and home prices.
How much does a house cost in Palmer Town?
The median home value in Palmer Town is $317,071, versus $656,690 across Massachusetts. Across the full top ten, the median home runs $372,390.
How do you pick the best places to buy a home in Massachusetts?
We look for Massachusetts places where the population is growing, home prices are climbing, and homes are still cheap relative to the state average, using Census American Community Survey data. Cities that hit all three get the highest Buy Index scores.
Is this a guarantee home values will go up?
No. This is not investment advice — just where the data points to potential value. The Buy Index says these markets look healthier than most of Massachusetts, not that any single house is a good deal.