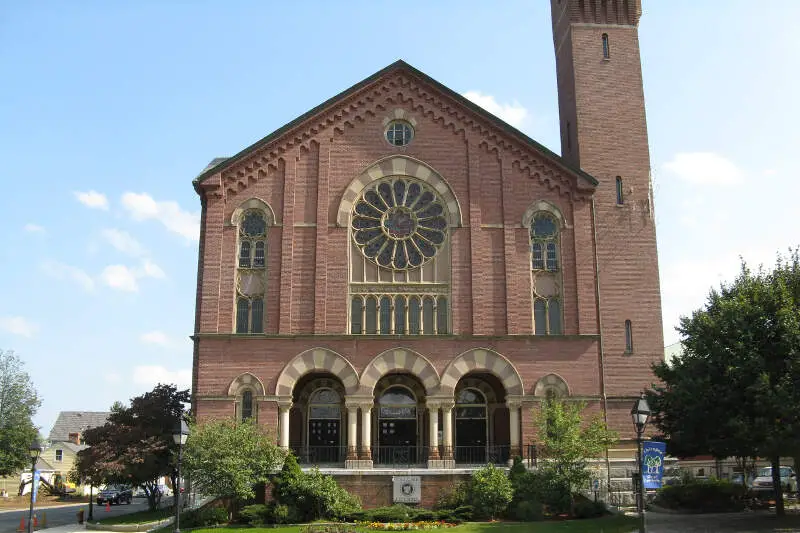
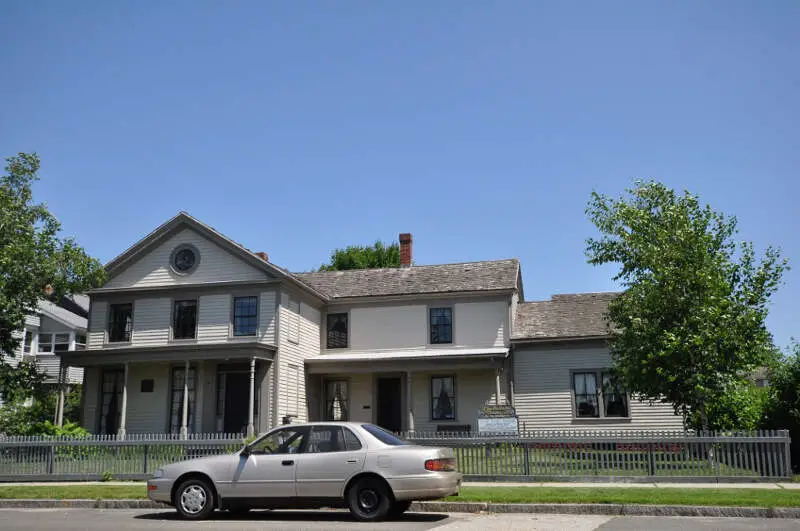
Chicopee, MA
Demographics And Statistics
Living In Chicopee, Massachusetts Summary
Life in Chicopee research summary. HomeSnacks has been using Saturday Night Science to research the quality of life in Chicopee over the past nine years using Census, FBI, Zillow, and other primary data sources. Based on the most recently available data, we found the following about life in Chicopee:
The population in Chicopee is 55,441.
The median home value in Chicopee is $281,474.
The median income in Chicopee is $63,866.
The cost of living in Chicopee is 107 which is 1.1x higher than the national average.
The median rent in Chicopee is $1,058.
The unemployment rate in Chicopee is 6.1%.
The poverty rate in Chicopee is 15.5%.
The average high in Chicopee is 60.0° and the average low is 39.0°.
Chicopee SnackAbility
Overall SnackAbility
Chicopee, MA Crime Report
Crime in Chicopee summary. We use data from the FBI to determine the crime rates in Chicopee. Key points include:
There were 1,333 total crimes in Chicopee in the last reporting year.
The overall crime rate per 100,000 people in Chicopee is 2,412.0 / 100k people.
The violent crime rate per 100,000 people in Chicopee is 544.6 / 100k people.
The property crime rate per 100,000 people in Chicopee is 1,867.4 / 100k people.
Overall, crime in Chicopee is 3.78% above the national average.
Total Crimes
Above National Average
Crime In Chicopee Comparison Table
| Statistic | Count Raw |
Chicopee / 100k People |
Massachusetts / 100k People |
National / 100k People |
|---|---|---|---|---|
| Total Crimes Per 100K | 1,333 | 2,412.0 | 1,362.0 | 2,324.2 |
| Violent Crime | 301 | 544.6 | 308.8 | 369.8 |
| Murder | 4 | 7.2 | 2.3 | 6.3 |
| Robbery | 31 | 56.1 | 43.7 | 66.1 |
| Aggravated Assault | 229 | 414.4 | 235.9 | 268.2 |
| Property Crime | 1,032 | 1,867.4 | 1,053.2 | 1,954.4 |
| Burglary | 133 | 240.7 | 149.7 | 269.8 |
| Larceny | 804 | 1,454.8 | 804.3 | 1,401.9 |
| Car Theft | 95 | 171.9 | 99.2 | 282.7 |
Chicopee, MA Cost Of Living
Cost of living in Chicopee summary. We use data on the cost of living to determine how expensive it is to live in Chicopee. Real estate prices drive most of the variance in cost of living around Massachusetts. Key points include:
The cost of living in Chicopee is 107 with 100 being average.
The cost of living in Chicopee is 1.1x higher than the national average.
The median home value in Chicopee is $281,474.
The median income in Chicopee is $63,866.
Chicopee's Overall Cost Of Living
Higher Than The National Average
Cost Of Living In Chicopee Comparison Table
| Living Expense | Chicopee | Massachusetts | National Average | |
|---|---|---|---|---|
| Overall | 107 | 143 | 100 | |
| Services | 113 | 126 | 100 | |
| Groceries | 103 | 108 | 100 | |
| Health | 94 | 117 | 100 | |
| Housing | 91 | 202 | 100 | |
| Transportation | 103 | 114 | 100 | |
| Utilities | 124 | 123 | 100 | |
Chicopee, MA Weather
The average high in Chicopee is 60.0° and the average low is 39.0°.
There are 70.8 days of precipitation each year.
Expect an average of 45.1 inches of precipitation each year with 41.3 inches of snow.
| Stat | Chicopee |
|---|---|
| Average Annual High | 60.0 |
| Average Annual Low | 39.0 |
| Annual Precipitation Days | 70.8 |
| Average Annual Precipitation | 45.1 |
| Average Annual Snowfall | 41.3 |
Average High
Days of Rain
Chicopee, MA Photos


2 Reviews & Comments About Chicopee
/5

HomeSnacks User - 2018-08-28 01:06:49.088507
This was an extremely unwelcoming town that was difficult to navigate and had a disgusting hotel.
The hotel we stayed at was filthy, and when we called to ask for more pillows, they said they didn't have any.


HomeSnacks User - 2019-05-10 12:48:17.398092
I don't understand how Chicopee could be 10th most dangerous city in Ma. I moved into Chicopee 4 years ago and have never had an issue with anyone or my property. Its rare to see cops or any emergency in action. Very quiet neighborhoods. People are polite and courteous. The schools have helped my kids grades go up dramatically since we moved here. As for things to do, not much, since its a little town with just stores for shopping. Overall I love this place.
Chicopee Annual fair, not sure what's it called but it's a little fair with food and such. Celebrating Chicopee. There are also events for the holidays such as the Christmas Tree lighting. Plenty of parks and the Chicopee recreational office offers classes for adults and children such as swimming lessons, art classes, cpr training and more.
Rankings for Chicopee in Massachusetts
Locations Around Chicopee
Map Of Chicopee, MA
Best Places Around Chicopee
Sherwood Manor, CT
Population 5,731
Southwood Acres, CT
Population 7,928
Windsor Locks, CT
Population 12,563
Hazardville, CT
Population 6,123
Longmeadow, MA
Population 15,789
West Springfield, VA
Population 23,372
Chicopee Demographics And Statistics
Population over time in Chicopee
The current population in Chicopee is 55,441. The population has increased 0.5% from 2010.
| Year | Population | % Change |
|---|---|---|
| 2022 | 55,441 | -0.4% |
| 2021 | 55,661 | -0.2% |
| 2020 | 55,778 | -0.6% |
| 2019 | 56,100 | -0.2% |
| 2018 | 56,186 | 1.0% |
| 2017 | 55,603 | 0.2% |
| 2016 | 55,478 | 0.3% |
| 2015 | 55,326 | 0.2% |
| 2014 | 55,205 | 0.1% |
| 2013 | 55,165 | - |
Race / Ethnicity in Chicopee
Chicopee is:
67.7% White with 37,529 White residents.
4.3% African American with 2,386 African American residents.
0.0% American Indian with 2 American Indian residents.
2.2% Asian with 1,197 Asian residents.
0.0% Hawaiian with 0 Hawaiian residents.
0.0% Other with 9 Other residents.
1.8% Two Or More with 1,002 Two Or More residents.
24.0% Hispanic with 13,316 Hispanic residents.
| Race | Chicopee | MA | USA |
|---|---|---|---|
| White | 67.7% | 68.9% | 58.9% |
| African American | 4.3% | 6.6% | 12.1% |
| American Indian | 0.0% | 0.1% | 0.6% |
| Asian | 2.2% | 6.9% | 5.7% |
| Hawaiian | 0.0% | 0.0% | 0.2% |
| Other | 0.0% | 1.0% | 0.4% |
| Two Or More | 1.8% | 3.9% | 3.5% |
| Hispanic | 24.0% | 12.6% | 18.7% |
Gender in Chicopee
Chicopee is 51.3% female with 28,464 female residents.
Chicopee is 48.7% male with 26,977 male residents.
| Gender | Chicopee | MA | USA |
|---|---|---|---|
| Female | 51.3% | 51.0% | 50.4% |
| Male | 48.7% | 49.0% | 49.6% |
Highest level of educational attainment in Chicopee for adults over 25
3.0% of adults in Chicopee completed < 9th grade.
9.0% of adults in Chicopee completed 9-12th grade.
35.0% of adults in Chicopee completed high school / ged.
19.0% of adults in Chicopee completed some college.
10.0% of adults in Chicopee completed associate's degree.
15.0% of adults in Chicopee completed bachelor's degree.
7.0% of adults in Chicopee completed master's degree.
1.0% of adults in Chicopee completed professional degree.
1.0% of adults in Chicopee completed doctorate degree.
| Education | Chicopee | MA | USA |
|---|---|---|---|
| < 9th Grade | 3.0% | 3.0% | 4.0% |
| 9-12th Grade | 9.0% | 5.0% | 6.0% |
| High School / GED | 35.0% | 23.0% | 26.0% |
| Some College | 19.0% | 15.0% | 20.0% |
| Associate's Degree | 10.0% | 8.0% | 9.0% |
| Bachelor's Degree | 15.0% | 25.0% | 21.0% |
| Master's Degree | 7.0% | 15.0% | 10.0% |
| Professional Degree | 1.0% | 3.0% | 2.0% |
| Doctorate Degree | 1.0% | 3.0% | 2.0% |
Household Income For Chicopee, Massachusetts
6.0% of households in Chicopee earn Less than $10,000.
5.1% of households in Chicopee earn $10,000 to $14,999.
8.5% of households in Chicopee earn $15,000 to $24,999.
9.6% of households in Chicopee earn $25,000 to $34,999.
11.3% of households in Chicopee earn $35,000 to $49,999.
17.2% of households in Chicopee earn $50,000 to $74,999.
14.3% of households in Chicopee earn $75,000 to $99,999.
16.6% of households in Chicopee earn $100,000 to $149,999.
6.2% of households in Chicopee earn $150,000 to $199,999.
5.2% of households in Chicopee earn $200,000 or more.
| Income | Chicopee | MA | USA |
|---|---|---|---|
| Less than $10,000 | 6.0% | 4.4% | 4.9% |
| $10,000 to $14,999 | 5.1% | 3.7% | 3.8% |
| $15,000 to $24,999 | 8.5% | 5.9% | 7.0% |
| $25,000 to $34,999 | 9.6% | 5.6% | 7.4% |
| $35,000 to $49,999 | 11.3% | 7.8% | 10.7% |
| $50,000 to $74,999 | 17.2% | 12.7% | 16.1% |
| $75,000 to $99,999 | 14.3% | 11.3% | 12.8% |
| $100,000 to $149,999 | 16.6% | 17.7% | 17.1% |
| $150,000 to $199,999 | 6.2% | 11.6% | 8.8% |
| $200,000 or more | 5.2% | 19.3% | 11.4% |


