
Suppose real estate is the most significant investment a majority of people make in their lifetime. In that case, it’s best to understand the places in Ohio with best potential return on investment.
After working in real estate adjacent roles for over a decade, I had the hypothesis that the best place to buy for a return on investment would be up-and-coming cities. Smaller cities where crime might be high now, but people still move to.
To test my hypothesis, we are going to look at places in Ohio that are growing faster than average, but where home prices are below average, and crime rates are higher than average.
In everyday terms, these might be “deals”. The best deal in Ohio at the moment according to Saturday Night Science? That would be Reminderville.
Table Of Contents: Top Ten | Methodology | Summary | Table
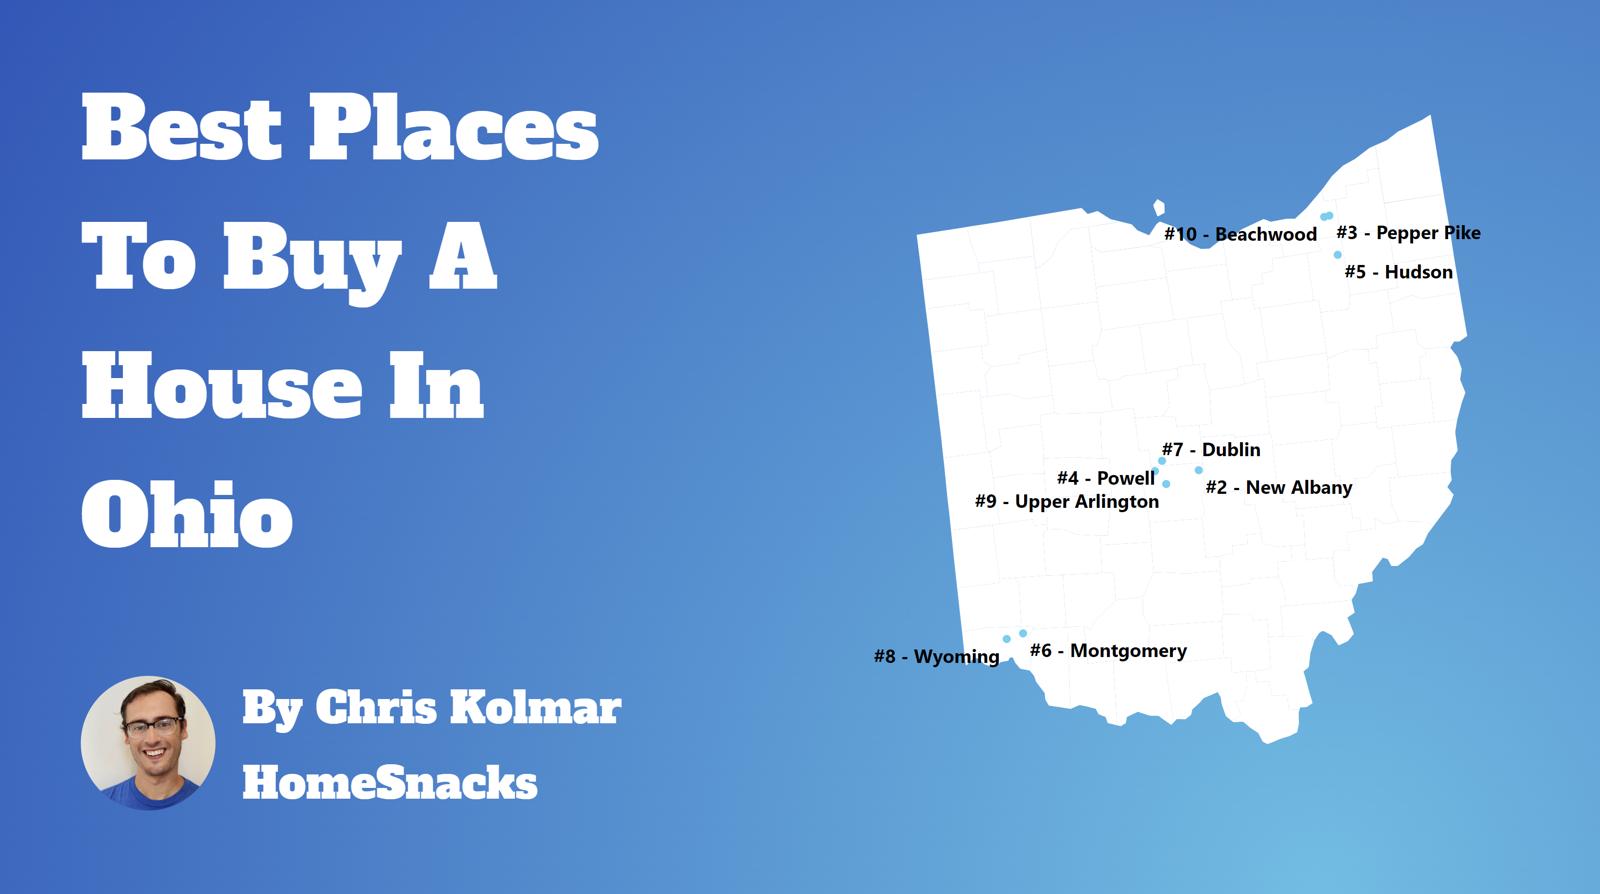
The 10 Best Places To Buy A Home In Ohio For 2025
The methodology that wen’t into this can be a bit complicated, so we’ll break it down for you in as much detail as we can below.
For more Ohio reading:
The 10 Best Cities To Buy A House In Ohio For 2025
/10
Population: 5,370
Median Home Price: $316,200
Population Change: 1.2%
Home Price Change: 4.4%
More on Reminderville: Data
/10
Population: 5,019
Median Home Price: $223,800
Population Change: -0.3%
Home Price Change: 11.0%
More on Munroe Falls: Data
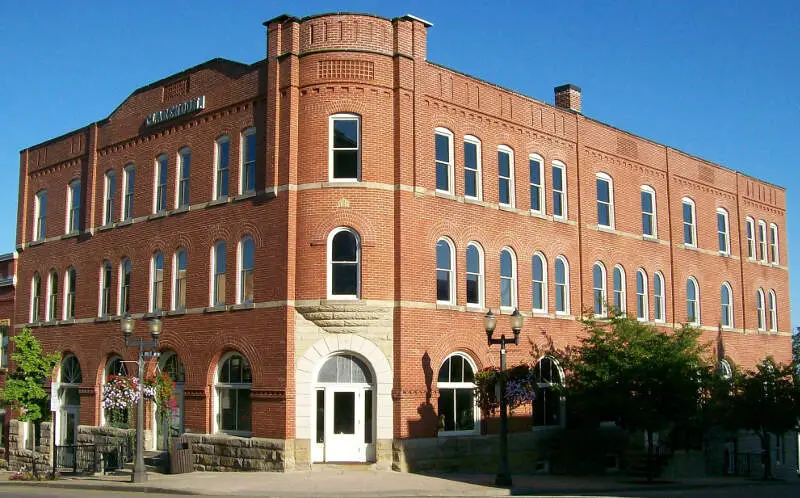
/10
Population: 5,043
Median Home Price: $197,600
Population Change: -0.8%
Home Price Change: 1.1%
More on St. Clairsville: Data

/10
Population: 5,247
Median Home Price: $314,600
Population Change: 1.2%
Home Price Change: 27.6%
More on John: Data
/10
Population: 5,246
Median Home Price: $274,500
Population Change: -0.0%
Home Price Change: 9.8%
More on Chardon: Data
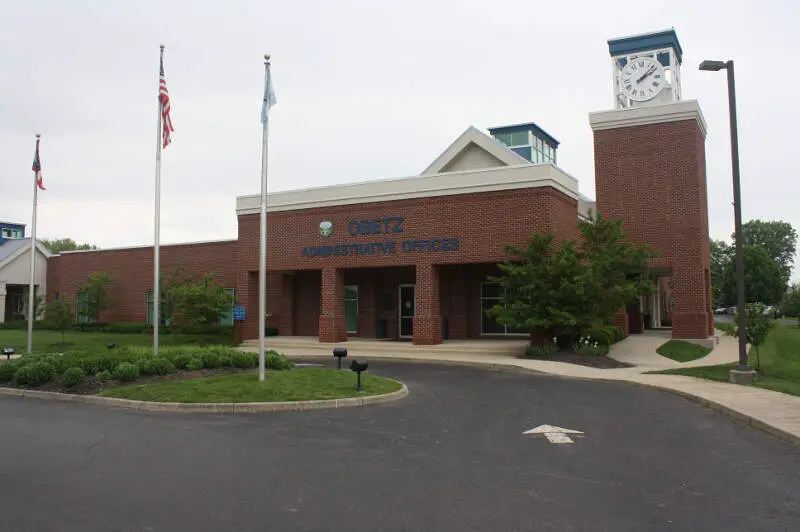
/10
Population: 6,293
Median Home Price: $191,700
Population Change: 12.8%
Home Price Change: 16.3%
More on Obetz: Data

/10
Population: 5,221
Median Home Price: $108,500
Population Change: -0.3%
Home Price Change: 13.7%
More on Uhrichsville: Data
/10
Population: 5,452
Median Home Price: $102,800
Population Change: 1.2%
Home Price Change: 4.4%
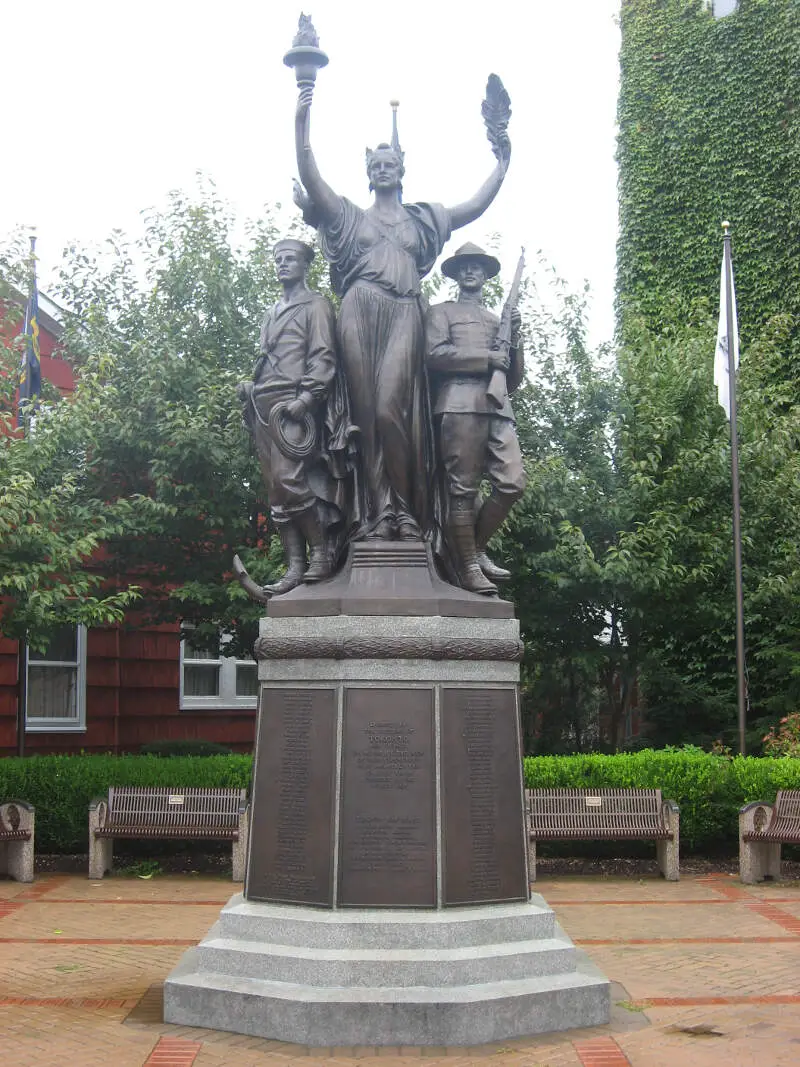
More on Toronto: Data
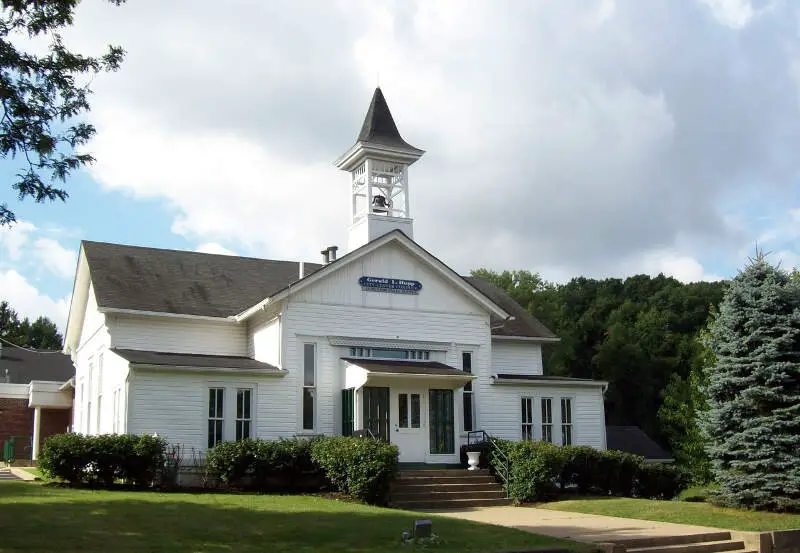
9. Carlisle
/10
Population: 5,460
Median Home Price: $185,400
Population Change: -0.5%
Home Price Change: 7.1%
More on Carlisle:

/10
Population: 5,326
Median Home Price: $184,500
Population Change: 0.2%
Home Price Change: 8.1%
More on Canal Fulton: Data
Methodology: How do you determine the best places to buy a home in Ohio for 2025?
We were in real estate for almost five years and have worked on this site for another 10. Suffice it to say we’ve put a lot of thought into finding an excellent place to buy a home.
So all that thinking has come to this moment where we get to spell out how we’d approach finding an up-and-coming place to live in Ohio. Put differently, the analysis will try to find places in Ohio with undervalued homes relative to pent-up demand using Saturday Night Science.
To do that, we looked at the most recent American Community Survey Census data for 2019-2023 and compared it to the previous vintage. Specifically, we used the following criteria:
- Y-o-Y Change In Population (People want to live here)
- Y-o-Y Change In Median Home Prices (People are willing to pay for it)
- Home Prices Relative To The State Average (It’s still kinda cheap)
We want places that are growing, have seen home prices increase in recent years, and are still “cheap” for Ohio with the following caveats:
- Home prices had to be within 20% of the state average (Much lower than that, and you get to some of the more dangerous places)
- Home prices increased in the last year, and
- Above 5,000 people (Bigger cities have more data points)
So of the 0 cities and towns in Ohio, only 254 places made it through our initial filters to even be considered.
We then ranked each place from 1 to 254 for the above criteria, with 1 being the best. We averaged the rankings to create a “best place to buy” index, with the place having the lowest index being the best.
Turns out that Reminderville is the best potential gem in the not-so-rough in the Buckeye State.
Summary: The Best Places To Purchase A House In Ohio for 2025
There’s our analysis of the best places to buy a house in Ohio. And, to be clear, we aren’t necessarily saying these places are the best places to live, just that it looks like they might be in a couple of years based on the data.
In fact, every place in the following table meets our criteria, so even though it may not look super long, remember we started off with all 0 places in the state.
The best cities to buy a house in Ohio are Reminderville, Munroe Falls, St. Clairsville, John, Chardon, Obetz, Uhrichsville, Toronto, Carlisle, and Canal Fulton.
So if we’d could rent or buy in these cities, we’d definitely buy.
For more Ohio reading, check out:
Best Places To Buy A Home In Ohio
| Rank | City | Population | Median Home Price | Population Change | Home Price Increase |
|---|---|---|---|---|---|
| 1 | Reminderville | 5,370 | $316,200 | 1.2% | 4.4% |
| 2 | Munroe Falls | 5,019 | $223,800 | -0.3% | 11.0% |
| 3 | St. Clairsville | 5,043 | $197,600 | -0.8% | 1.1% |
| 4 | John | 5,247 | $314,600 | 1.2% | 27.6% |
| 5 | Chardon | 5,246 | $274,500 | -0.0% | 9.8% |
| 6 | Obetz | 6,293 | $191,700 | 12.8% | 16.3% |
| 7 | Uhrichsville | 5,221 | $108,500 | -0.3% | 13.7% |
| 8 | Toronto | 5,452 | $102,800 | 1.2% | 4.4% |
| 9 | Carlisle | 5,460 | $185,400 | -0.5% | 7.1% |
| 10 | Canal Fulton | 5,326 | $184,500 | 0.2% | 8.1% |
| 11 | Northwood | 5,195 | $168,400 | 0.3% | 8.6% |
| 12 | Waterville | 5,997 | $271,100 | 0.3% | 5.6% |
| 13 | Wellston | 5,426 | $107,900 | 0.1% | -2.8% |
| 14 | Germantown | 5,796 | $186,900 | 0.2% | 13.7% |
| 15 | Deer Park | 5,380 | $189,400 | -0.4% | 6.4% |
| 16 | New Carlisle | 5,552 | $111,900 | -0.5% | 1.3% |
| 17 | Groveport | 5,916 | $245,200 | -0.2% | 13.7% |
| 18 | The Village Of Indian Hill | 6,048 | $1,156,800 | -0.0% | 4.9% |
| 19 | Granville | 5,916 | $490,500 | 2.4% | 10.4% |
| 20 | South Lebanon | 6,552 | $315,800 | 2.8% | 64.1% |
| 21 | Sunbury | 7,335 | $337,700 | 5.8% | 14.6% |
| 22 | Geneva | 5,912 | $138,900 | -0.4% | 5.3% |
| 23 | Grafton | 5,665 | $198,500 | -1.1% | 10.2% |
| 24 | Willard | 6,174 | $110,500 | -0.2% | 2.6% |
| 25 | Ontario | 6,649 | $163,300 | 0.1% | 10.9% |
| 26 | Clyde | 6,322 | $133,000 | 0.1% | 2.2% |
| 27 | Port Clinton | 5,999 | $142,100 | -0.4% | 7.7% |
| 28 | Jackson | 6,222 | $128,300 | 0.0% | 6.3% |
| 29 | Brookville | 6,234 | $170,900 | 3.3% | 5.0% |
| 30 | Pepper Pike | 6,807 | $558,300 | 0.4% | 8.4% |
| 31 | Belpre | 6,668 | $148,300 | -0.3% | 4.5% |
| 32 | Rittman | 6,033 | $153,200 | -0.4% | 5.6% |
| 33 | Moraine | 6,503 | $128,100 | 0.3% | 0.8% |
| 34 | Columbiana | 6,800 | $187,000 | 1.7% | 3.7% |
| 35 | Hillsboro | 6,539 | $136,900 | 0.7% | 14.0% |
| 36 | Rossford | 6,315 | $173,500 | 0.0% | 4.9% |
| 37 | Martins Ferry | 6,192 | $92,800 | -1.4% | 2.7% |
| 38 | Upper Sandusky | 6,580 | $151,300 | 0.7% | 4.4% |
| 39 | Logan | 7,077 | $143,000 | -1.3% | 6.3% |
| 40 | Union | 6,930 | $138,800 | 0.5% | 11.5% |
| 41 | Kirtland | 6,913 | $377,500 | -0.0% | 3.7% |
| 42 | Cortland | 7,091 | $199,300 | 0.3% | 4.6% |
| 43 | Milford | 6,525 | $228,200 | -0.5% | 7.7% |
| 44 | Mount Healthy | 6,932 | $126,200 | -0.2% | 9.4% |
| 45 | Huron | 6,824 | $205,900 | -0.8% | 7.3% |
| 46 | Delphos | 7,063 | $125,400 | -1.3% | 11.9% |
| 47 | Independence | 7,543 | $305,500 | 0.1% | 8.3% |
| 48 | Canfield | 7,651 | $225,100 | -0.1% | 10.5% |
| 49 | Wauseon | 7,387 | $143,400 | 1.2% | -1.2% |
| 50 | Bellbrook | 7,344 | $246,200 | 0.3% | 6.9% |
| 51 | Mentor-On-The-Lake | 7,117 | $171,200 | -0.5% | 5.5% |
| 52 | Hubbard | 7,600 | $123,600 | -0.2% | 4.7% |
| 53 | Fairlawn | 7,689 | $267,000 | -0.1% | 17.2% |
| 54 | Campbell | 7,812 | $77,400 | -0.1% | 2.1% |
| 55 | Bellevue | 8,201 | $130,100 | -0.1% | 6.2% |
| 56 | Eaton | 8,353 | $134,700 | -0.1% | 0.4% |
| 57 | St. Marys | 8,319 | $138,500 | -0.0% | 3.7% |
| 58 | Cheviot | 8,655 | $137,900 | -0.3% | 12.0% |
| 59 | Bryan | 8,664 | $132,000 | -0.1% | 5.9% |
| 60 | Oberlin | 8,054 | $207,500 | -1.7% | 12.6% |
| 61 | Grandview Heights | 8,422 | $548,100 | 2.0% | 5.0% |
| 62 | Orrville | 8,361 | $178,500 | 0.7% | 8.0% |
| 63 | Shelby | 8,706 | $117,300 | 4.1% | 2.3% |
| 64 | Napoleon | 8,561 | $139,500 | -3.7% | 0.9% |
| 65 | Highland Heights | 8,619 | $342,400 | -0.4% | 2.0% |
| 66 | Kenton | 7,607 | $98,100 | -1.0% | 6.2% |
| 67 | Wyoming | 8,712 | $404,500 | -0.1% | 7.4% |
| 68 | Olmsted Falls | 8,640 | $214,800 | -0.3% | 8.4% |
| 69 | Oakwood | 9,480 | $350,100 | -0.2% | 11.7% |
| 70 | Sheffield Lake | 8,946 | $153,400 | -0.1% | 7.0% |
| 71 | Canal Winchester | 9,659 | $314,800 | 3.2% | 15.8% |
| 72 | Madeira | 9,454 | $463,600 | 0.3% | 7.1% |
| 73 | Girard | 9,521 | $105,700 | -0.5% | 9.9% |
| 74 | North College Hill | 9,564 | $125,200 | -0.4% | 12.5% |
| 75 | Louisville | 9,560 | $192,700 | 0.6% | 6.4% |
| 76 | Willoughby Hills | 9,979 | $305,800 | 0.1% | -0.4% |
| 77 | Wapakoneta | 9,867 | $146,000 | -0.1% | 4.4% |
| 78 | Galion | 10,358 | $100,900 | -0.2% | 8.0% |
| 79 | Tipp City | 10,344 | $237,400 | 0.8% | 6.6% |
| 80 | Struthers | 9,995 | $92,800 | -0.7% | 6.7% |
| 81 | London | 10,403 | $194,800 | 0.8% | 11.6% |
| 82 | Reading | 10,490 | $184,200 | -0.4% | 9.6% |
| 83 | Richmond Heights | 10,677 | $176,100 | -0.3% | 6.5% |
| 84 | Cambridge | 10,046 | $116,000 | -0.4% | 8.0% |
| 85 | Celina | 11,017 | $158,800 | 0.4% | 4.5% |
| 86 | Bedford Heights | 10,876 | $137,500 | -0.5% | 12.3% |
| 87 | Van Wert | 10,710 | $109,700 | -1.1% | 10.3% |
| 88 | Vermilion | 10,451 | $172,000 | -0.1% | 5.7% |
| 89 | East Liverpool | 9,869 | $78,100 | -1.0% | 20.9% |
| 90 | Ironton | 10,585 | $112,400 | -0.1% | 8.6% |
| 91 | Brooklyn | 11,203 | $153,000 | -0.5% | 9.3% |
| 92 | Montgomery | 10,816 | $505,800 | 0.0% | 8.7% |
| 93 | Heath | 10,545 | $215,000 | 0.5% | 14.2% |
| 94 | Coshocton | 11,056 | $121,400 | 0.0% | 12.0% |
| 95 | New Albany | 10,524 | $728,200 | 0.1% | 14.7% |
| 96 | Springdale | 10,983 | $171,400 | -0.1% | 1.7% |
| 97 | Urbana | 11,153 | $147,300 | -0.0% | 12.4% |
| 98 | Ravenna | 11,286 | $129,400 | -0.3% | 4.9% |
| 99 | Seven Hills | 11,628 | $239,600 | -0.5% | 5.6% |
| 100 | Beachwood | 13,850 | $381,600 | 0.0% | 5.3% |