Cambridge SnackAbility
Overall SnackAbility
Crime in Cambridge summary. We use data from the FBI to determine the crime rates in Cambridge. Key points include:
There were 205 total crimes in Cambridge in the last reporting year.
The overall crime rate per 100,000 people in Cambridge is 2,064.0 / 100k people.
The violent crime rate per 100,000 people in Cambridge is 90.6 / 100k people.
The property crime rate per 100,000 people in Cambridge is 1,973.4 / 100k people.
Overall, crime in Cambridge is -2.60% below the national average.
Total Crimes
Below National Average
Crime In Cambridge Comparison Table
| Statistic | Count Raw |
Cambridge / 100k People |
Ohio / 100k People |
National / 100k People |
|---|---|---|---|---|
| Total Crimes Per 100K | 205 | 2,064.0 | 1,844.9 | 2,119.2 |
| Violent Crime | 9 | 90.6 | 293.7 | 359.0 |
| Murder | 0 | 0.0 | 5.0 | 5.0 |
| Robbery | 0 | 0.0 | 45.5 | 61.0 |
| Aggravated Assault | 4 | 40.3 | 197.4 | 256.0 |
| Property Crime | 196 | 1,973.4 | 1,551.2 | 1,760.0 |
| Burglary | 10 | 100.7 | 206.0 | 229.0 |
| Larceny | 186 | 1,872.7 | 1,132.8 | 1,272.0 |
| Car Theft | 0 | 0.0 | 212.5 | 259.0 |
Source: FBI Uniform Crime Reporting (2024)
Cost of living in Cambridge summary. We use data on the cost of living to determine how expensive it is to live in Cambridge. Real estate prices drive most of the variance in cost of living around Ohio. Key points include:
The cost of living in Cambridge is 84 with 100 being average.
The cost of living in Cambridge is 0.8x lower than the national average.
The median home value in Cambridge is $167,595.
The median income in Cambridge is $42,946.
Cambridge's Overall Cost Of Living
Lower Than The National Average
Cost Of Living In Cambridge Comparison Table
| Living Expense | Cambridge | Ohio | National Average |
|---|---|---|---|
| Overall | 84 | 90 | 100 |
| Services | 94 | 97 | 100 |
| Groceries | 100 | 97 | 100 |
| Health | 58 | 75 | 100 |
| Housing | 93 | 97 | 100 |
| Transportation | 100 | 95 | 100 |
| Utilities | 93 | 97 | 100 |
Source: Cost of living index, normalized to US average = 100
Cambridge, OH Weather
The average high in Cambridge is 62.1° and the average low is 40.9°.
There are 82.7 days of precipitation each year.
Expect an average of 39.3 inches of precipitation each year with 23.1 inches of snow.
| Stat | Cambridge |
|---|---|
| Average Annual High | 62.1 |
| Average Annual Low | 40.9 |
| Annual Precipitation Days | 82.7 |
| Average Annual Precipitation | 39.3 |
| Average Annual Snowfall | 23.1 |
Average High
Days of Rain
Source: NOAA climate normals (30-year)
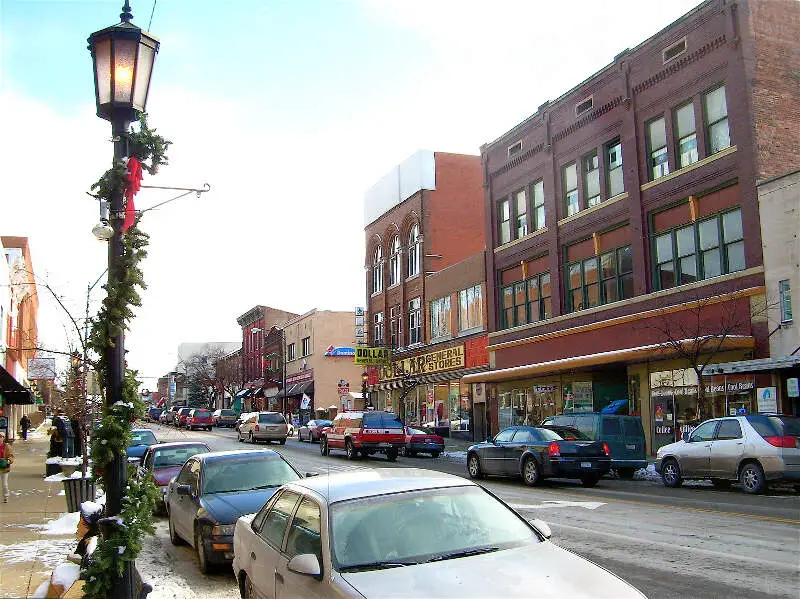
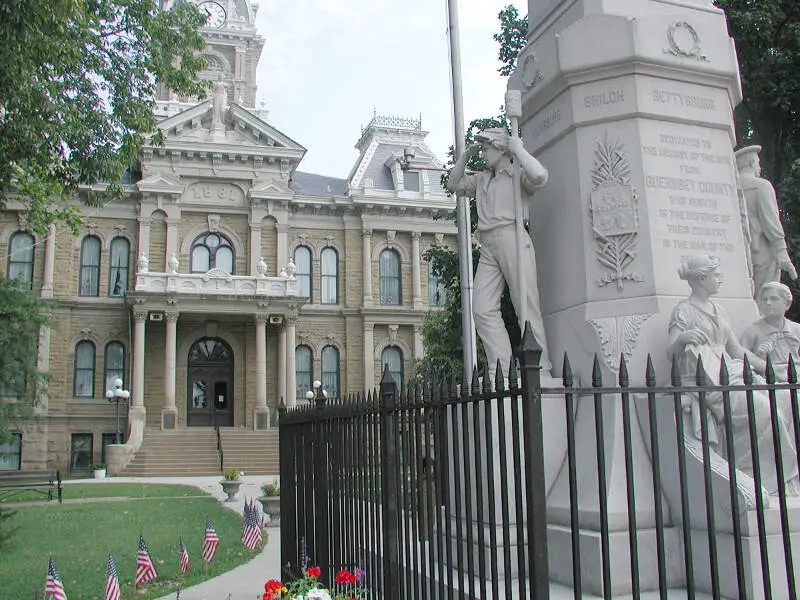
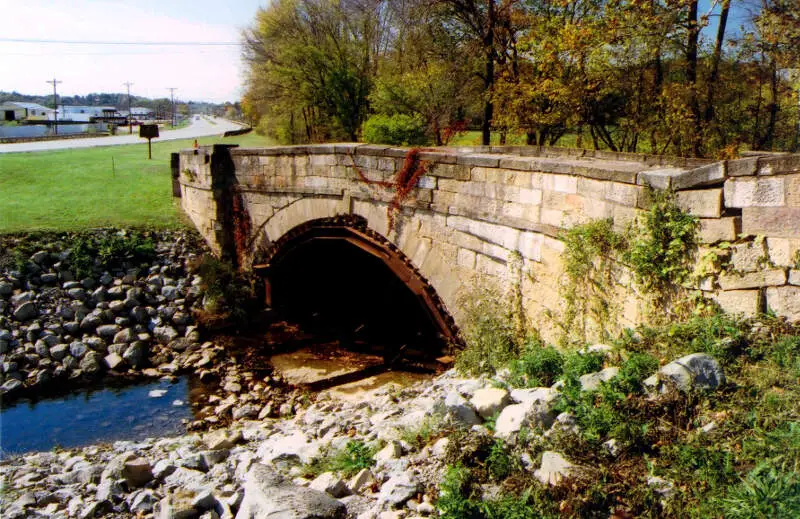
Cambridge, OH Photos
1 Reviews & Comments About Cambridge

I live in Cambridge. Corrupt Collusion and Crime in law enforcement and courts. Add in the dozens of churches banks and drugs and you got a nightmare. Plus, the most prejudices of any city I have ever lived. Yes, toothless welfare poor and even worse, the white uppity north side. No money is spend on other parts of the city, thus making real estate a joke. Jobs- Only for the peppy whites, gotta keep the all-American small town values- Just as long as they are white. And yes, the N-word is common everyday lingo here. Guns- Everywhere. Kkk, rednecks, confederate flags and 10 fraternal orders.. Historic- Sure, but they never tell anyone about the hate crimes during early settlement, and currently. Another small town of who you know and blow. Outsiders, those not born and raised here, are unwelcome and expect harassment. Afterall, these closed-minded folks need to know everyone's business... ABSOLUTELY TERRIFYING, from an outsider.
Rankings & Articles For Cambridge


Locations Around Cambridge
Map Of Cambridge, OH
Best Places Around Cambridge
Granville, OH
Population 5,999
Apple Valley, OH
Population 5,548
New Philadelphia, OH
Population 17,520
Dover, OH
Population 13,053
St. Clairsville, OH
Population 5,003
Heath, OH
Population 10,644
Uhrichsville, OH
Population 5,189
Newark, OH
Population 50,783
Marietta, OH
Population 13,203
Morristown, TN
Population 31,527
Cambridge Demographics And Statistics
Population over time in Cambridge
The current population in Cambridge is 10,060. The population has decreased 7.1% from 2010.
| Year | Population | % Change |
|---|---|---|
| 2024 | 10,060 | 0.1% |
| 2023 | 10,046 | -0.4% |
| 2022 | 10,087 | -0.3% |
| 2021 | 10,116 | -2.7% |
| 2020 | 10,398 | 0.4% |
| 2019 | 10,360 | -0.7% |
| 2018 | 10,432 | -0.6% |
| 2017 | 10,491 | -0.0% |
| 2016 | 10,495 | -0.2% |
| 2015 | 10,511 | -0.4% |
| 2014 | 10,558 | -0.6% |
| 2013 | 10,622 | -0.4% |
| 2012 | 10,669 | -0.7% |
| 2011 | 10,749 | -0.8% |
| 2010 | 10,831 | - |
Race / Ethnicity in Cambridge
See the full breakdown
Cambridge is:
88.1% White with 8,864 White residents.
6.1% African American with 613 African American residents.
0.0% American Indian with 4 American Indian residents.
0.2% Asian with 19 Asian residents.
0.0% Hawaiian with 0 Hawaiian residents.
0.1% Other with 7 Other residents.
3.3% Two Or More with 336 Two Or More residents.
2.2% Hispanic with 217 Hispanic residents.
| Race | Cambridge | OH | USA |
|---|---|---|---|
| White | 88.1% | 75.8% | 57.4% |
| African American | 6.1% | 12.0% | 11.9% |
| American Indian | 0.0% | 0.1% | 0.5% |
| Asian | 0.2% | 2.5% | 5.9% |
| Hawaiian | 0.0% | 0.0% | 0.2% |
| Other | 0.1% | 0.4% | 0.6% |
| Two Or More | 3.3% | 4.3% | 4.3% |
| Hispanic | 2.2% | 4.8% | 19.3% |
Gender in Cambridge
See the full breakdown
Cambridge is 52.4% female with 5,267 female residents.
Cambridge is 47.6% male with 4,793 male residents.
| Gender | Cambridge | OH | USA |
|---|---|---|---|
| Female | 52.4% | 50.7% | 50.5% |
| Male | 47.6% | 49.3% | 49.5% |
Highest level of educational attainment in Cambridge for adults over 25
See the full breakdown
4.0% of adults in Cambridge completed < 9th grade.
10.0% of adults in Cambridge completed 9-12th grade.
45.0% of adults in Cambridge completed high school / ged.
17.0% of adults in Cambridge completed some college.
9.0% of adults in Cambridge completed associate's degree.
10.0% of adults in Cambridge completed bachelor's degree.
5.0% of adults in Cambridge completed master's degree.
0.0% of adults in Cambridge completed professional degree.
0.0% of adults in Cambridge completed doctorate degree.
| Education | Cambridge | OH | USA |
|---|---|---|---|
| < 9th Grade | 4.0% | 3.0% | 4.0% |
| 9-12th Grade | 10.0% | 6.0% | 6.0% |
| High School / GED | 45.0% | 32.0% | 26.0% |
| Some College | 17.0% | 19.0% | 19.0% |
| Associate's Degree | 9.0% | 9.0% | 9.0% |
| Bachelor's Degree | 10.0% | 19.0% | 22.0% |
| Master's Degree | 5.0% | 9.0% | 10.0% |
| Professional Degree | 0.0% | 2.0% | 2.0% |
| Doctorate Degree | 0.0% | 1.0% | 2.0% |
Household Income For Cambridge, Ohio
See the full breakdown
8.9% of households in Cambridge earn Less than $10,000.
11.0% of households in Cambridge earn $10,000 to $14,999.
12.5% of households in Cambridge earn $15,000 to $24,999.
10.1% of households in Cambridge earn $25,000 to $34,999.
12.6% of households in Cambridge earn $35,000 to $49,999.
13.6% of households in Cambridge earn $50,000 to $74,999.
16.7% of households in Cambridge earn $75,000 to $99,999.
10.8% of households in Cambridge earn $100,000 to $149,999.
1.3% of households in Cambridge earn $150,000 to $199,999.
2.6% of households in Cambridge earn $200,000 or more.
| Income | Cambridge | OH | USA |
|---|---|---|---|
| Less than $10,000 | 8.9% | 5.2% | 5.0% |
| $10,000 to $14,999 | 11.0% | 4.0% | 3.4% |
| $15,000 to $24,999 | 12.5% | 7.1% | 6.3% |
| $25,000 to $34,999 | 10.1% | 7.5% | 6.6% |
| $35,000 to $49,999 | 12.6% | 11.6% | 10.1% |
| $50,000 to $74,999 | 13.6% | 16.9% | 15.5% |
| $75,000 to $99,999 | 16.7% | 13.1% | 12.6% |
| $100,000 to $149,999 | 10.8% | 17.1% | 17.5% |
| $150,000 to $199,999 | 1.3% | 8.3% | 9.6% |
| $200,000 or more | 2.6% | 9.1% | 13.4% |
Source: U.S. Census ACS 5-year estimates (2024)


