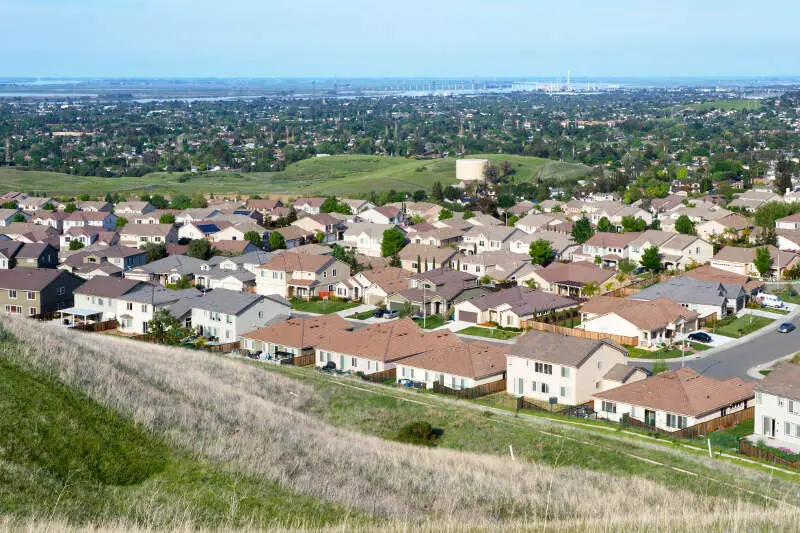
Antioch, CA
Demographics And Statistics
Living In Antioch, California Summary
Life in Antioch research summary. HomeSnacks has been using Saturday Night Science to research the quality of life in Antioch over the past nine years using Census, FBI, Zillow, and other primary data sources. Based on the most recently available data, we found the following about life in Antioch:
The population in Antioch is 115,759.
The median home value in Antioch is $591,783.
The median income in Antioch is $94,256.
The cost of living in Antioch is 146 which is 1.5x higher than the national average.
The median rent in Antioch is $2,241.
The unemployment rate in Antioch is 7.1%.
The poverty rate in Antioch is 11.2%.
The average high in Antioch is 70.4° and the average low is 48.6°.
Antioch SnackAbility
Overall SnackAbility
Antioch, CA Crime Report
Crime in Antioch summary. We use data from the FBI to determine the crime rates in Antioch. Key points include:
There were 4,472 total crimes in Antioch in the last reporting year.
The overall crime rate per 100,000 people in Antioch is 3,800.3 / 100k people.
The violent crime rate per 100,000 people in Antioch is 606.8 / 100k people.
The property crime rate per 100,000 people in Antioch is 3,193.5 / 100k people.
Overall, crime in Antioch is 79.32% above the national average.
Total Crimes
Above National Average
Crime In Antioch Comparison Table
| Statistic | Count Raw |
Antioch / 100k People |
California / 100k People |
National / 100k People |
|---|---|---|---|---|
| Total Crimes Per 100K | 4,472 | 3,800.3 | 2,564.5 | 2,119.2 |
| Violent Crime | 714 | 606.8 | 486.0 | 359.0 |
| Murder | 16 | 13.6 | 4.5 | 5.0 |
| Robbery | 218 | 185.3 | 119.1 | 61.0 |
| Aggravated Assault | 434 | 368.8 | 325.8 | 256.0 |
| Property Crime | 3,758 | 3,193.5 | 2,078.4 | 1,760.0 |
| Burglary | 549 | 466.5 | 305.8 | 229.0 |
| Larceny | 1,604 | 1,363.1 | 1,345.2 | 1,272.0 |
| Car Theft | 1,605 | 1,363.9 | 427.5 | 259.0 |
Antioch, CA Cost Of Living
Cost of living in Antioch summary. We use data on the cost of living to determine how expensive it is to live in Antioch. Real estate prices drive most of the variance in cost of living around California. Key points include:
The cost of living in Antioch is 146 with 100 being average.
The cost of living in Antioch is 1.5x higher than the national average.
The median home value in Antioch is $591,783.
The median income in Antioch is $94,256.
Antioch's Overall Cost Of Living
Higher Than The National Average
Cost Of Living In Antioch Comparison Table
| Living Expense | Antioch | California | National Average | |
|---|---|---|---|---|
| Overall | 146 | 141 | 100 | |
| Services | 107 | 110 | 100 | |
| Groceries | 109 | 112 | 100 | |
| Health | 100 | 110 | 100 | |
| Housing | 224 | 195 | 100 | |
| Transportation | 123 | 125 | 100 | |
| Utilities | 141 | 128 | 100 | |
Antioch, CA Weather
The average high in Antioch is 70.4° and the average low is 48.6°.
There are 41.7 days of precipitation each year.
Expect an average of 21.0 inches of precipitation each year with 0.2 inches of snow.
| Stat | Antioch |
|---|---|
| Average Annual High | 70.4 |
| Average Annual Low | 48.6 |
| Annual Precipitation Days | 41.7 |
| Average Annual Precipitation | 21.0 |
| Average Annual Snowfall | 0.2 |
Average High
Days of Rain
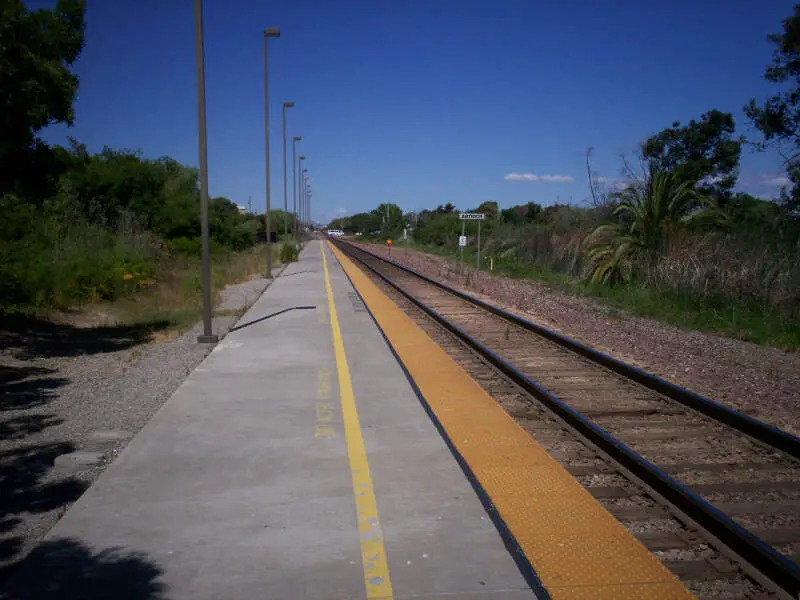
Antioch, CA Photos


Rankings for Antioch in California


Locations Around Antioch
Map Of Antioch, CA
Best Places Around Antioch
San Ramon, CA
Population 85,734
Dublin, CA
Population 70,542
Mountain View, CA
Population 82,363
Lafayette, CA
Population 25,277
Danville, CA
Population 43,426
Martinez, CA
Population 36,926
Blackhawk, CA
Population 10,404
Clayton, CA
Population 10,962
Pleasant Hill, CA
Population 34,335
Oakley, CA
Population 44,311
Antioch Demographics And Statistics
Population over time in Antioch
The current population in Antioch is 115,759. The population has increased 16.1% from 2010.
| Year | Population | % Change |
|---|---|---|
| 2023 | 115,759 | 0.6% |
| 2022 | 115,016 | 0.2% |
| 2021 | 114,750 | 2.9% |
| 2020 | 111,468 | 0.2% |
| 2019 | 111,200 | 0.4% |
| 2018 | 110,730 | 0.6% |
| 2017 | 110,026 | 1.2% |
| 2016 | 108,675 | 1.1% |
| 2015 | 107,501 | 1.8% |
| 2014 | 105,630 | 1.5% |
| 2013 | 104,035 | 1.4% |
| 2012 | 102,575 | 1.4% |
| 2011 | 101,118 | 1.4% |
| 2010 | 99,717 | - |
Race / Ethnicity in Antioch
Antioch is:
24.2% White with 27,990 White residents.
19.1% African American with 22,142 African American residents.
0.3% American Indian with 388 American Indian residents.
13.2% Asian with 15,234 Asian residents.
1.0% Hawaiian with 1,199 Hawaiian residents.
0.3% Other with 303 Other residents.
5.8% Two Or More with 6,760 Two Or More residents.
36.1% Hispanic with 41,743 Hispanic residents.
| Race | Antioch | CA | USA |
|---|---|---|---|
| White | 24.2% | 34.6% | 58.2% |
| African American | 19.1% | 5.3% | 12.0% |
| American Indian | 0.3% | 0.3% | 0.5% |
| Asian | 13.2% | 15.1% | 5.7% |
| Hawaiian | 1.0% | 0.3% | 0.2% |
| Other | 0.3% | 0.5% | 0.5% |
| Two Or More | 5.8% | 4.1% | 3.9% |
| Hispanic | 36.1% | 39.8% | 19.0% |
Gender in Antioch
Antioch is 53.1% female with 61,462 female residents.
Antioch is 46.9% male with 54,297 male residents.
| Gender | Antioch | CA | USA |
|---|---|---|---|
| Female | 53.1% | 50.0% | 50.5% |
| Male | 46.9% | 50.0% | 49.5% |
Highest level of educational attainment in Antioch for adults over 25
8.0% of adults in Antioch completed < 9th grade.
7.0% of adults in Antioch completed 9-12th grade.
28.0% of adults in Antioch completed high school / ged.
24.0% of adults in Antioch completed some college.
9.0% of adults in Antioch completed associate's degree.
18.0% of adults in Antioch completed bachelor's degree.
5.0% of adults in Antioch completed master's degree.
1.0% of adults in Antioch completed professional degree.
0.0% of adults in Antioch completed doctorate degree.
| Education | Antioch | CA | USA |
|---|---|---|---|
| < 9th Grade | 8.0% | 8.0% | 5.0% |
| 9-12th Grade | 7.0% | 7.0% | 6.0% |
| High School / GED | 28.0% | 20.0% | 26.0% |
| Some College | 24.0% | 20.0% | 19.0% |
| Associate's Degree | 9.0% | 8.0% | 9.0% |
| Bachelor's Degree | 18.0% | 22.0% | 21.0% |
| Master's Degree | 5.0% | 10.0% | 10.0% |
| Professional Degree | 1.0% | 3.0% | 2.0% |
| Doctorate Degree | 0.0% | 2.0% | 2.0% |
Household Income For Antioch, California
3.7% of households in Antioch earn Less than $10,000.
2.3% of households in Antioch earn $10,000 to $14,999.
4.0% of households in Antioch earn $15,000 to $24,999.
5.8% of households in Antioch earn $25,000 to $34,999.
8.6% of households in Antioch earn $35,000 to $49,999.
14.8% of households in Antioch earn $50,000 to $74,999.
13.8% of households in Antioch earn $75,000 to $99,999.
17.4% of households in Antioch earn $100,000 to $149,999.
11.8% of households in Antioch earn $150,000 to $199,999.
17.9% of households in Antioch earn $200,000 or more.
| Income | Antioch | CA | USA |
|---|---|---|---|
| Less than $10,000 | 3.7% | 4.4% | 4.9% |
| $10,000 to $14,999 | 2.3% | 3.0% | 3.6% |
| $15,000 to $24,999 | 4.0% | 5.2% | 6.6% |
| $25,000 to $34,999 | 5.8% | 5.5% | 6.8% |
| $35,000 to $49,999 | 8.6% | 8.4% | 10.4% |
| $50,000 to $74,999 | 14.8% | 13.3% | 15.7% |
| $75,000 to $99,999 | 13.8% | 11.8% | 12.7% |
| $100,000 to $149,999 | 17.4% | 17.9% | 17.4% |
| $150,000 to $199,999 | 11.8% | 11.1% | 9.3% |
| $200,000 or more | 17.9% | 19.4% | 12.6% |


