Shafter SnackAbility
Overall SnackAbility
Crime in Shafter summary. We use data from the FBI to determine the crime rates in Shafter. Key points include:
There were 371 total crimes in Shafter in the last reporting year.
The overall crime rate per 100,000 people in Shafter is 1,643.8 / 100k people.
The violent crime rate per 100,000 people in Shafter is 279.1 / 100k people.
The property crime rate per 100,000 people in Shafter is 1,364.6 / 100k people.
Overall, crime in Shafter is -22.44% below the national average.
Total Crimes
Below National Average
Crime In Shafter Comparison Table
| Statistic | Count Raw |
Shafter / 100k People |
California / 100k People |
National / 100k People |
|---|---|---|---|---|
| Total Crimes Per 100K | 371 | 1,643.8 | 2,564.5 | 2,119.2 |
| Violent Crime | 63 | 279.1 | 486.0 | 359.0 |
| Murder | 0 | 0.0 | 4.5 | 5.0 |
| Robbery | 2 | 8.9 | 119.1 | 61.0 |
| Aggravated Assault | 49 | 217.1 | 325.8 | 256.0 |
| Property Crime | 308 | 1,364.6 | 2,078.4 | 1,760.0 |
| Burglary | 26 | 115.2 | 305.8 | 229.0 |
| Larceny | 182 | 806.4 | 1,345.2 | 1,272.0 |
| Car Theft | 100 | 443.1 | 427.5 | 259.0 |
Source: FBI Uniform Crime Reporting (2024)
Cost of living in Shafter summary. We use data on the cost of living to determine how expensive it is to live in Shafter. Real estate prices drive most of the variance in cost of living around California. Key points include:
The cost of living in Shafter is 113 with 100 being average.
The cost of living in Shafter is 1.1x higher than the national average.
The median home value in Shafter is $382,593.
The median income in Shafter is $71,215.
Shafter's Overall Cost Of Living
Higher Than The National Average
Cost Of Living In Shafter Comparison Table
| Living Expense | Shafter | California | National Average |
|---|---|---|---|
| Overall | 113 | 142 | 100 |
| Services | 112 | 110 | 100 |
| Groceries | 112 | 118 | 100 |
| Health | 104 | 197 | 100 |
| Housing | 119 | 120 | 100 |
| Transportation | 116 | 121 | 100 |
| Utilities | 110 | 121 | 100 |
Source: Cost of living index, normalized to US average = 100
Shafter, CA Weather
The average high in Shafter is 75.7° and the average low is 48.6°.
There are 22.3 days of precipitation each year.
Expect an average of 8.4 inches of precipitation each year with 1.7 inches of snow.
| Stat | Shafter |
|---|---|
| Average Annual High | 75.7 |
| Average Annual Low | 48.6 |
| Annual Precipitation Days | 22.3 |
| Average Annual Precipitation | 8.4 |
| Average Annual Snowfall | 1.7 |
Average High
Days of Rain
Source: NOAA climate normals (30-year)
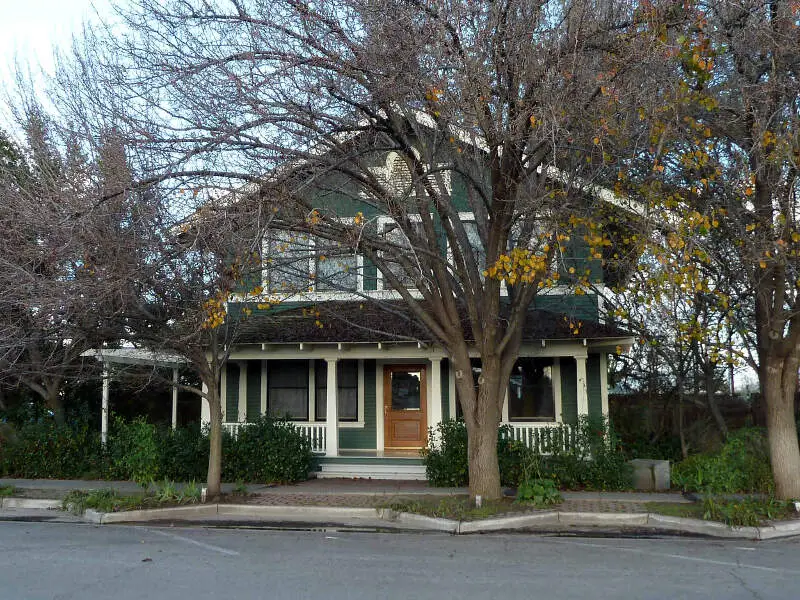
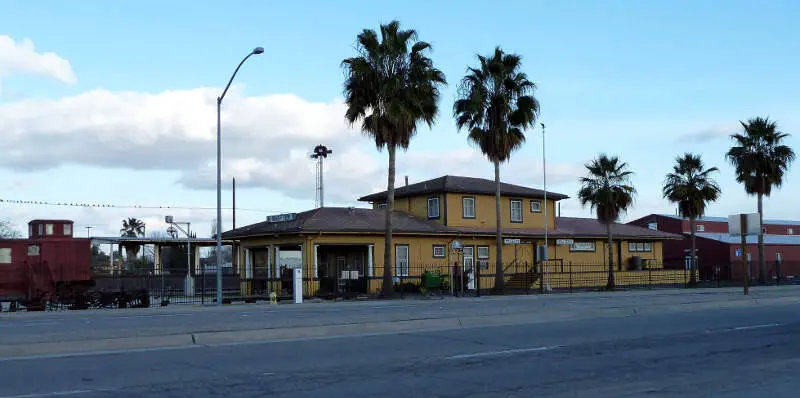
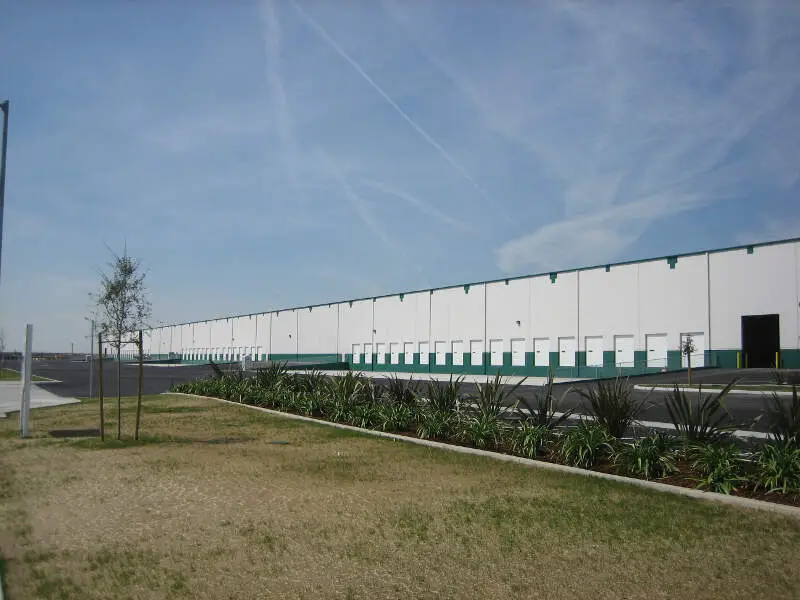
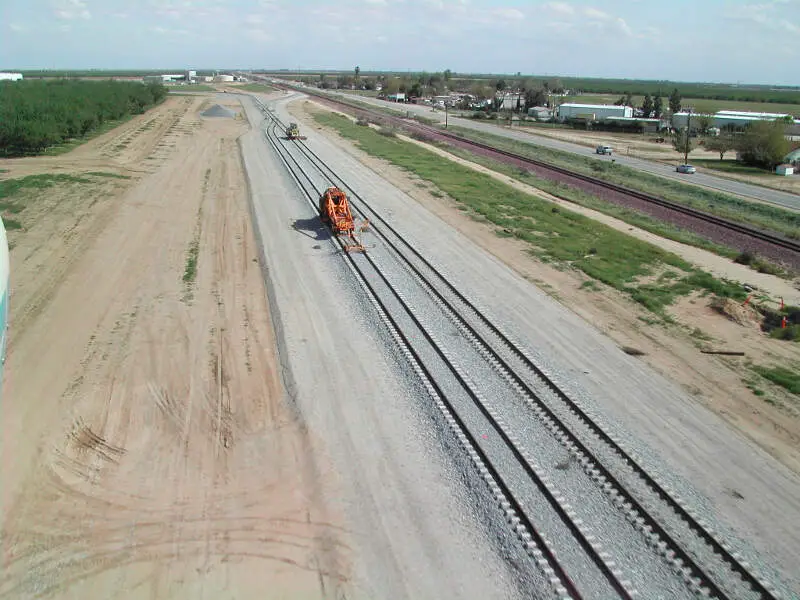
Shafter, CA Photos


Rankings & Articles For Shafter


Locations Around Shafter
Map Of Shafter, CA
Best Places Around Shafter
Greenfield, CA
Population 3,939
Rosedale, CA
Population 18,877
McFarland, CA
Population 14,222
Bakersfield, CA
Population 411,986
Oildale, CA
Population 34,687
Wasco, CA
Population 26,558
Shafter Demographics And Statistics
Population over time in Shafter
The current population in Shafter is 21,193. The population has increased 29.4% from 2010.
| Year | Population | % Change |
|---|---|---|
| 2024 | 21,193 | 2.8% |
| 2023 | 20,618 | 2.3% |
| 2022 | 20,162 | 1.3% |
| 2021 | 19,897 | 0.8% |
| 2020 | 19,743 | 1.5% |
| 2019 | 19,447 | 2.8% |
| 2018 | 18,923 | 2.7% |
| 2017 | 18,433 | 3.6% |
| 2016 | 17,801 | 1.6% |
| 2015 | 17,513 | 1.5% |
| 2014 | 17,261 | 1.0% |
| 2013 | 17,088 | 0.9% |
| 2012 | 16,940 | 1.4% |
| 2011 | 16,709 | 2.0% |
| 2010 | 16,378 | - |
Race / Ethnicity in Shafter
See the full breakdown
Shafter is:
14.8% White with 3,130 White residents.
1.3% African American with 272 African American residents.
0.0% American Indian with 0 American Indian residents.
2.5% Asian with 524 Asian residents.
0.1% Hawaiian with 24 Hawaiian residents.
0.0% Other with 0 Other residents.
0.8% Two Or More with 164 Two Or More residents.
80.6% Hispanic with 17,079 Hispanic residents.
| Race | Shafter | CA | USA |
|---|---|---|---|
| White | 14.8% | 33.8% | 57.4% |
| African American | 1.3% | 5.2% | 11.9% |
| American Indian | 0.0% | 0.3% | 0.5% |
| Asian | 2.5% | 15.3% | 5.9% |
| Hawaiian | 0.1% | 0.3% | 0.2% |
| Other | 0.0% | 0.6% | 0.6% |
| Two Or More | 0.8% | 4.4% | 4.3% |
| Hispanic | 80.6% | 40.2% | 19.3% |
Gender in Shafter
See the full breakdown
Shafter is 50.6% female with 10,732 female residents.
Shafter is 49.4% male with 10,460 male residents.
| Gender | Shafter | CA | USA |
|---|---|---|---|
| Female | 50.6% | 50.1% | 50.5% |
| Male | 49.4% | 49.9% | 49.5% |
Highest level of educational attainment in Shafter for adults over 25
See the full breakdown
18.0% of adults in Shafter completed < 9th grade.
9.0% of adults in Shafter completed 9-12th grade.
28.0% of adults in Shafter completed high school / ged.
25.0% of adults in Shafter completed some college.
8.0% of adults in Shafter completed associate's degree.
8.0% of adults in Shafter completed bachelor's degree.
3.0% of adults in Shafter completed master's degree.
1.0% of adults in Shafter completed professional degree.
0.0% of adults in Shafter completed doctorate degree.
| Education | Shafter | CA | USA |
|---|---|---|---|
| < 9th Grade | 18.0% | 8.0% | 4.0% |
| 9-12th Grade | 9.0% | 7.0% | 6.0% |
| High School / GED | 28.0% | 20.0% | 26.0% |
| Some College | 25.0% | 19.0% | 19.0% |
| Associate's Degree | 8.0% | 8.0% | 9.0% |
| Bachelor's Degree | 8.0% | 23.0% | 22.0% |
| Master's Degree | 3.0% | 10.0% | 10.0% |
| Professional Degree | 1.0% | 3.0% | 2.0% |
| Doctorate Degree | 0.0% | 2.0% | 2.0% |
Household Income For Shafter, California
See the full breakdown
2.8% of households in Shafter earn Less than $10,000.
5.0% of households in Shafter earn $10,000 to $14,999.
6.8% of households in Shafter earn $15,000 to $24,999.
6.7% of households in Shafter earn $25,000 to $34,999.
15.6% of households in Shafter earn $35,000 to $49,999.
16.7% of households in Shafter earn $50,000 to $74,999.
12.0% of households in Shafter earn $75,000 to $99,999.
17.9% of households in Shafter earn $100,000 to $149,999.
10.9% of households in Shafter earn $150,000 to $199,999.
5.7% of households in Shafter earn $200,000 or more.
| Income | Shafter | CA | USA |
|---|---|---|---|
| Less than $10,000 | 2.8% | 4.5% | 5.0% |
| $10,000 to $14,999 | 5.0% | 2.9% | 3.4% |
| $15,000 to $24,999 | 6.8% | 5.0% | 6.3% |
| $25,000 to $34,999 | 6.7% | 5.3% | 6.6% |
| $35,000 to $49,999 | 15.6% | 8.1% | 10.1% |
| $50,000 to $74,999 | 16.7% | 13.0% | 15.5% |
| $75,000 to $99,999 | 12.0% | 11.6% | 12.6% |
| $100,000 to $149,999 | 17.9% | 17.8% | 17.5% |
| $150,000 to $199,999 | 10.9% | 11.3% | 9.6% |
| $200,000 or more | 5.7% | 20.5% | 13.4% |
Source: U.S. Census ACS 5-year estimates (2024)


