Compare Chula Vista to…
Chula Vista SnackAbility
Overall SnackAbility
Crime in Chula Vista summary. We use data from the FBI to determine the crime rates in Chula Vista. Key points include:
There were 4,130 total crimes in Chula Vista in the last reporting year.
The overall crime rate per 100,000 people in Chula Vista is 1,508.2 / 100k people.
The violent crime rate per 100,000 people in Chula Vista is 375.8 / 100k people.
The property crime rate per 100,000 people in Chula Vista is 1,132.4 / 100k people.
Overall, crime in Chula Vista is -28.83% below the national average.
Total Crimes
Below National Average
Crime In Chula Vista Comparison Table
| Statistic | Count Raw |
Chula Vista / 100k People |
California / 100k People |
National / 100k People |
|---|---|---|---|---|
| Total Crimes Per 100K | 4,130 | 1,508.2 | 2,564.5 | 2,119.2 |
| Violent Crime | 1,029 | 375.8 | 486.0 | 359.0 |
| Murder | 3 | 1.1 | 4.5 | 5.0 |
| Robbery | 225 | 82.2 | 119.1 | 61.0 |
| Aggravated Assault | 748 | 273.1 | 325.8 | 256.0 |
| Property Crime | 3,101 | 1,132.4 | 2,078.4 | 1,760.0 |
| Burglary | 368 | 134.4 | 305.8 | 229.0 |
| Larceny | 1,825 | 666.4 | 1,345.2 | 1,272.0 |
| Car Theft | 908 | 331.6 | 427.5 | 259.0 |
Source: FBI Uniform Crime Reporting (2024)
Cost of living in Chula Vista summary. We use data on the cost of living to determine how expensive it is to live in Chula Vista. Real estate prices drive most of the variance in cost of living around California. Key points include:
The cost of living in Chula Vista is 161 with 100 being average.
The cost of living in Chula Vista is 1.6x higher than the national average.
The median home value in Chula Vista is $846,371.
The median income in Chula Vista is $108,032.
Chula Vista's Overall Cost Of Living
Higher Than The National Average
Cost Of Living In Chula Vista Comparison Table
| Living Expense | Chula Vista | California | National Average |
|---|---|---|---|
| Overall | 161 | 142 | 100 |
| Services | 114 | 110 | 100 |
| Groceries | 119 | 118 | 100 |
| Health | 250 | 197 | 100 |
| Housing | 122 | 120 | 100 |
| Transportation | 120 | 121 | 100 |
| Utilities | 122 | 121 | 100 |
Source: Cost of living index, normalized to US average = 100
Chula Vista, CA Weather
The average high in Chula Vista is 73.0° and the average low is 51.8°.
There are 24.3 days of precipitation each year.
Expect an average of 13.2 inches of precipitation each year with 1.2 inches of snow.
| Stat | Chula Vista |
|---|---|
| Average Annual High | 73.0 |
| Average Annual Low | 51.8 |
| Annual Precipitation Days | 24.3 |
| Average Annual Precipitation | 13.2 |
| Average Annual Snowfall | 1.2 |
Average High
Days of Rain
Source: NOAA climate normals (30-year)
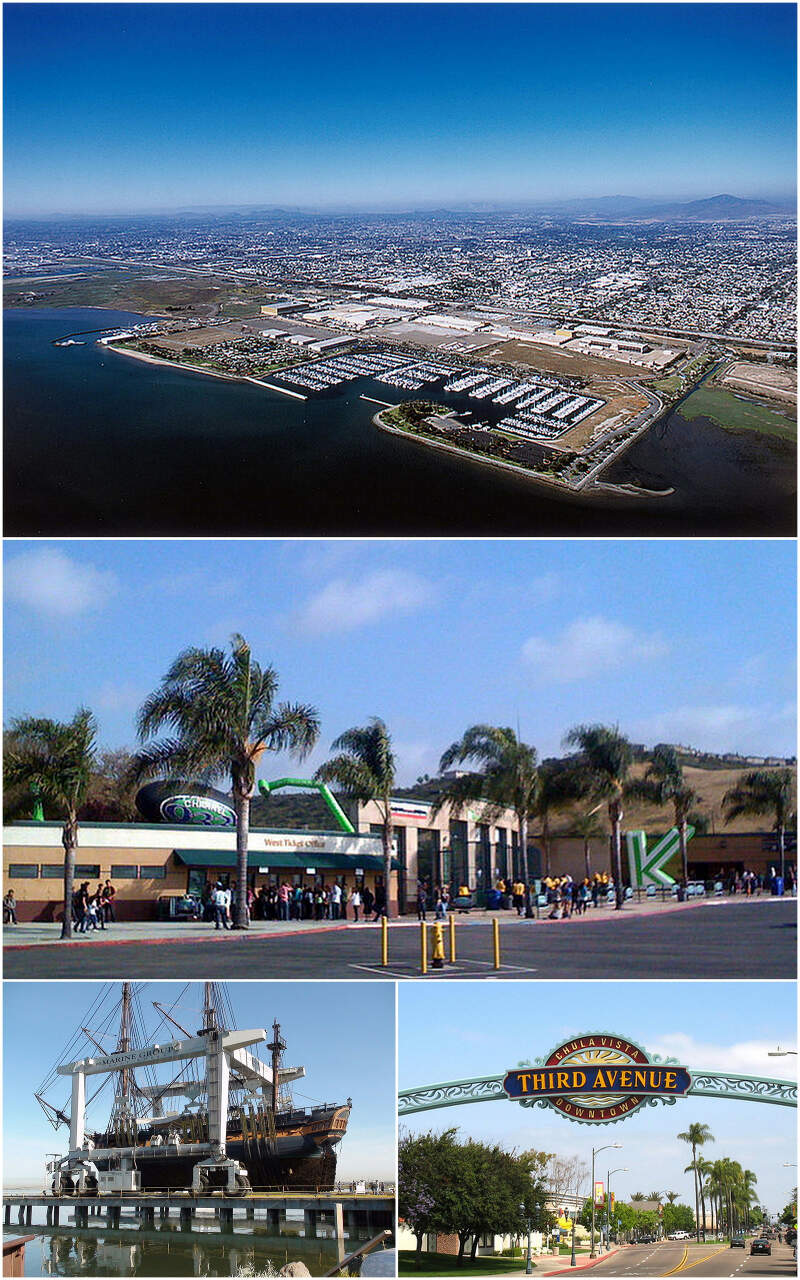
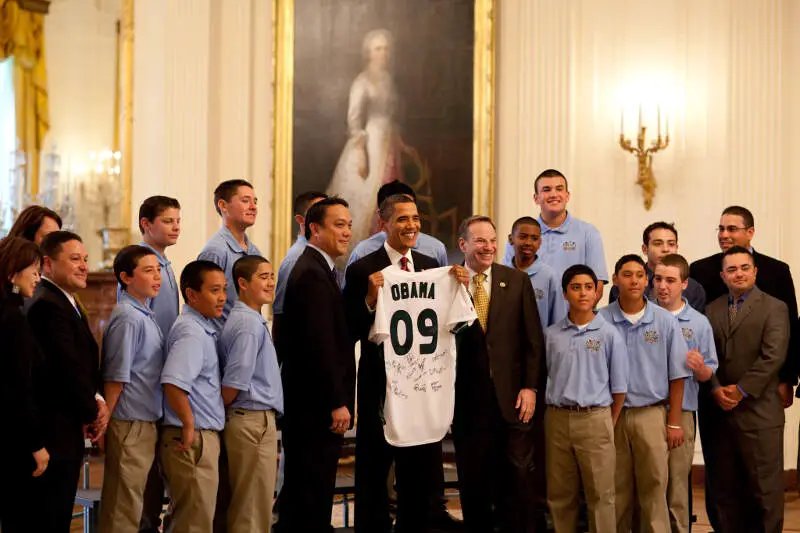
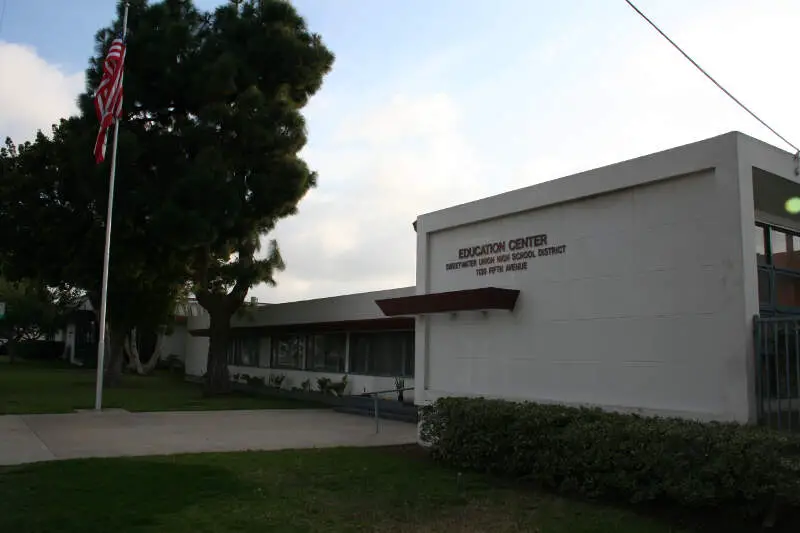
Chula Vista, CA Photos


Rankings & Articles For Chula Vista


Locations Around Chula Vista
Map Of Chula Vista, CA
Best Places Around Chula Vista
Bonita, CA
Population 12,652
Santee, CA
Population 59,332
Rancho San Diego, CA
Population 21,272
Casa de Oro-Mount Helix, CA
Population 19,765
La Presa, CA
Population 34,962
Jamul, CA
Population 6,574
San Diego, CA
Population 1,389,526
Lemon Grove, CA
Population 27,686
Winter Gardens, CA
Population 22,131
Coronado, CA
Population 19,015
Chula Vista Demographics And Statistics
Population over time in Chula Vista
The current population in Chula Vista is 276,375. The population has increased 20.4% from 2010.
| Year | Population | % Change |
|---|---|---|
| 2024 | 276,375 | 0.5% |
| 2023 | 275,030 | -0.4% |
| 2022 | 276,103 | 0.5% |
| 2021 | 274,818 | 2.2% |
| 2020 | 268,779 | -0.1% |
| 2019 | 268,920 | 0.9% |
| 2018 | 266,468 | 0.9% |
| 2017 | 264,101 | 1.3% |
| 2016 | 260,598 | 1.3% |
| 2015 | 257,296 | 1.7% |
| 2014 | 253,031 | 2.0% |
| 2013 | 248,048 | 2.3% |
| 2012 | 242,499 | 2.7% |
| 2011 | 236,218 | 2.9% |
| 2010 | 229,614 | - |
Race / Ethnicity in Chula Vista
See the full breakdown
Chula Vista is:
15.3% White with 42,245 White residents.
4.7% African American with 12,959 African American residents.
0.1% American Indian with 260 American Indian residents.
14.2% Asian with 39,180 Asian residents.
0.3% Hawaiian with 712 Hawaiian residents.
0.5% Other with 1,442 Other residents.
3.9% Two Or More with 10,643 Two Or More residents.
61.1% Hispanic with 168,934 Hispanic residents.
| Race | Chula Vista | CA | USA |
|---|---|---|---|
| White | 15.3% | 33.8% | 57.4% |
| African American | 4.7% | 5.2% | 11.9% |
| American Indian | 0.1% | 0.3% | 0.5% |
| Asian | 14.2% | 15.3% | 5.9% |
| Hawaiian | 0.3% | 0.3% | 0.2% |
| Other | 0.5% | 0.6% | 0.6% |
| Two Or More | 3.9% | 4.4% | 4.3% |
| Hispanic | 61.1% | 40.2% | 19.3% |
Gender in Chula Vista
See the full breakdown
Chula Vista is 50.8% female with 140,464 female residents.
Chula Vista is 49.2% male with 135,911 male residents.
| Gender | Chula Vista | CA | USA |
|---|---|---|---|
| Female | 50.8% | 50.1% | 50.5% |
| Male | 49.2% | 49.9% | 49.5% |
Highest level of educational attainment in Chula Vista for adults over 25
See the full breakdown
7.0% of adults in Chula Vista completed < 9th grade.
7.0% of adults in Chula Vista completed 9-12th grade.
22.0% of adults in Chula Vista completed high school / ged.
22.0% of adults in Chula Vista completed some college.
9.0% of adults in Chula Vista completed associate's degree.
22.0% of adults in Chula Vista completed bachelor's degree.
8.0% of adults in Chula Vista completed master's degree.
2.0% of adults in Chula Vista completed professional degree.
1.0% of adults in Chula Vista completed doctorate degree.
| Education | Chula Vista | CA | USA |
|---|---|---|---|
| < 9th Grade | 7.0% | 8.0% | 4.0% |
| 9-12th Grade | 7.0% | 7.0% | 6.0% |
| High School / GED | 22.0% | 20.0% | 26.0% |
| Some College | 22.0% | 19.0% | 19.0% |
| Associate's Degree | 9.0% | 8.0% | 9.0% |
| Bachelor's Degree | 22.0% | 23.0% | 22.0% |
| Master's Degree | 8.0% | 10.0% | 10.0% |
| Professional Degree | 2.0% | 3.0% | 2.0% |
| Doctorate Degree | 1.0% | 2.0% | 2.0% |
Household Income For Chula Vista, California
See the full breakdown
3.5% of households in Chula Vista earn Less than $10,000.
2.5% of households in Chula Vista earn $10,000 to $14,999.
4.5% of households in Chula Vista earn $15,000 to $24,999.
5.0% of households in Chula Vista earn $25,000 to $34,999.
7.7% of households in Chula Vista earn $35,000 to $49,999.
12.2% of households in Chula Vista earn $50,000 to $74,999.
11.4% of households in Chula Vista earn $75,000 to $99,999.
19.9% of households in Chula Vista earn $100,000 to $149,999.
15.7% of households in Chula Vista earn $150,000 to $199,999.
17.7% of households in Chula Vista earn $200,000 or more.
| Income | Chula Vista | CA | USA |
|---|---|---|---|
| Less than $10,000 | 3.5% | 4.5% | 5.0% |
| $10,000 to $14,999 | 2.5% | 2.9% | 3.4% |
| $15,000 to $24,999 | 4.5% | 5.0% | 6.3% |
| $25,000 to $34,999 | 5.0% | 5.3% | 6.6% |
| $35,000 to $49,999 | 7.7% | 8.1% | 10.1% |
| $50,000 to $74,999 | 12.2% | 13.0% | 15.5% |
| $75,000 to $99,999 | 11.4% | 11.6% | 12.6% |
| $100,000 to $149,999 | 19.9% | 17.8% | 17.5% |
| $150,000 to $199,999 | 15.7% | 11.3% | 9.6% |
| $200,000 or more | 17.7% | 20.5% | 13.4% |
Source: U.S. Census ACS 5-year estimates (2024)


