Yucca Valley SnackAbility
Overall SnackAbility
Crime in Yucca Valley summary. We use data from the FBI to determine the crime rates in Yucca Valley. Key points include:
There were 339 total crimes in Yucca Valley in the last reporting year.
The overall crime rate per 100,000 people in Yucca Valley is 1,567.3 / 100k people.
The violent crime rate per 100,000 people in Yucca Valley is 605.6 / 100k people.
The property crime rate per 100,000 people in Yucca Valley is 961.6 / 100k people.
Overall, crime in Yucca Valley is -26.05% below the national average.
Total Crimes
Below National Average
Crime In Yucca Valley Comparison Table
| Statistic | Count Raw |
Yucca Valley / 100k People |
California / 100k People |
National / 100k People |
|---|---|---|---|---|
| Total Crimes Per 100K | 339 | 1,567.3 | 2,564.5 | 2,119.2 |
| Violent Crime | 131 | 605.6 | 486.0 | 359.0 |
| Murder | 2 | 9.2 | 4.5 | 5.0 |
| Robbery | 14 | 64.7 | 119.1 | 61.0 |
| Aggravated Assault | 103 | 476.2 | 325.8 | 256.0 |
| Property Crime | 208 | 961.6 | 2,078.4 | 1,760.0 |
| Burglary | 60 | 277.4 | 305.8 | 229.0 |
| Larceny | 108 | 499.3 | 1,345.2 | 1,272.0 |
| Car Theft | 40 | 184.9 | 427.5 | 259.0 |
Source: FBI Uniform Crime Reporting (2024)
Cost of living in Yucca Valley summary. We use data on the cost of living to determine how expensive it is to live in Yucca Valley. Real estate prices drive most of the variance in cost of living around California. Key points include:
The cost of living in Yucca Valley is 114 with 100 being average.
The cost of living in Yucca Valley is 1.1x higher than the national average.
The median home value in Yucca Valley is $358,163.
The median income in Yucca Valley is $59,563.
Yucca Valley's Overall Cost Of Living
Higher Than The National Average
Cost Of Living In Yucca Valley Comparison Table
| Living Expense | Yucca Valley | California | National Average |
|---|---|---|---|
| Overall | 114 | 142 | 100 |
| Services | 108 | 110 | 100 |
| Groceries | 111 | 118 | 100 |
| Health | 108 | 197 | 100 |
| Housing | 116 | 120 | 100 |
| Transportation | 115 | 121 | 100 |
| Utilities | 122 | 121 | 100 |
Source: Cost of living index, normalized to US average = 100
Yucca Valley, CA Weather
The average high in Yucca Valley is 76.0° and the average low is 48.8°.
There are 22.0 days of precipitation each year.
Expect an average of 14.2 inches of precipitation each year with 9.0 inches of snow.
| Stat | Yucca Valley |
|---|---|
| Average Annual High | 76.0 |
| Average Annual Low | 48.8 |
| Annual Precipitation Days | 22.0 |
| Average Annual Precipitation | 14.2 |
| Average Annual Snowfall | 9.0 |
Average High
Days of Rain
Source: NOAA climate normals (30-year)
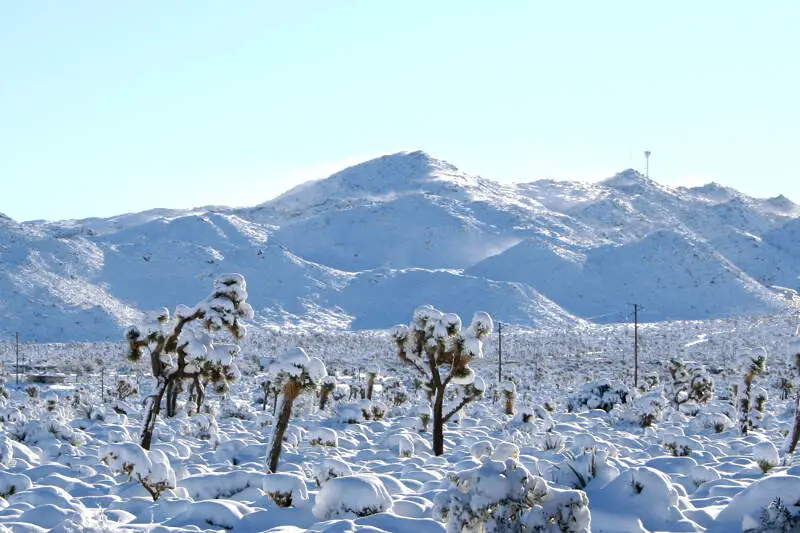
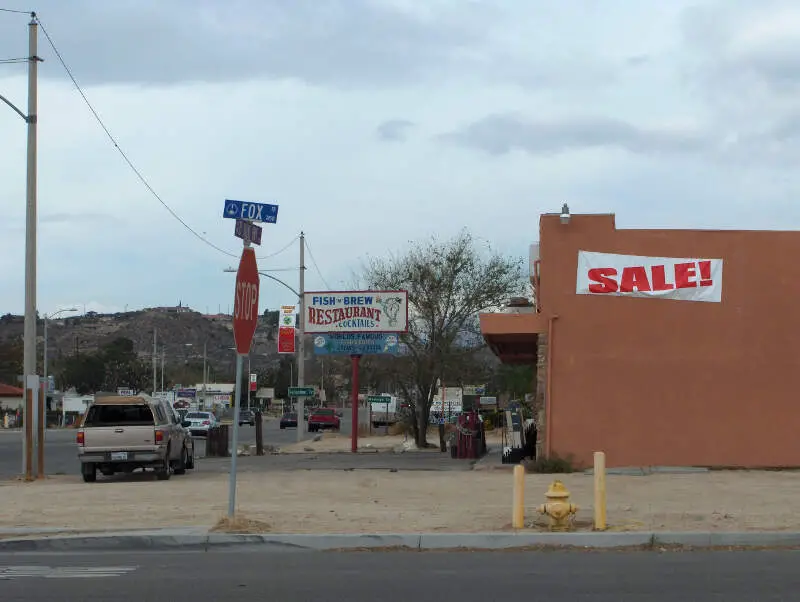
Yucca Valley, CA Photos
1 Reviews & Comments About Yucca Valley

Opinions mean little. Every place you live has its good and bad characteristics. Who you are is much more important than where you live. I have lived in Yucca Valley, West Modesto, Fresno, Palm Springs, Palm Desert, La Quinta, Aptos, and Hayward.
I really loved Yucca Valley because of the weather, the clean air, the small town feel, the music, the proximity to the lower desert for work, and some of the stores.
The crime is low, the shopping is close, the people are very friendly. I love the neighborhood where I live. We had a big neighborhood potluck in May and it was really very, very fun.
Rankings & Articles For Yucca Valley


Locations Around Yucca Valley
Map Of Yucca Valley, CA
Best Places Around Yucca Valley
Loma Linda, CA
Population 25,122
Desert Palms, CA
Population 6,579
Redlands, CA
Population 73,375
Palm Desert, CA
Population 51,990
Highland, CA
Population 56,675
La Quinta, CA
Population 38,707
Yucaipa, CA
Population 54,421
Twentynine Palms, CA
Population 27,355
Cherry Valley, CA
Population 6,668
Rancho Mirage, CA
Population 17,563
Yucca Valley Demographics And Statistics
Population over time in Yucca Valley
The current population in Yucca Valley is 21,770. The population has increased 7.3% from 2010.
| Year | Population | % Change |
|---|---|---|
| 2024 | 21,770 | 0.1% |
| 2023 | 21,744 | 0.2% |
| 2022 | 21,700 | 0.2% |
| 2021 | 21,663 | -0.2% |
| 2020 | 21,701 | 0.4% |
| 2019 | 21,622 | 0.4% |
| 2018 | 21,543 | 0.3% |
| 2017 | 21,483 | 0.6% |
| 2016 | 21,362 | 0.5% |
| 2015 | 21,258 | 0.8% |
| 2014 | 21,083 | 1.0% |
| 2013 | 20,864 | 0.7% |
| 2012 | 20,712 | 1.0% |
| 2011 | 20,508 | 1.1% |
| 2010 | 20,290 | - |
Race / Ethnicity in Yucca Valley
See the full breakdown
Yucca Valley is:
64.8% White with 14,101 White residents.
0.7% African American with 150 African American residents.
1.0% American Indian with 222 American Indian residents.
1.9% Asian with 408 Asian residents.
0.5% Hawaiian with 110 Hawaiian residents.
1.2% Other with 264 Other residents.
9.2% Two Or More with 2,004 Two Or More residents.
20.7% Hispanic with 4,511 Hispanic residents.
| Race | Yucca Valley | CA | USA |
|---|---|---|---|
| White | 64.8% | 33.8% | 57.4% |
| African American | 0.7% | 5.2% | 11.9% |
| American Indian | 1.0% | 0.3% | 0.5% |
| Asian | 1.9% | 15.3% | 5.9% |
| Hawaiian | 0.5% | 0.3% | 0.2% |
| Other | 1.2% | 0.6% | 0.6% |
| Two Or More | 9.2% | 4.4% | 4.3% |
| Hispanic | 20.7% | 40.2% | 19.3% |
Gender in Yucca Valley
See the full breakdown
Yucca Valley is 51.9% female with 11,305 female residents.
Yucca Valley is 48.1% male with 10,465 male residents.
| Gender | Yucca Valley | CA | USA |
|---|---|---|---|
| Female | 51.9% | 50.1% | 50.5% |
| Male | 48.1% | 49.9% | 49.5% |
Highest level of educational attainment in Yucca Valley for adults over 25
See the full breakdown
3.0% of adults in Yucca Valley completed < 9th grade.
6.0% of adults in Yucca Valley completed 9-12th grade.
30.0% of adults in Yucca Valley completed high school / ged.
32.0% of adults in Yucca Valley completed some college.
7.0% of adults in Yucca Valley completed associate's degree.
15.0% of adults in Yucca Valley completed bachelor's degree.
6.0% of adults in Yucca Valley completed master's degree.
0.0% of adults in Yucca Valley completed professional degree.
1.0% of adults in Yucca Valley completed doctorate degree.
| Education | Yucca Valley | CA | USA |
|---|---|---|---|
| < 9th Grade | 3.0% | 8.0% | 4.0% |
| 9-12th Grade | 6.0% | 7.0% | 6.0% |
| High School / GED | 30.0% | 20.0% | 26.0% |
| Some College | 32.0% | 19.0% | 19.0% |
| Associate's Degree | 7.0% | 8.0% | 9.0% |
| Bachelor's Degree | 15.0% | 23.0% | 22.0% |
| Master's Degree | 6.0% | 10.0% | 10.0% |
| Professional Degree | 0.0% | 3.0% | 2.0% |
| Doctorate Degree | 1.0% | 2.0% | 2.0% |
Household Income For Yucca Valley, California
See the full breakdown
3.4% of households in Yucca Valley earn Less than $10,000.
6.2% of households in Yucca Valley earn $10,000 to $14,999.
10.2% of households in Yucca Valley earn $15,000 to $24,999.
5.4% of households in Yucca Valley earn $25,000 to $34,999.
18.2% of households in Yucca Valley earn $35,000 to $49,999.
15.8% of households in Yucca Valley earn $50,000 to $74,999.
11.6% of households in Yucca Valley earn $75,000 to $99,999.
14.6% of households in Yucca Valley earn $100,000 to $149,999.
10.0% of households in Yucca Valley earn $150,000 to $199,999.
4.6% of households in Yucca Valley earn $200,000 or more.
| Income | Yucca Valley | CA | USA |
|---|---|---|---|
| Less than $10,000 | 3.4% | 4.5% | 5.0% |
| $10,000 to $14,999 | 6.2% | 2.9% | 3.4% |
| $15,000 to $24,999 | 10.2% | 5.0% | 6.3% |
| $25,000 to $34,999 | 5.4% | 5.3% | 6.6% |
| $35,000 to $49,999 | 18.2% | 8.1% | 10.1% |
| $50,000 to $74,999 | 15.8% | 13.0% | 15.5% |
| $75,000 to $99,999 | 11.6% | 11.6% | 12.6% |
| $100,000 to $149,999 | 14.6% | 17.8% | 17.5% |
| $150,000 to $199,999 | 10.0% | 11.3% | 9.6% |
| $200,000 or more | 4.6% | 20.5% | 13.4% |
Source: U.S. Census ACS 5-year estimates (2024)


