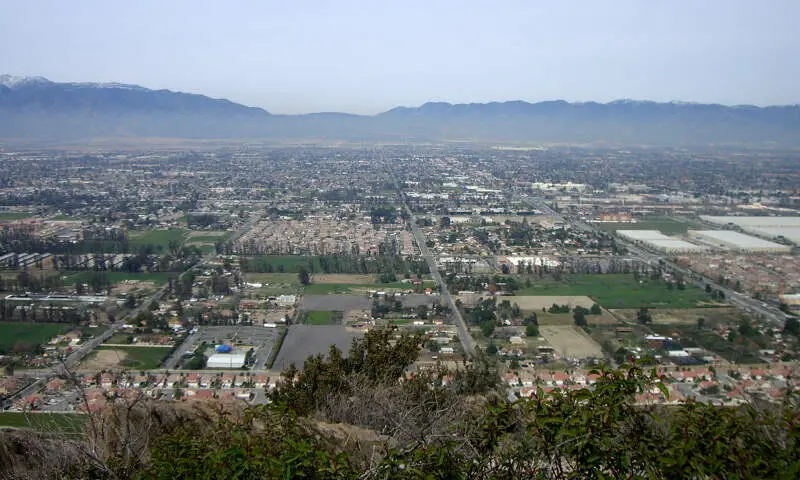
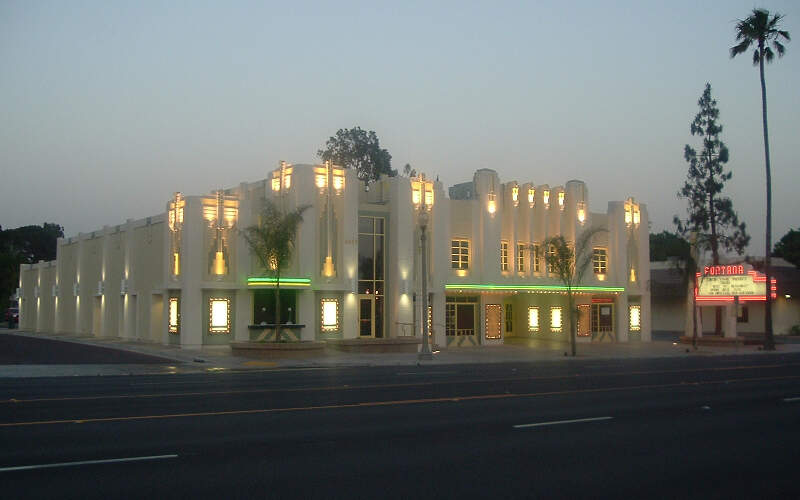
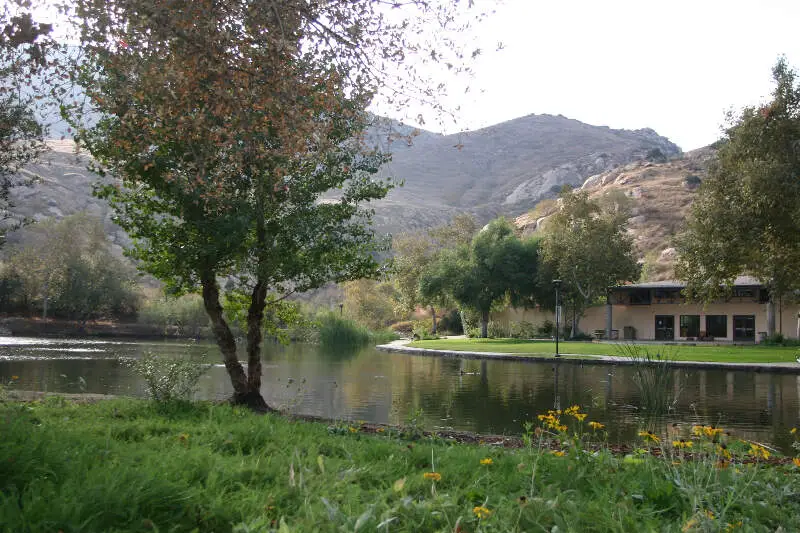
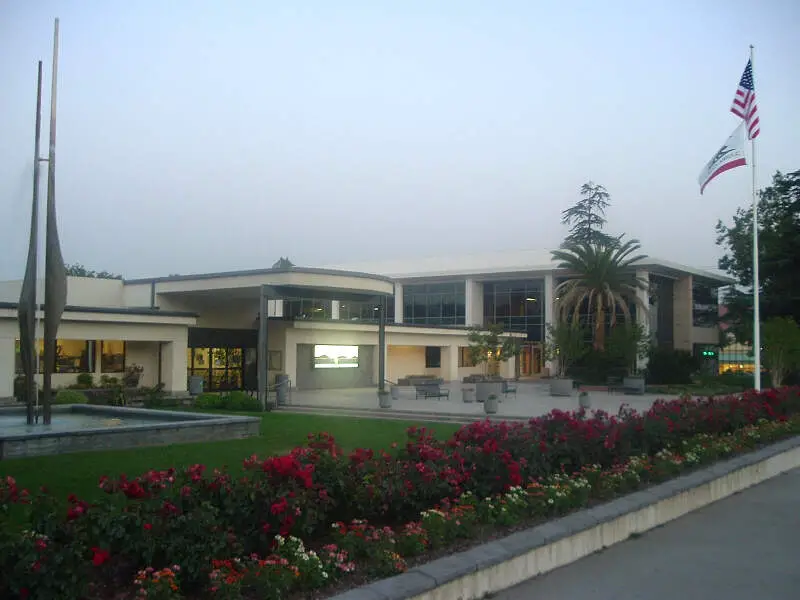
Fontana, CA
Demographics And Statistics
Living In Fontana, California Summary
Life in Fontana research summary. HomeSnacks has been using Saturday Night Science to research the quality of life in Fontana over the past nine years using Census, FBI, Zillow, and other primary data sources. Based on the most recently available data, we found the following about life in Fontana:
The population in Fontana is 211,921.
The median home value in Fontana is $631,751.
The median income in Fontana is $98,187.
The cost of living in Fontana is 135 which is 1.4x higher than the national average.
The median rent in Fontana is $1,733.
The unemployment rate in Fontana is 6.8%.
The poverty rate in Fontana is 10.3%.
The average high in Fontana is 76.0° and the average low is 48.8°.
Fontana SnackAbility
Overall SnackAbility
Fontana, CA Crime Report
Crime in Fontana summary. We use data from the FBI to determine the crime rates in Fontana. Key points include:
There were 3,235 total crimes in Fontana in the last reporting year.
The overall crime rate per 100,000 people in Fontana is 1,486.6 / 100k people.
The violent crime rate per 100,000 people in Fontana is 270.2 / 100k people.
The property crime rate per 100,000 people in Fontana is 1,216.4 / 100k people.
Overall, crime in Fontana is -29.85% below the national average.
Total Crimes
Below National Average
Crime In Fontana Comparison Table
| Statistic | Count Raw |
Fontana / 100k People |
California / 100k People |
National / 100k People |
|---|---|---|---|---|
| Total Crimes Per 100K | 3,235 | 1,486.6 | 2,564.5 | 2,119.2 |
| Violent Crime | 588 | 270.2 | 486.0 | 359.0 |
| Murder | 2 | 0.9 | 4.5 | 5.0 |
| Robbery | 122 | 56.1 | 119.1 | 61.0 |
| Aggravated Assault | 416 | 191.2 | 325.8 | 256.0 |
| Property Crime | 2,647 | 1,216.4 | 2,078.4 | 1,760.0 |
| Burglary | 319 | 146.6 | 305.8 | 229.0 |
| Larceny | 1,728 | 794.1 | 1,345.2 | 1,272.0 |
| Car Theft | 600 | 275.7 | 427.5 | 259.0 |
Fontana, CA Cost Of Living
Cost of living in Fontana summary. We use data on the cost of living to determine how expensive it is to live in Fontana. Real estate prices drive most of the variance in cost of living around California. Key points include:
The cost of living in Fontana is 135 with 100 being average.
The cost of living in Fontana is 1.4x higher than the national average.
The median home value in Fontana is $631,751.
The median income in Fontana is $98,187.
Fontana's Overall Cost Of Living
Higher Than The National Average
Cost Of Living In Fontana Comparison Table
| Living Expense | Fontana | California | National Average | |
|---|---|---|---|---|
| Overall | 135 | 141 | 100 | |
| Services | 113 | 110 | 100 | |
| Groceries | 114 | 112 | 100 | |
| Health | 98 | 110 | 100 | |
| Housing | 194 | 195 | 100 | |
| Transportation | 124 | 125 | 100 | |
| Utilities | 96 | 128 | 100 | |
Fontana, CA Weather
The average high in Fontana is 76.0° and the average low is 48.8°.
There are 22.0 days of precipitation each year.
Expect an average of 14.2 inches of precipitation each year with 9.0 inches of snow.
| Stat | Fontana |
|---|---|
| Average Annual High | 76.0 |
| Average Annual Low | 48.8 |
| Annual Precipitation Days | 22.0 |
| Average Annual Precipitation | 14.2 |
| Average Annual Snowfall | 9.0 |
Average High
Days of Rain
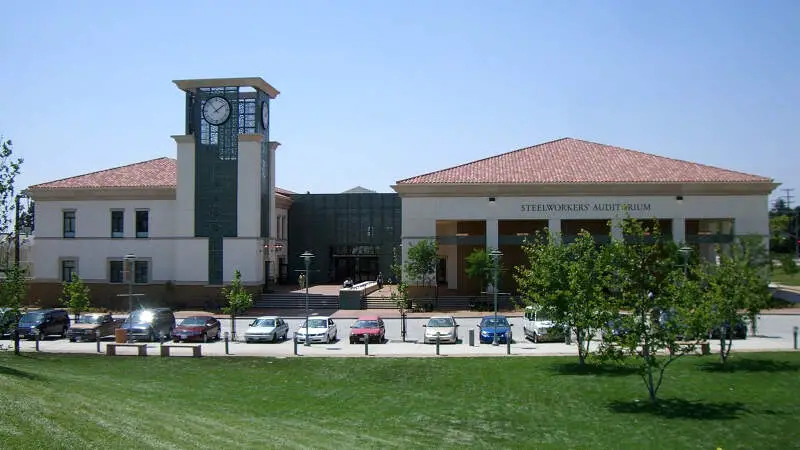
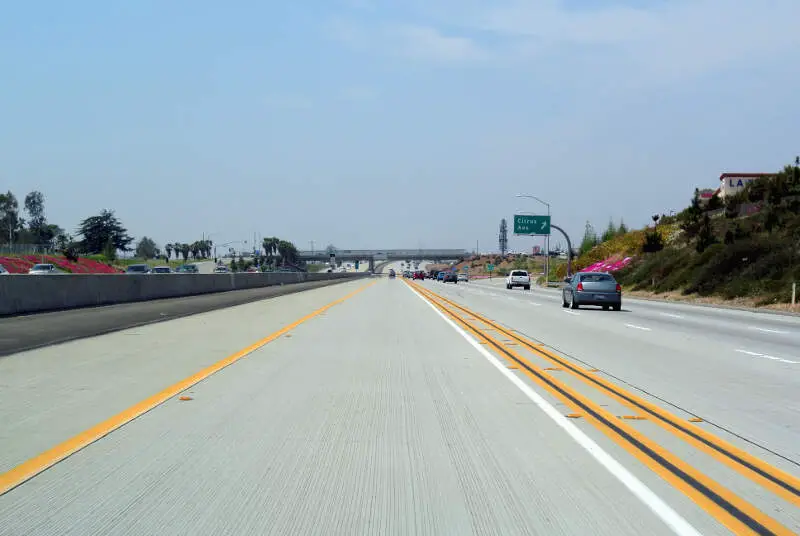
Fontana, CA Photos
Rankings for Fontana in California


Locations Around Fontana
Map Of Fontana, CA
Best Places Around Fontana
La Verne, CA
Population 30,804
Claremont, CA
Population 36,553
Rancho Cucamonga, CA
Population 174,693
Grand Terrace, CA
Population 13,069
San Dimas, CA
Population 34,099
Chino Hills, CA
Population 78,024
Eastvale, CA
Population 70,179
Corona, CA
Population 158,839
El Cerrito, CA
Population 25,781
Home Gardens, CA
Population 11,430
Fontana Demographics And Statistics
Population over time in Fontana
The current population in Fontana is 211,921. The population has increased 11.9% from 2010.
| Year | Population | % Change |
|---|---|---|
| 2023 | 211,921 | 1.3% |
| 2022 | 209,279 | 0.6% |
| 2021 | 208,087 | -2.2% |
| 2020 | 212,704 | 0.9% |
| 2019 | 210,759 | 0.9% |
| 2018 | 208,943 | 0.9% |
| 2017 | 207,086 | 0.9% |
| 2016 | 205,228 | 0.8% |
| 2015 | 203,677 | 1.2% |
| 2014 | 201,355 | 1.3% |
| 2013 | 198,692 | 1.3% |
| 2012 | 196,129 | 1.7% |
| 2011 | 192,779 | 1.7% |
| 2010 | 189,466 | - |
Race / Ethnicity in Fontana
Fontana is:
12.5% White with 26,454 White residents.
8.2% African American with 17,300 African American residents.
0.3% American Indian with 559 American Indian residents.
8.0% Asian with 16,872 Asian residents.
0.1% Hawaiian with 299 Hawaiian residents.
0.5% Other with 955 Other residents.
2.7% Two Or More with 5,657 Two Or More residents.
67.9% Hispanic with 143,825 Hispanic residents.
| Race | Fontana | CA | USA |
|---|---|---|---|
| White | 12.5% | 34.6% | 58.2% |
| African American | 8.2% | 5.3% | 12.0% |
| American Indian | 0.3% | 0.3% | 0.5% |
| Asian | 8.0% | 15.1% | 5.7% |
| Hawaiian | 0.1% | 0.3% | 0.2% |
| Other | 0.5% | 0.5% | 0.5% |
| Two Or More | 2.7% | 4.1% | 3.9% |
| Hispanic | 67.9% | 39.8% | 19.0% |
Gender in Fontana
Fontana is 49.4% female with 104,656 female residents.
Fontana is 50.6% male with 107,265 male residents.
| Gender | Fontana | CA | USA |
|---|---|---|---|
| Female | 49.4% | 50.0% | 50.5% |
| Male | 50.6% | 50.0% | 49.5% |
Highest level of educational attainment in Fontana for adults over 25
10.0% of adults in Fontana completed < 9th grade.
10.0% of adults in Fontana completed 9-12th grade.
30.0% of adults in Fontana completed high school / ged.
22.0% of adults in Fontana completed some college.
7.0% of adults in Fontana completed associate's degree.
15.0% of adults in Fontana completed bachelor's degree.
5.0% of adults in Fontana completed master's degree.
1.0% of adults in Fontana completed professional degree.
0.0% of adults in Fontana completed doctorate degree.
| Education | Fontana | CA | USA |
|---|---|---|---|
| < 9th Grade | 10.0% | 8.0% | 5.0% |
| 9-12th Grade | 10.0% | 7.0% | 6.0% |
| High School / GED | 30.0% | 20.0% | 26.0% |
| Some College | 22.0% | 20.0% | 19.0% |
| Associate's Degree | 7.0% | 8.0% | 9.0% |
| Bachelor's Degree | 15.0% | 22.0% | 21.0% |
| Master's Degree | 5.0% | 10.0% | 10.0% |
| Professional Degree | 1.0% | 3.0% | 2.0% |
| Doctorate Degree | 0.0% | 2.0% | 2.0% |
Household Income For Fontana, California
2.3% of households in Fontana earn Less than $10,000.
2.2% of households in Fontana earn $10,000 to $14,999.
4.7% of households in Fontana earn $15,000 to $24,999.
5.7% of households in Fontana earn $25,000 to $34,999.
7.4% of households in Fontana earn $35,000 to $49,999.
13.5% of households in Fontana earn $50,000 to $74,999.
15.0% of households in Fontana earn $75,000 to $99,999.
22.6% of households in Fontana earn $100,000 to $149,999.
14.0% of households in Fontana earn $150,000 to $199,999.
12.5% of households in Fontana earn $200,000 or more.
| Income | Fontana | CA | USA |
|---|---|---|---|
| Less than $10,000 | 2.3% | 4.4% | 4.9% |
| $10,000 to $14,999 | 2.2% | 3.0% | 3.6% |
| $15,000 to $24,999 | 4.7% | 5.2% | 6.6% |
| $25,000 to $34,999 | 5.7% | 5.5% | 6.8% |
| $35,000 to $49,999 | 7.4% | 8.4% | 10.4% |
| $50,000 to $74,999 | 13.5% | 13.3% | 15.7% |
| $75,000 to $99,999 | 15.0% | 11.8% | 12.7% |
| $100,000 to $149,999 | 22.6% | 17.9% | 17.4% |
| $150,000 to $199,999 | 14.0% | 11.1% | 9.3% |
| $200,000 or more | 12.5% | 19.4% | 12.6% |


