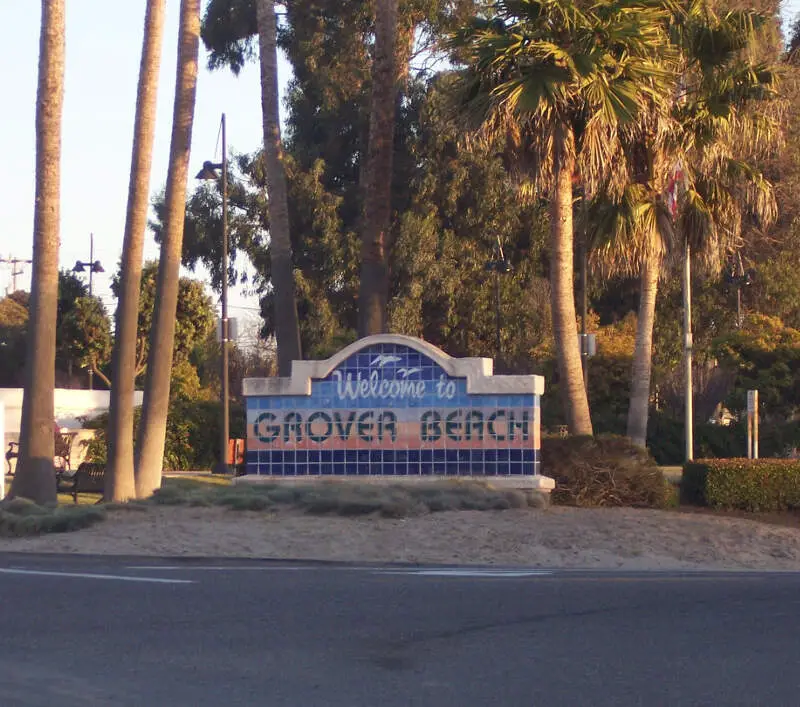
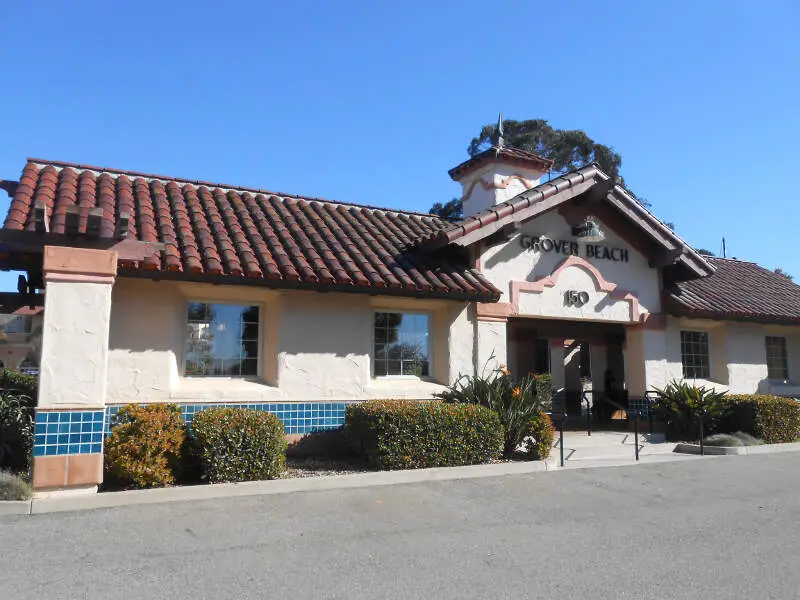
Grover Beach, CA
Demographics And Statistics
Living In Grover Beach, California Summary
Life in Grover Beach research summary. HomeSnacks has been using Saturday Night Science to research the quality of life in Grover Beach over the past nine years using Census, FBI, Zillow, and other primary data sources. Based on the most recently available data, we found the following about life in Grover Beach:
The population in Grover Beach is 12,687.
The median home value in Grover Beach is $758,661.
The median income in Grover Beach is $82,534.
The cost of living in Grover Beach is 157 which is 1.6x higher than the national average.
The median rent in Grover Beach is $1,921.
The unemployment rate in Grover Beach is 3.4%.
The poverty rate in Grover Beach is 12.7%.
The average high in Grover Beach is 70.3° and the average low is 46.2°.
Grover Beach SnackAbility
Overall SnackAbility
Grover Beach, CA Crime Report
Crime in Grover Beach summary. We use data from the FBI to determine the crime rates in Grover Beach. Key points include:
There were 185 total crimes in Grover Beach in the last reporting year.
The overall crime rate per 100,000 people in Grover Beach is 1,480.5 / 100k people.
The violent crime rate per 100,000 people in Grover Beach is 320.1 / 100k people.
The property crime rate per 100,000 people in Grover Beach is 1,160.4 / 100k people.
Overall, crime in Grover Beach is -30.14% below the national average.
Total Crimes
Below National Average
Crime In Grover Beach Comparison Table
| Statistic | Count Raw |
Grover Beach / 100k People |
California / 100k People |
National / 100k People |
|---|---|---|---|---|
| Total Crimes Per 100K | 185 | 1,480.5 | 2,564.5 | 2,119.2 |
| Violent Crime | 40 | 320.1 | 486.0 | 359.0 |
| Murder | 0 | 0.0 | 4.5 | 5.0 |
| Robbery | 2 | 16.0 | 119.1 | 61.0 |
| Aggravated Assault | 30 | 240.1 | 325.8 | 256.0 |
| Property Crime | 145 | 1,160.4 | 2,078.4 | 1,760.0 |
| Burglary | 16 | 128.0 | 305.8 | 229.0 |
| Larceny | 124 | 992.3 | 1,345.2 | 1,272.0 |
| Car Theft | 5 | 40.0 | 427.5 | 259.0 |
Grover Beach, CA Cost Of Living
Cost of living in Grover Beach summary. We use data on the cost of living to determine how expensive it is to live in Grover Beach. Real estate prices drive most of the variance in cost of living around California. Key points include:
The cost of living in Grover Beach is 157 with 100 being average.
The cost of living in Grover Beach is 1.6x higher than the national average.
The median home value in Grover Beach is $758,661.
The median income in Grover Beach is $82,534.
Grover Beach's Overall Cost Of Living
Higher Than The National Average
Cost Of Living In Grover Beach Comparison Table
| Living Expense | Grover Beach | California | National Average | |
|---|---|---|---|---|
| Overall | 157 | 141 | 100 | |
| Services | 105 | 110 | 100 | |
| Groceries | 106 | 112 | 100 | |
| Health | 91 | 110 | 100 | |
| Housing | 250 | 195 | 100 | |
| Transportation | 128 | 125 | 100 | |
| Utilities | 156 | 128 | 100 | |
Grover Beach, CA Weather
The average high in Grover Beach is 70.3° and the average low is 46.2°.
There are 31.0 days of precipitation each year.
Expect an average of 18.2 inches of precipitation each year with 0.0 inches of snow.
| Stat | Grover Beach |
|---|---|
| Average Annual High | 70.3 |
| Average Annual Low | 46.2 |
| Annual Precipitation Days | 31.0 |
| Average Annual Precipitation | 18.2 |
| Average Annual Snowfall | 0.0 |
Average High
Days of Rain
Grover Beach, CA Photos
Rankings for Grover Beach in California


Locations Around Grover Beach
Map Of Grover Beach, CA
Best Places Around Grover Beach
Guadalupe, CA
Population 8,422
Nipomo, CA
Population 17,266
Los Osos, CA
Population 15,048
San Luis Obispo, CA
Population 48,039
Arroyo Grande, CA
Population 18,412
Oceano, CA
Population 7,098
Santa Maria, CA
Population 109,880
Pismo Beach, CA
Population 8,024
Grover Beach Demographics And Statistics
Population over time in Grover Beach
The current population in Grover Beach is 12,687. The population has decreased -3.4% from 2010.
| Year | Population | % Change |
|---|---|---|
| 2023 | 12,687 | -0.5% |
| 2022 | 12,757 | -0.7% |
| 2021 | 12,846 | -4.7% |
| 2020 | 13,481 | -0.4% |
| 2019 | 13,535 | -0.0% |
| 2018 | 13,538 | 0.1% |
| 2017 | 13,524 | 0.3% |
| 2016 | 13,484 | 0.6% |
| 2015 | 13,409 | 0.5% |
| 2014 | 13,337 | 0.6% |
| 2013 | 13,253 | 0.4% |
| 2012 | 13,194 | 0.1% |
| 2011 | 13,175 | 0.3% |
| 2010 | 13,137 | - |
Race / Ethnicity in Grover Beach
Grover Beach is:
55.1% White with 6,993 White residents.
1.0% African American with 133 African American residents.
0.1% American Indian with 13 American Indian residents.
2.1% Asian with 265 Asian residents.
0.4% Hawaiian with 48 Hawaiian residents.
0.5% Other with 68 Other residents.
2.8% Two Or More with 355 Two Or More residents.
37.9% Hispanic with 4,812 Hispanic residents.
| Race | Grover Beach | CA | USA |
|---|---|---|---|
| White | 55.1% | 34.6% | 58.2% |
| African American | 1.0% | 5.3% | 12.0% |
| American Indian | 0.1% | 0.3% | 0.5% |
| Asian | 2.1% | 15.1% | 5.7% |
| Hawaiian | 0.4% | 0.3% | 0.2% |
| Other | 0.5% | 0.5% | 0.5% |
| Two Or More | 2.8% | 4.1% | 3.9% |
| Hispanic | 37.9% | 39.8% | 19.0% |
Gender in Grover Beach
Grover Beach is 49.2% female with 6,237 female residents.
Grover Beach is 50.8% male with 6,450 male residents.
| Gender | Grover Beach | CA | USA |
|---|---|---|---|
| Female | 49.2% | 50.0% | 50.5% |
| Male | 50.8% | 50.0% | 49.5% |
Highest level of educational attainment in Grover Beach for adults over 25
8.0% of adults in Grover Beach completed < 9th grade.
9.0% of adults in Grover Beach completed 9-12th grade.
27.0% of adults in Grover Beach completed high school / ged.
20.0% of adults in Grover Beach completed some college.
9.0% of adults in Grover Beach completed associate's degree.
15.0% of adults in Grover Beach completed bachelor's degree.
6.0% of adults in Grover Beach completed master's degree.
4.0% of adults in Grover Beach completed professional degree.
2.0% of adults in Grover Beach completed doctorate degree.
| Education | Grover Beach | CA | USA |
|---|---|---|---|
| < 9th Grade | 8.0% | 8.0% | 5.0% |
| 9-12th Grade | 9.0% | 7.0% | 6.0% |
| High School / GED | 27.0% | 20.0% | 26.0% |
| Some College | 20.0% | 20.0% | 19.0% |
| Associate's Degree | 9.0% | 8.0% | 9.0% |
| Bachelor's Degree | 15.0% | 22.0% | 21.0% |
| Master's Degree | 6.0% | 10.0% | 10.0% |
| Professional Degree | 4.0% | 3.0% | 2.0% |
| Doctorate Degree | 2.0% | 2.0% | 2.0% |
Household Income For Grover Beach, California
3.7% of households in Grover Beach earn Less than $10,000.
3.8% of households in Grover Beach earn $10,000 to $14,999.
6.0% of households in Grover Beach earn $15,000 to $24,999.
4.3% of households in Grover Beach earn $25,000 to $34,999.
11.9% of households in Grover Beach earn $35,000 to $49,999.
18.7% of households in Grover Beach earn $50,000 to $74,999.
11.0% of households in Grover Beach earn $75,000 to $99,999.
21.2% of households in Grover Beach earn $100,000 to $149,999.
9.3% of households in Grover Beach earn $150,000 to $199,999.
10.1% of households in Grover Beach earn $200,000 or more.
| Income | Grover Beach | CA | USA |
|---|---|---|---|
| Less than $10,000 | 3.7% | 4.4% | 4.9% |
| $10,000 to $14,999 | 3.8% | 3.0% | 3.6% |
| $15,000 to $24,999 | 6.0% | 5.2% | 6.6% |
| $25,000 to $34,999 | 4.3% | 5.5% | 6.8% |
| $35,000 to $49,999 | 11.9% | 8.4% | 10.4% |
| $50,000 to $74,999 | 18.7% | 13.3% | 15.7% |
| $75,000 to $99,999 | 11.0% | 11.8% | 12.7% |
| $100,000 to $149,999 | 21.2% | 17.9% | 17.4% |
| $150,000 to $199,999 | 9.3% | 11.1% | 9.3% |
| $200,000 or more | 10.1% | 19.4% | 12.6% |


