Hemet, CA
Demographics And Statistics
Living In Hemet, California Summary
Life in Hemet research summary. HomeSnacks has been using Saturday Night Science to research the quality of life in Hemet over the past nine years using Census, FBI, Zillow, and other primary data sources. Based on the most recently available data, we found the following about life in Hemet:
The population in Hemet is 90,646.
The median home value in Hemet is $440,359.
The median income in Hemet is $53,623.
The cost of living in Hemet is 113 which is 1.1x higher than the national average.
The median rent in Hemet is $1,432.
The unemployment rate in Hemet is 8.3%.
The poverty rate in Hemet is 16.0%.
The average high in Hemet is 81.2° and the average low is 52.0°.
Hemet SnackAbility
Overall SnackAbility
Hemet, CA Crime Report
Crime in Hemet summary. We use data from the FBI to determine the crime rates in Hemet. Key points include:
There were 1,919 total crimes in Hemet in the last reporting year.
The overall crime rate per 100,000 people in Hemet is 2,058.7 / 100k people.
The violent crime rate per 100,000 people in Hemet is 424.8 / 100k people.
The property crime rate per 100,000 people in Hemet is 1,633.9 / 100k people.
Overall, crime in Hemet is -2.85% below the national average.
Total Crimes
Below National Average
Crime In Hemet Comparison Table
| Statistic | Count Raw |
Hemet / 100k People |
California / 100k People |
National / 100k People |
|---|---|---|---|---|
| Total Crimes Per 100K | 1,919 | 2,058.7 | 2,564.5 | 2,119.2 |
| Violent Crime | 396 | 424.8 | 486.0 | 359.0 |
| Murder | 4 | 4.3 | 4.5 | 5.0 |
| Robbery | 92 | 98.7 | 119.1 | 61.0 |
| Aggravated Assault | 267 | 286.4 | 325.8 | 256.0 |
| Property Crime | 1,523 | 1,633.9 | 2,078.4 | 1,760.0 |
| Burglary | 158 | 169.5 | 305.8 | 229.0 |
| Larceny | 1,135 | 1,217.7 | 1,345.2 | 1,272.0 |
| Car Theft | 230 | 246.7 | 427.5 | 259.0 |
Hemet, CA Cost Of Living
Cost of living in Hemet summary. We use data on the cost of living to determine how expensive it is to live in Hemet. Real estate prices drive most of the variance in cost of living around California. Key points include:
The cost of living in Hemet is 113 with 100 being average.
The cost of living in Hemet is 1.1x higher than the national average.
The median home value in Hemet is $440,359.
The median income in Hemet is $53,623.
Hemet's Overall Cost Of Living
Higher Than The National Average
Cost Of Living In Hemet Comparison Table
| Living Expense | Hemet | California | National Average | |
|---|---|---|---|---|
| Overall | 113 | 141 | 100 | |
| Services | 113 | 110 | 100 | |
| Groceries | 114 | 112 | 100 | |
| Health | 98 | 110 | 100 | |
| Housing | 119 | 195 | 100 | |
| Transportation | 124 | 125 | 100 | |
| Utilities | 94 | 128 | 100 | |
Hemet, CA Weather
The average high in Hemet is 81.2° and the average low is 52.0°.
There are 18.0 days of precipitation each year.
Expect an average of 10.0 inches of precipitation each year with 1.7 inches of snow.
| Stat | Hemet |
|---|---|
| Average Annual High | 81.2 |
| Average Annual Low | 52.0 |
| Annual Precipitation Days | 18.0 |
| Average Annual Precipitation | 10.0 |
| Average Annual Snowfall | 1.7 |
Average High
Days of Rain
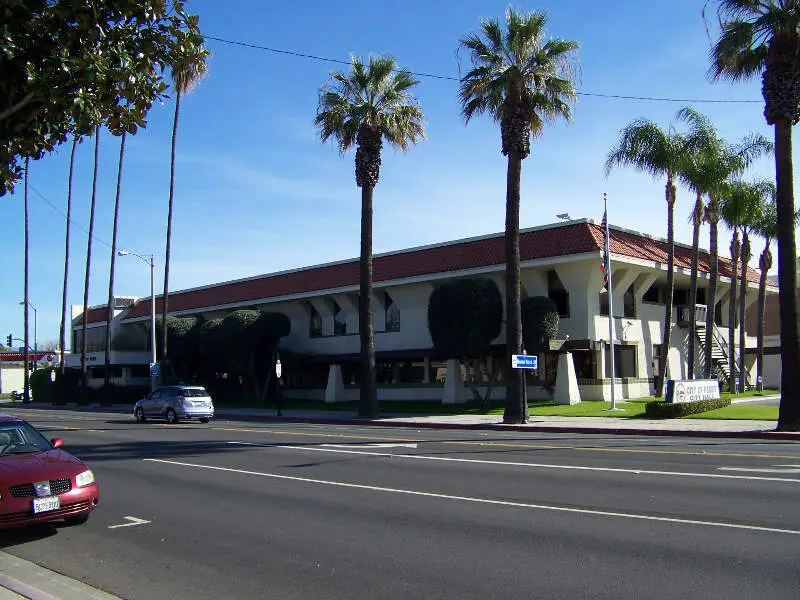
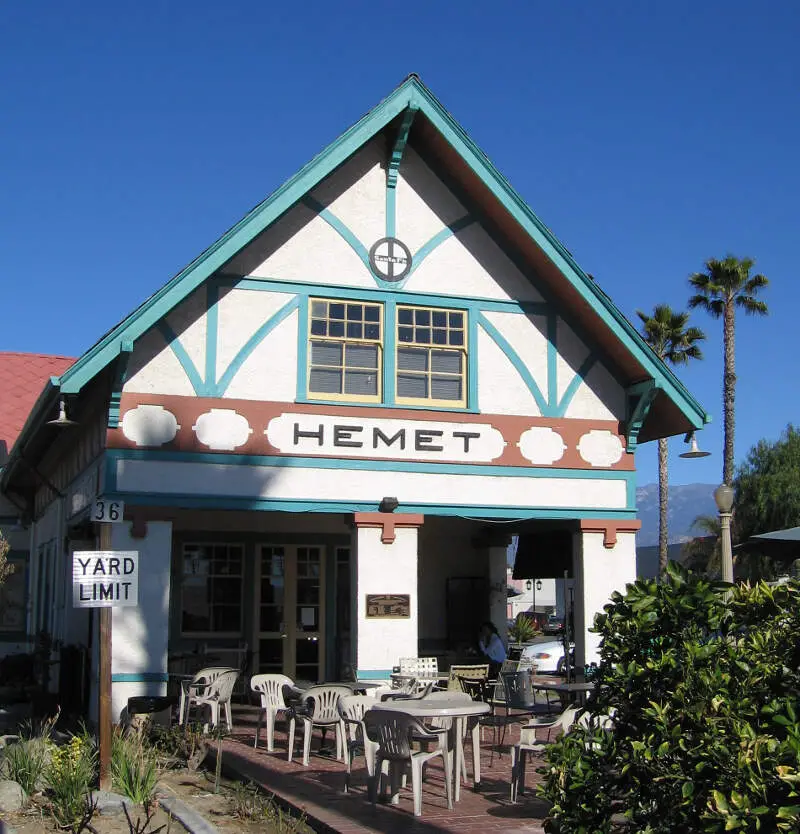
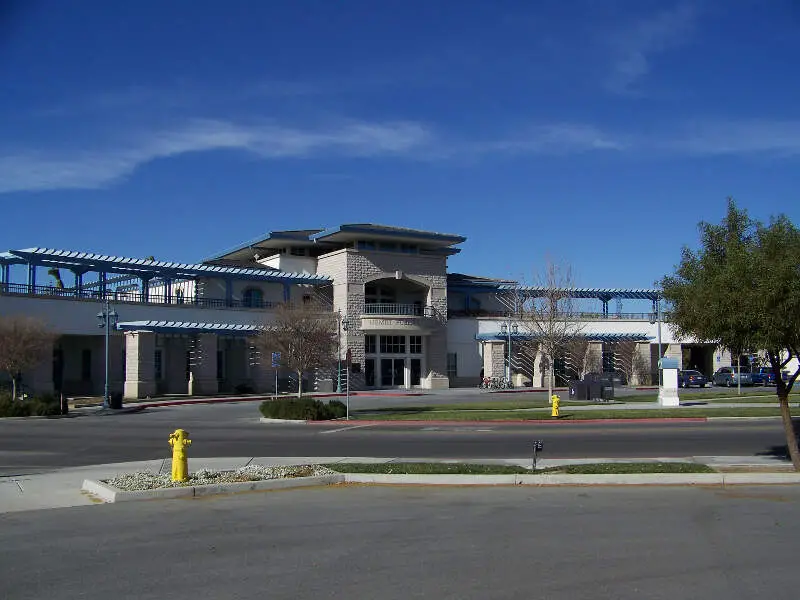
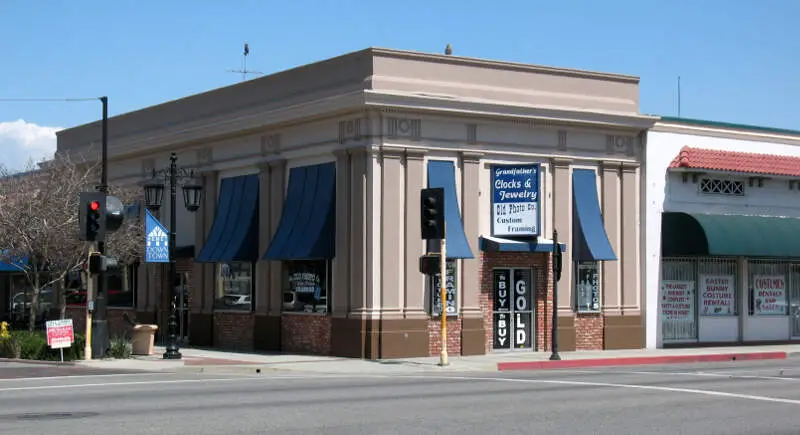
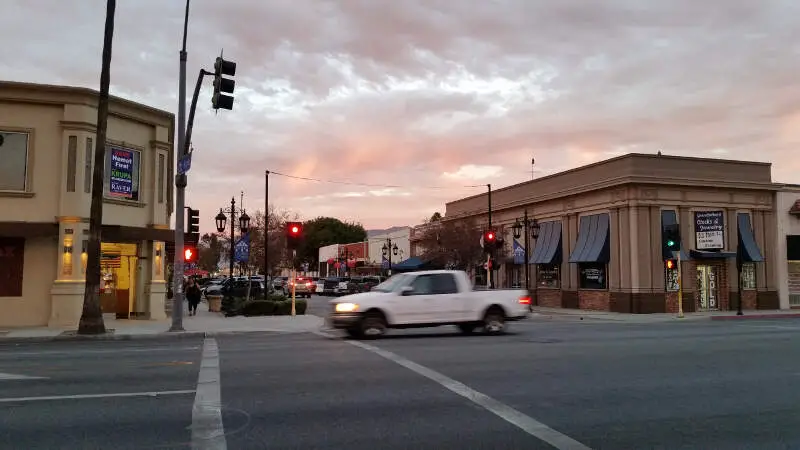
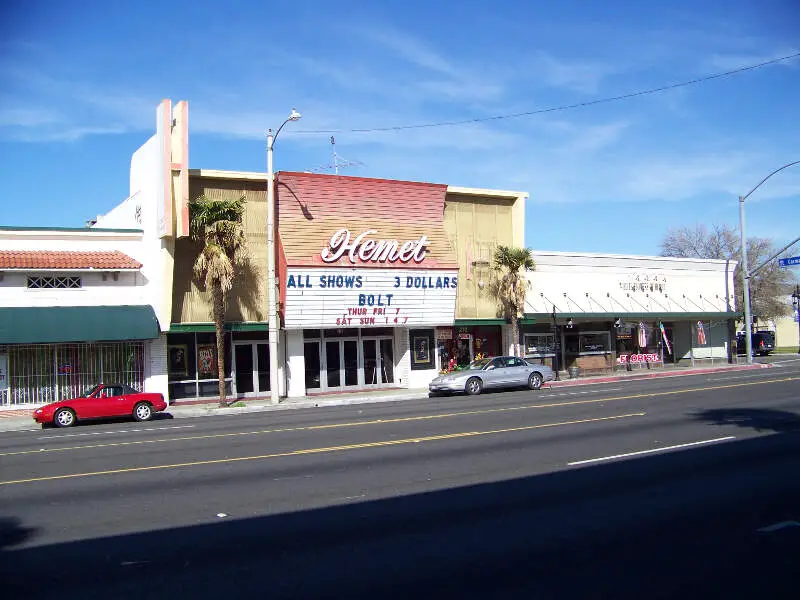
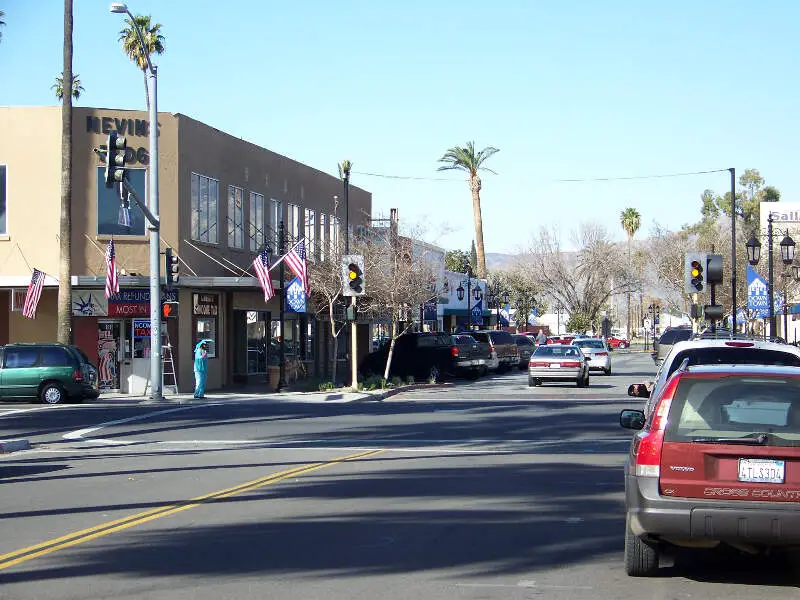
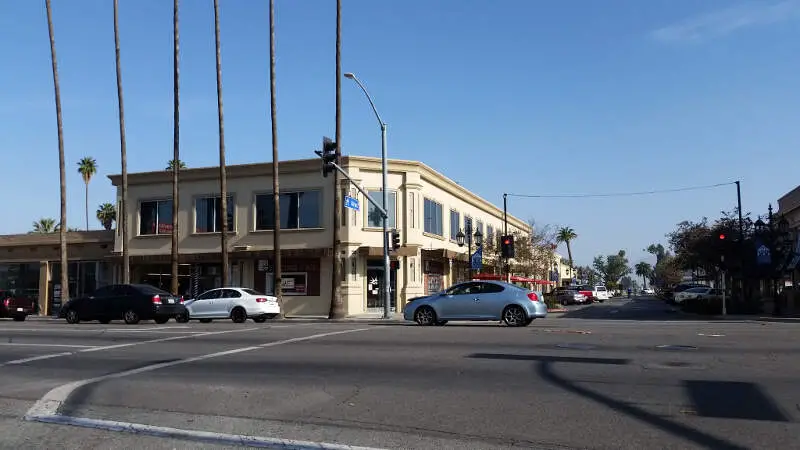
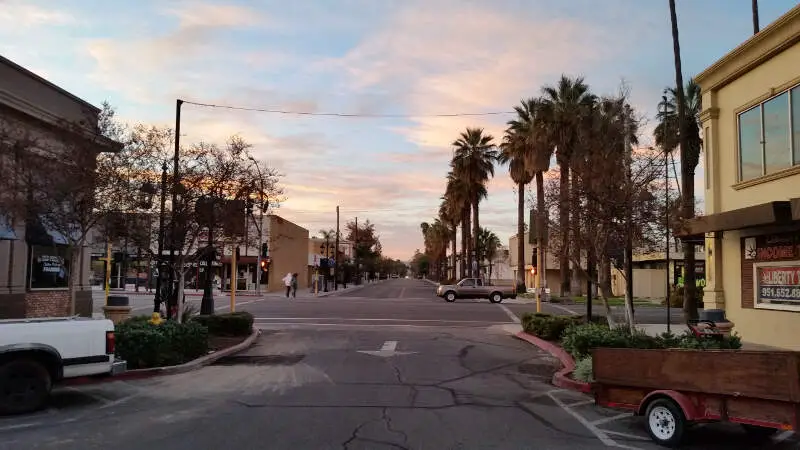
Hemet, CA Photos
1 Reviews & Comments About Hemet
/5

HomeSnacks User - None
I have lived in Hemet for 35 years. It is a pretty good size city. Size wise. Everything from A to Z. Orange groves. Big Lake. Farms. Horses. Nice schools. Lots of nice shopping nearby.
Very affordable. Now the bad part. Water rates and taxes are high. Drugs. Unemployment.|
Rankings for Hemet in California


Locations Around Hemet
Map Of Hemet, CA
Best Places Around Hemet
Temecula, CA
Population 110,404
Murrieta, CA
Population 111,621
French Valley, CA
Population 42,550
Cherry Valley, CA
Population 7,302
Canyon Lake, CA
Population 11,107
Nuevo, CA
Population 6,737
East Hemet, CA
Population 20,292
Moreno Valley, CA
Population 210,378
Beaumont, CA
Population 54,817
Mead Valley, CA
Population 19,588
Hemet Demographics And Statistics
Population over time in Hemet
The current population in Hemet is 90,646. The population has increased 18.6% from 2010.
| Year | Population | % Change |
|---|---|---|
| 2023 | 90,646 | 1.1% |
| 2022 | 89,651 | 0.8% |
| 2021 | 88,903 | 5.0% |
| 2020 | 84,686 | 0.2% |
| 2019 | 84,542 | 0.6% |
| 2018 | 84,069 | 0.6% |
| 2017 | 83,604 | 1.0% |
| 2016 | 82,748 | 0.8% |
| 2015 | 82,118 | 1.1% |
| 2014 | 81,203 | 1.5% |
| 2013 | 79,986 | 1.5% |
| 2012 | 78,833 | 1.4% |
| 2011 | 77,752 | 1.8% |
| 2010 | 76,403 | - |
Race / Ethnicity in Hemet
Hemet is:
33.5% White with 30,390 White residents.
8.8% African American with 7,992 African American residents.
0.7% American Indian with 645 American Indian residents.
3.4% Asian with 3,043 Asian residents.
0.1% Hawaiian with 119 Hawaiian residents.
0.4% Other with 401 Other residents.
3.6% Two Or More with 3,285 Two Or More residents.
49.4% Hispanic with 44,771 Hispanic residents.
| Race | Hemet | CA | USA |
|---|---|---|---|
| White | 33.5% | 34.6% | 58.2% |
| African American | 8.8% | 5.3% | 12.0% |
| American Indian | 0.7% | 0.3% | 0.5% |
| Asian | 3.4% | 15.1% | 5.7% |
| Hawaiian | 0.1% | 0.3% | 0.2% |
| Other | 0.4% | 0.5% | 0.5% |
| Two Or More | 3.6% | 4.1% | 3.9% |
| Hispanic | 49.4% | 39.8% | 19.0% |
Gender in Hemet
Hemet is 52.1% female with 47,202 female residents.
Hemet is 47.9% male with 43,444 male residents.
| Gender | Hemet | CA | USA |
|---|---|---|---|
| Female | 52.1% | 50.0% | 50.5% |
| Male | 47.9% | 50.0% | 49.5% |
Highest level of educational attainment in Hemet for adults over 25
9.0% of adults in Hemet completed < 9th grade.
11.0% of adults in Hemet completed 9-12th grade.
32.0% of adults in Hemet completed high school / ged.
26.0% of adults in Hemet completed some college.
8.0% of adults in Hemet completed associate's degree.
10.0% of adults in Hemet completed bachelor's degree.
4.0% of adults in Hemet completed master's degree.
0.0% of adults in Hemet completed professional degree.
0.0% of adults in Hemet completed doctorate degree.
| Education | Hemet | CA | USA |
|---|---|---|---|
| < 9th Grade | 9.0% | 8.0% | 5.0% |
| 9-12th Grade | 11.0% | 7.0% | 6.0% |
| High School / GED | 32.0% | 20.0% | 26.0% |
| Some College | 26.0% | 20.0% | 19.0% |
| Associate's Degree | 8.0% | 8.0% | 9.0% |
| Bachelor's Degree | 10.0% | 22.0% | 21.0% |
| Master's Degree | 4.0% | 10.0% | 10.0% |
| Professional Degree | 0.0% | 3.0% | 2.0% |
| Doctorate Degree | 0.0% | 2.0% | 2.0% |
Household Income For Hemet, California
6.8% of households in Hemet earn Less than $10,000.
4.0% of households in Hemet earn $10,000 to $14,999.
9.3% of households in Hemet earn $15,000 to $24,999.
11.4% of households in Hemet earn $25,000 to $34,999.
14.7% of households in Hemet earn $35,000 to $49,999.
19.1% of households in Hemet earn $50,000 to $74,999.
11.2% of households in Hemet earn $75,000 to $99,999.
12.1% of households in Hemet earn $100,000 to $149,999.
6.0% of households in Hemet earn $150,000 to $199,999.
5.4% of households in Hemet earn $200,000 or more.
| Income | Hemet | CA | USA |
|---|---|---|---|
| Less than $10,000 | 6.8% | 4.4% | 4.9% |
| $10,000 to $14,999 | 4.0% | 3.0% | 3.6% |
| $15,000 to $24,999 | 9.3% | 5.2% | 6.6% |
| $25,000 to $34,999 | 11.4% | 5.5% | 6.8% |
| $35,000 to $49,999 | 14.7% | 8.4% | 10.4% |
| $50,000 to $74,999 | 19.1% | 13.3% | 15.7% |
| $75,000 to $99,999 | 11.2% | 11.8% | 12.7% |
| $100,000 to $149,999 | 12.1% | 17.9% | 17.4% |
| $150,000 to $199,999 | 6.0% | 11.1% | 9.3% |
| $200,000 or more | 5.4% | 19.4% | 12.6% |


