Huntington Beach, CA
Demographics And Statistics
Living In Huntington Beach, California Summary
Life in Huntington Beach research summary. HomeSnacks has been using Saturday Night Science to research the quality of life in Huntington Beach over the past nine years using Census, FBI, Zillow, and other primary data sources. Based on the most recently available data, we found the following about life in Huntington Beach:
The population in Huntington Beach is 196,010.
The median home value in Huntington Beach is $1,302,985.
The median income in Huntington Beach is $119,885.
The cost of living in Huntington Beach is 189 which is 1.9x higher than the national average.
The median rent in Huntington Beach is $2,424.
The unemployment rate in Huntington Beach is 5.4%.
The poverty rate in Huntington Beach is 7.5%.
The average high in Huntington Beach is 74.4° and the average low is 54.4°.
Huntington Beach SnackAbility
Overall SnackAbility
Huntington Beach, CA Crime Report
Crime in Huntington Beach summary. We use data from the FBI to determine the crime rates in Huntington Beach. Key points include:
There were 4,175 total crimes in Huntington Beach in the last reporting year.
The overall crime rate per 100,000 people in Huntington Beach is 2,196.4 / 100k people.
The violent crime rate per 100,000 people in Huntington Beach is 207.3 / 100k people.
The property crime rate per 100,000 people in Huntington Beach is 1,989.2 / 100k people.
Overall, crime in Huntington Beach is 3.64% above the national average.
Total Crimes
Above National Average
Crime In Huntington Beach Comparison Table
| Statistic | Count Raw |
Huntington Beach / 100k People |
California / 100k People |
National / 100k People |
|---|---|---|---|---|
| Total Crimes Per 100K | 4,175 | 2,196.4 | 2,564.5 | 2,119.2 |
| Violent Crime | 394 | 207.3 | 486.0 | 359.0 |
| Murder | 5 | 2.6 | 4.5 | 5.0 |
| Robbery | 97 | 51.0 | 119.1 | 61.0 |
| Aggravated Assault | 226 | 118.9 | 325.8 | 256.0 |
| Property Crime | 3,781 | 1,989.2 | 2,078.4 | 1,760.0 |
| Burglary | 382 | 201.0 | 305.8 | 229.0 |
| Larceny | 3,125 | 1,644.0 | 1,345.2 | 1,272.0 |
| Car Theft | 274 | 144.1 | 427.5 | 259.0 |
Huntington Beach, CA Cost Of Living
Cost of living in Huntington Beach summary. We use data on the cost of living to determine how expensive it is to live in Huntington Beach. Real estate prices drive most of the variance in cost of living around California. Key points include:
The cost of living in Huntington Beach is 189 with 100 being average.
The cost of living in Huntington Beach is 1.9x higher than the national average.
The median home value in Huntington Beach is $1,302,985.
The median income in Huntington Beach is $119,885.
Huntington Beach's Overall Cost Of Living
Higher Than The National Average
Cost Of Living In Huntington Beach Comparison Table
| Living Expense | Huntington Beach | California | National Average | |
|---|---|---|---|---|
| Overall | 189 | 141 | 100 | |
| Services | 111 | 110 | 100 | |
| Groceries | 114 | 112 | 100 | |
| Health | 100 | 110 | 100 | |
| Housing | 367 | 195 | 100 | |
| Transportation | 125 | 125 | 100 | |
| Utilities | 95 | 128 | 100 | |
Huntington Beach, CA Weather
The average high in Huntington Beach is 74.4° and the average low is 54.4°.
There are 22.9 days of precipitation each year.
Expect an average of 13.3 inches of precipitation each year with 0.0 inches of snow.
| Stat | Huntington Beach |
|---|---|
| Average Annual High | 74.4 |
| Average Annual Low | 54.4 |
| Annual Precipitation Days | 22.9 |
| Average Annual Precipitation | 13.3 |
| Average Annual Snowfall | 0.0 |
Average High
Days of Rain
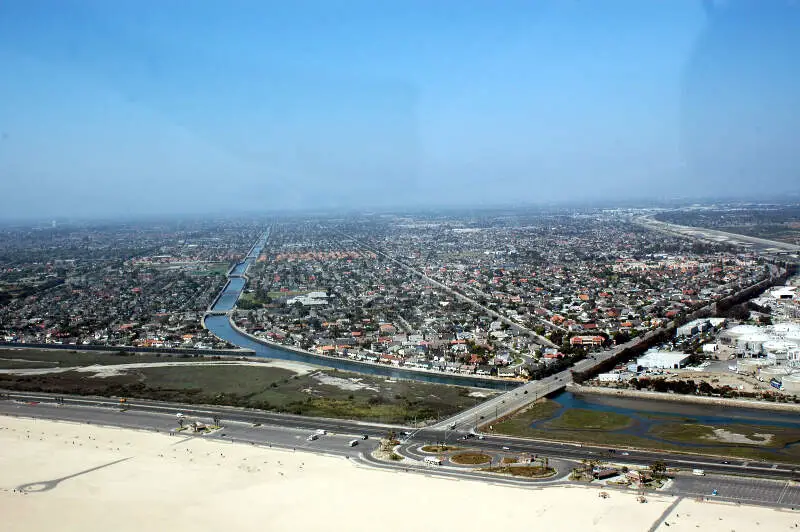
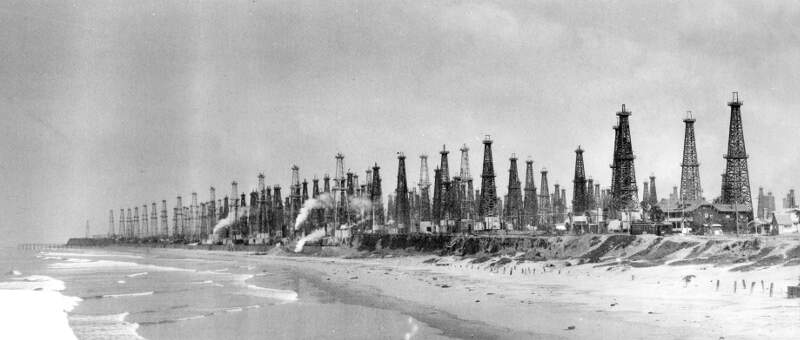
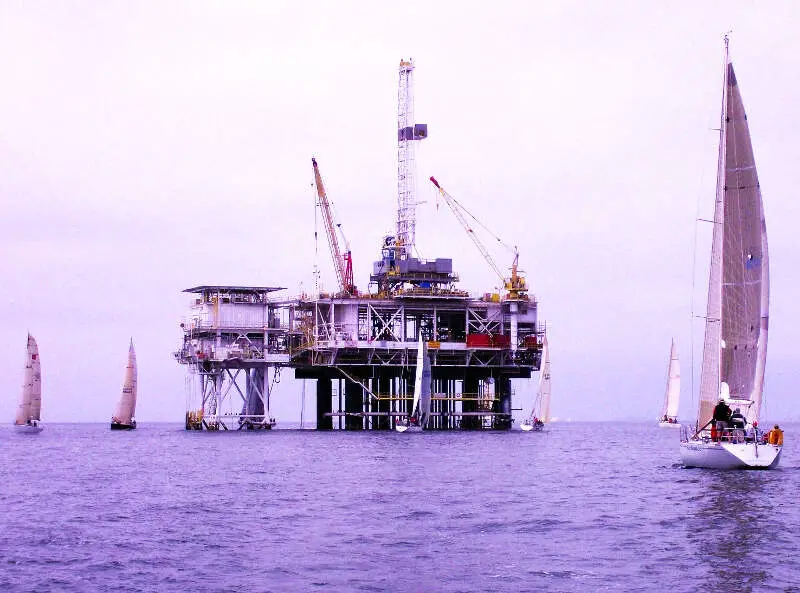
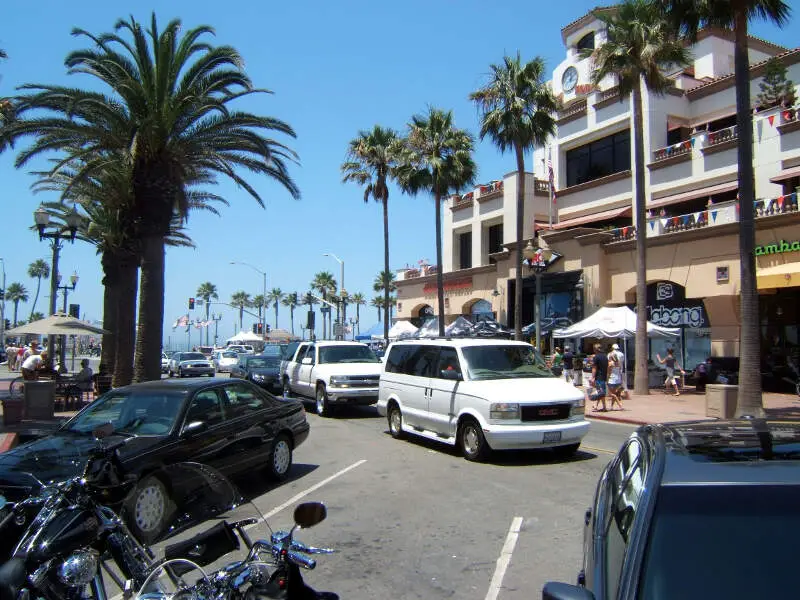
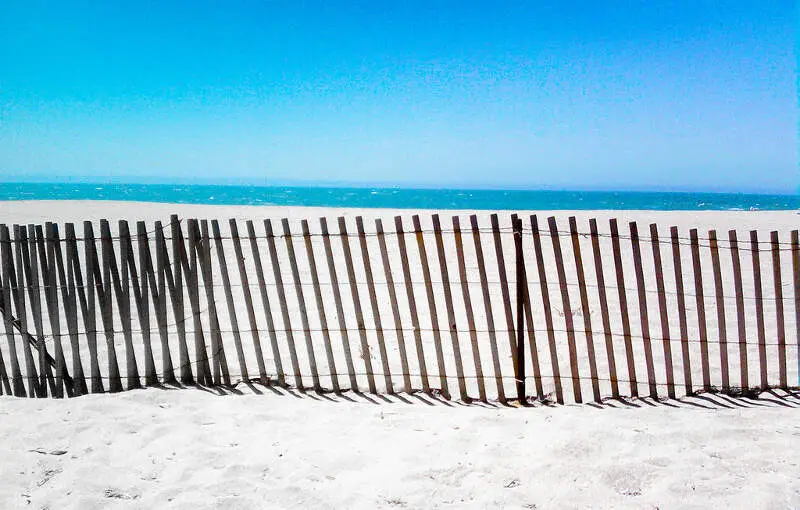
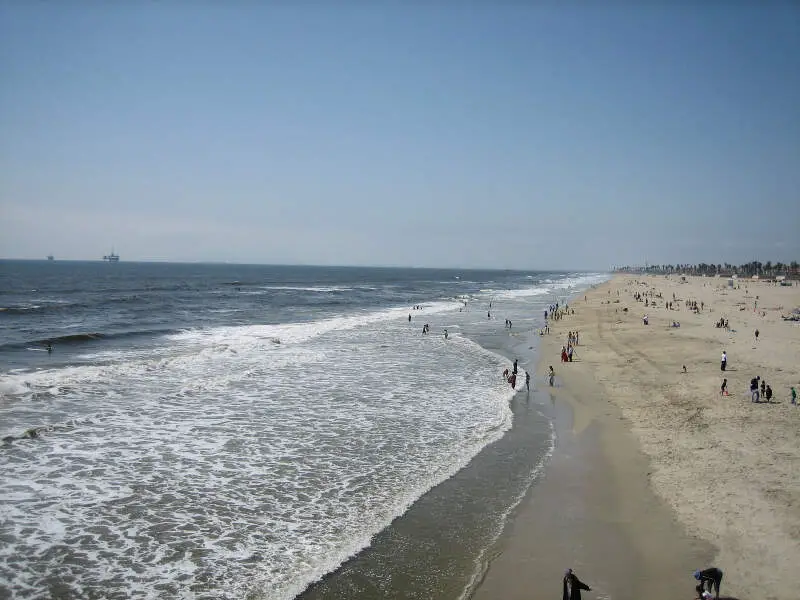
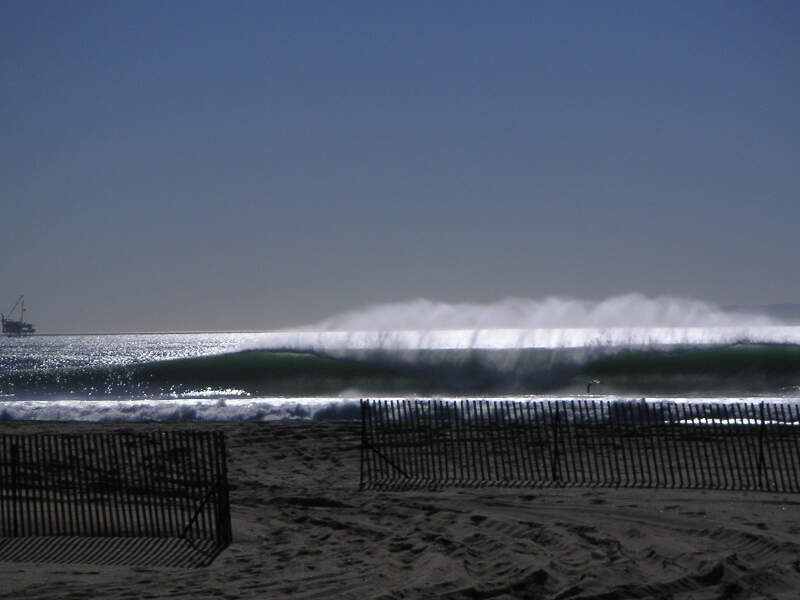
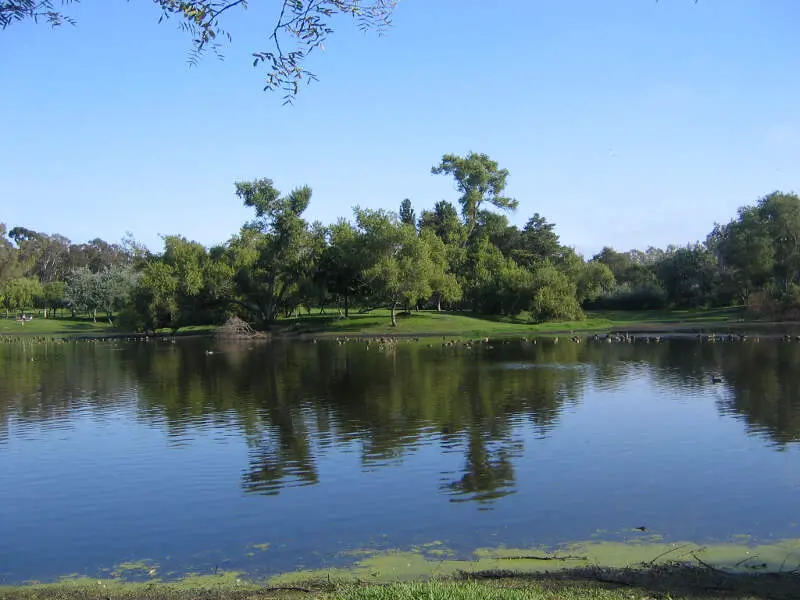
Huntington Beach, CA Photos

Rankings for Huntington Beach in California


Locations Around Huntington Beach
Map Of Huntington Beach, CA
Best Places Around Huntington Beach
Aliso Viejo, CA
Population 51,320
La Mirada, CA
Population 46,945
North Tustin, CA
Population 26,038
Lakewood, CA
Population 80,510
Villa Park, CA
Population 5,776
Cypress, CA
Population 49,531
Lake Forest, CA
Population 85,846
Rossmoor, CA
Population 11,895
Yorba Linda, CA
Population 67,407
La Palma, CA
Population 15,375
Huntington Beach Demographics And Statistics
Population over time in Huntington Beach
The current population in Huntington Beach is 196,010. The population has increased 3.8% from 2010.
| Year | Population | % Change |
|---|---|---|
| 2023 | 196,010 | -0.7% |
| 2022 | 197,481 | -0.6% |
| 2021 | 198,735 | -0.5% |
| 2020 | 199,778 | -0.2% |
| 2019 | 200,259 | -0.2% |
| 2018 | 200,606 | 0.1% |
| 2017 | 200,415 | 0.9% |
| 2016 | 198,724 | 0.5% |
| 2015 | 197,752 | 1.1% |
| 2014 | 195,686 | 1.3% |
| 2013 | 193,197 | 0.9% |
| 2012 | 191,403 | 0.9% |
| 2011 | 189,744 | 0.4% |
| 2010 | 188,914 | - |
Race / Ethnicity in Huntington Beach
Huntington Beach is:
59.2% White with 116,126 White residents.
1.2% African American with 2,340 African American residents.
0.3% American Indian with 502 American Indian residents.
12.5% Asian with 24,414 Asian residents.
0.4% Hawaiian with 728 Hawaiian residents.
0.6% Other with 1,108 Other residents.
6.5% Two Or More with 12,701 Two Or More residents.
19.4% Hispanic with 38,091 Hispanic residents.
| Race | Huntington Beach | CA | USA |
|---|---|---|---|
| White | 59.2% | 34.6% | 58.2% |
| African American | 1.2% | 5.3% | 12.0% |
| American Indian | 0.3% | 0.3% | 0.5% |
| Asian | 12.5% | 15.1% | 5.7% |
| Hawaiian | 0.4% | 0.3% | 0.2% |
| Other | 0.6% | 0.5% | 0.5% |
| Two Or More | 6.5% | 4.1% | 3.9% |
| Hispanic | 19.4% | 39.8% | 19.0% |
Gender in Huntington Beach
Huntington Beach is 50.3% female with 98,568 female residents.
Huntington Beach is 49.7% male with 97,442 male residents.
| Gender | Huntington Beach | CA | USA |
|---|---|---|---|
| Female | 50.3% | 50.0% | 50.5% |
| Male | 49.7% | 50.0% | 49.5% |
Highest level of educational attainment in Huntington Beach for adults over 25
4.0% of adults in Huntington Beach completed < 9th grade.
3.0% of adults in Huntington Beach completed 9-12th grade.
16.0% of adults in Huntington Beach completed high school / ged.
21.0% of adults in Huntington Beach completed some college.
9.0% of adults in Huntington Beach completed associate's degree.
29.0% of adults in Huntington Beach completed bachelor's degree.
12.0% of adults in Huntington Beach completed master's degree.
4.0% of adults in Huntington Beach completed professional degree.
2.0% of adults in Huntington Beach completed doctorate degree.
| Education | Huntington Beach | CA | USA |
|---|---|---|---|
| < 9th Grade | 4.0% | 8.0% | 5.0% |
| 9-12th Grade | 3.0% | 7.0% | 6.0% |
| High School / GED | 16.0% | 20.0% | 26.0% |
| Some College | 21.0% | 20.0% | 19.0% |
| Associate's Degree | 9.0% | 8.0% | 9.0% |
| Bachelor's Degree | 29.0% | 22.0% | 21.0% |
| Master's Degree | 12.0% | 10.0% | 10.0% |
| Professional Degree | 4.0% | 3.0% | 2.0% |
| Doctorate Degree | 2.0% | 2.0% | 2.0% |
Household Income For Huntington Beach, California
2.7% of households in Huntington Beach earn Less than $10,000.
2.4% of households in Huntington Beach earn $10,000 to $14,999.
3.4% of households in Huntington Beach earn $15,000 to $24,999.
4.1% of households in Huntington Beach earn $25,000 to $34,999.
5.8% of households in Huntington Beach earn $35,000 to $49,999.
10.8% of households in Huntington Beach earn $50,000 to $74,999.
11.6% of households in Huntington Beach earn $75,000 to $99,999.
20.8% of households in Huntington Beach earn $100,000 to $149,999.
13.7% of households in Huntington Beach earn $150,000 to $199,999.
24.8% of households in Huntington Beach earn $200,000 or more.
| Income | Huntington Beach | CA | USA |
|---|---|---|---|
| Less than $10,000 | 2.7% | 4.4% | 4.9% |
| $10,000 to $14,999 | 2.4% | 3.0% | 3.6% |
| $15,000 to $24,999 | 3.4% | 5.2% | 6.6% |
| $25,000 to $34,999 | 4.1% | 5.5% | 6.8% |
| $35,000 to $49,999 | 5.8% | 8.4% | 10.4% |
| $50,000 to $74,999 | 10.8% | 13.3% | 15.7% |
| $75,000 to $99,999 | 11.6% | 11.8% | 12.7% |
| $100,000 to $149,999 | 20.8% | 17.9% | 17.4% |
| $150,000 to $199,999 | 13.7% | 11.1% | 9.3% |
| $200,000 or more | 24.8% | 19.4% | 12.6% |


