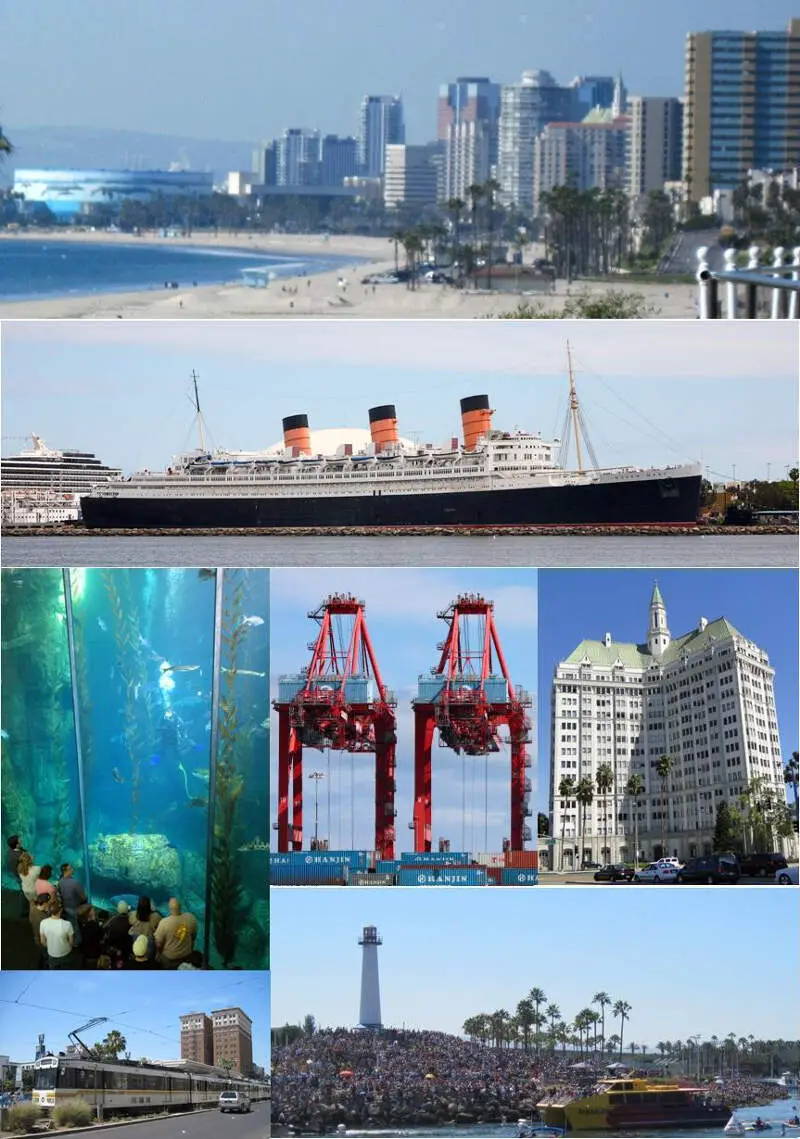
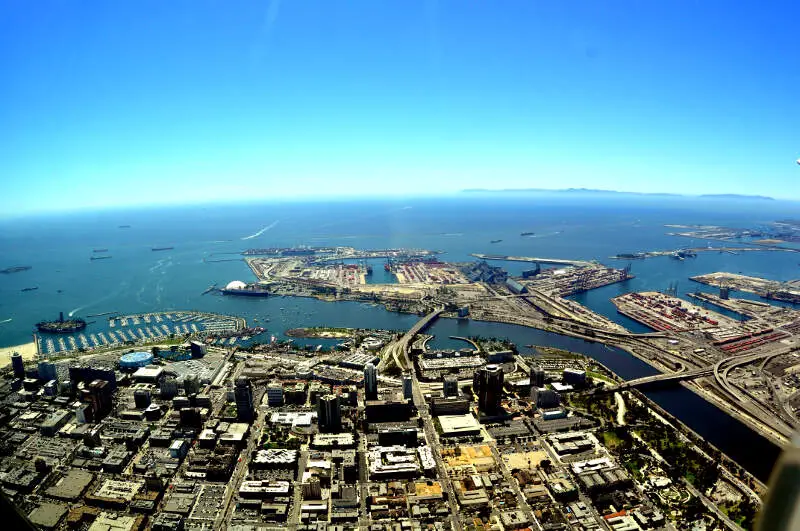
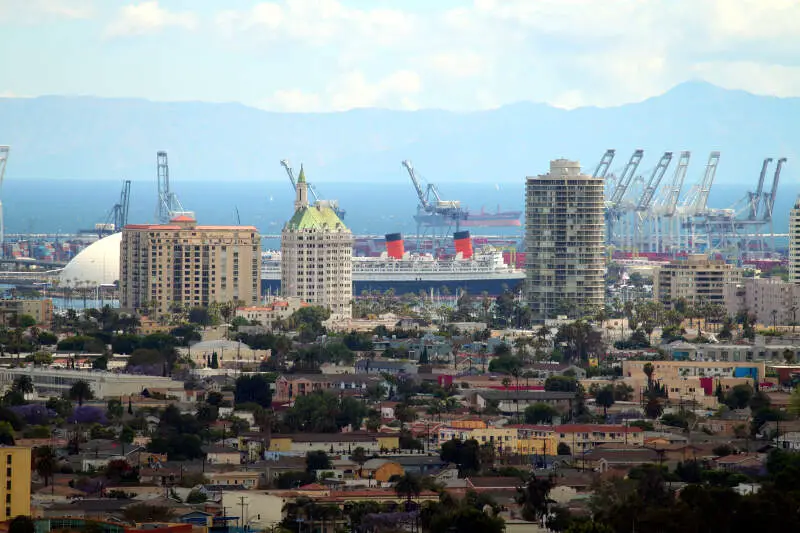
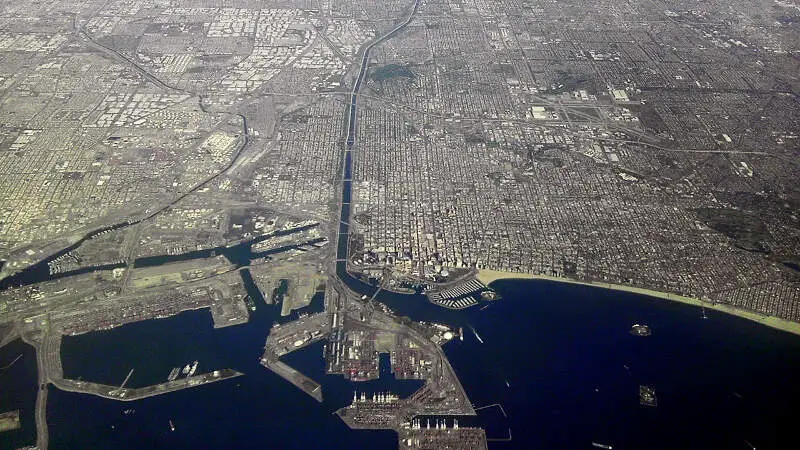
Long Beach, CA
Demographics And Statistics
Living In Long Beach, California Summary
Life in Long Beach research summary. HomeSnacks has been using Saturday Night Science to research the quality of life in Long Beach over the past nine years using Census, FBI, Zillow, and other primary data sources. Based on the most recently available data, we found the following about life in Long Beach:
The population in Long Beach is 458,491.
The median home value in Long Beach is $835,128.
The median income in Long Beach is $83,969.
The cost of living in Long Beach is 158 which is 1.6x higher than the national average.
The median rent in Long Beach is $1,803.
The unemployment rate in Long Beach is 6.5%.
The poverty rate in Long Beach is 15.0%.
The average high in Long Beach is 75.3° and the average low is 54.1°.
Long Beach SnackAbility
Overall SnackAbility
Long Beach, CA Crime Report
Crime in Long Beach summary. We use data from the FBI to determine the crime rates in Long Beach. Key points include:
There were 18,459 total crimes in Long Beach in the last reporting year.
The overall crime rate per 100,000 people in Long Beach is 4,155.3 / 100k people.
The violent crime rate per 100,000 people in Long Beach is 676.4 / 100k people.
The property crime rate per 100,000 people in Long Beach is 3,478.8 / 100k people.
Overall, crime in Long Beach is 96.07% above the national average.
Total Crimes
Above National Average
Crime In Long Beach Comparison Table
| Statistic | Count Raw |
Long Beach / 100k People |
California / 100k People |
National / 100k People |
|---|---|---|---|---|
| Total Crimes Per 100K | 18,459 | 4,155.3 | 2,564.5 | 2,119.2 |
| Violent Crime | 3,005 | 676.4 | 486.0 | 359.0 |
| Murder | 37 | 8.3 | 4.5 | 5.0 |
| Robbery | 989 | 222.6 | 119.1 | 61.0 |
| Aggravated Assault | 1,779 | 400.5 | 325.8 | 256.0 |
| Property Crime | 15,454 | 3,478.8 | 2,078.4 | 1,760.0 |
| Burglary | 3,131 | 704.8 | 305.8 | 229.0 |
| Larceny | 7,977 | 1,795.7 | 1,345.2 | 1,272.0 |
| Car Theft | 4,346 | 978.3 | 427.5 | 259.0 |
Long Beach, CA Cost Of Living
Cost of living in Long Beach summary. We use data on the cost of living to determine how expensive it is to live in Long Beach. Real estate prices drive most of the variance in cost of living around California. Key points include:
The cost of living in Long Beach is 158 with 100 being average.
The cost of living in Long Beach is 1.6x higher than the national average.
The median home value in Long Beach is $835,128.
The median income in Long Beach is $83,969.
Long Beach's Overall Cost Of Living
Higher Than The National Average
Cost Of Living In Long Beach Comparison Table
| Living Expense | Long Beach | California | National Average | |
|---|---|---|---|---|
| Overall | 158 | 141 | 100 | |
| Services | 113 | 110 | 100 | |
| Groceries | 114 | 112 | 100 | |
| Health | 98 | 110 | 100 | |
| Housing | 263 | 195 | 100 | |
| Transportation | 123 | 125 | 100 | |
| Utilities | 92 | 128 | 100 | |
Long Beach, CA Weather
The average high in Long Beach is 75.3° and the average low is 54.1°.
There are 22.7 days of precipitation each year.
Expect an average of 16.2 inches of precipitation each year with 0.2 inches of snow.
| Stat | Long Beach |
|---|---|
| Average Annual High | 75.3 |
| Average Annual Low | 54.1 |
| Annual Precipitation Days | 22.7 |
| Average Annual Precipitation | 16.2 |
| Average Annual Snowfall | 0.2 |
Average High
Days of Rain
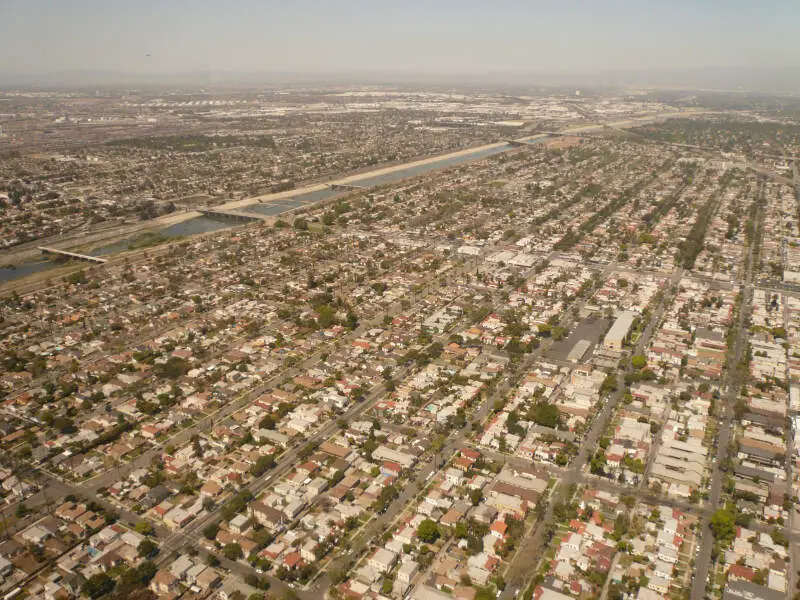
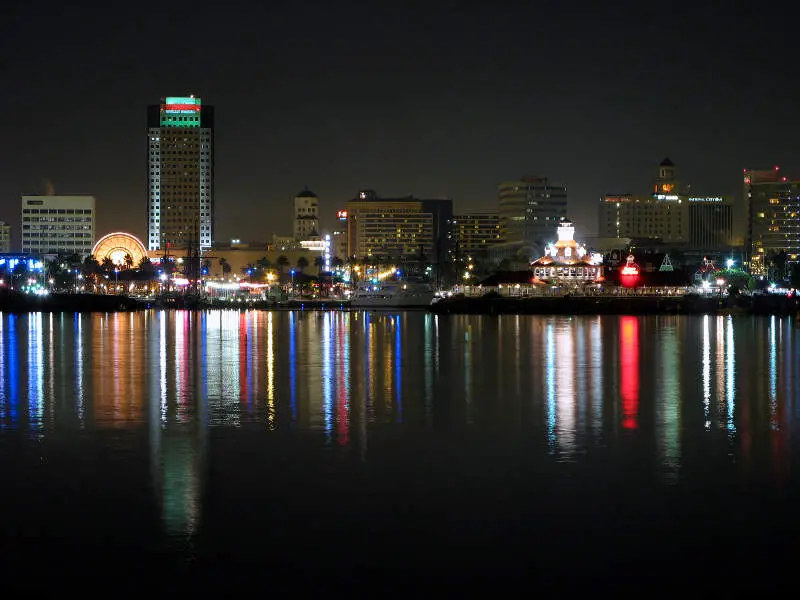
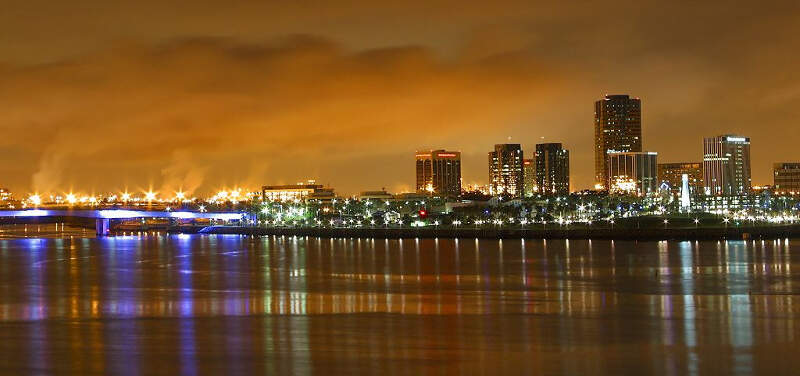
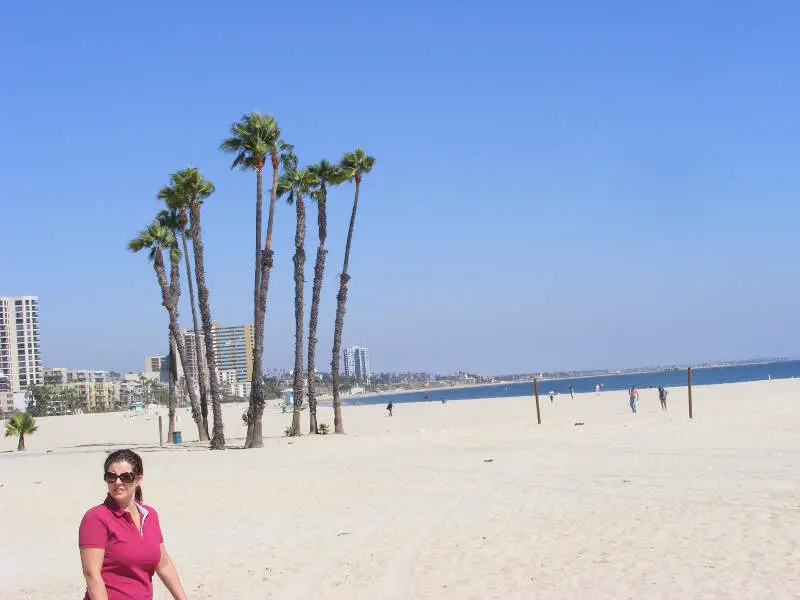
Long Beach, CA Photos

2 Reviews & Comments About Long Beach
/5

HomeSnacks User - 2018-08-05 02:53:44.364963
Long Beach is a city all it's own. It comes alive with people of all shapes and sizes. The personalities cannot be harnessed. The city never sleeps! The crime rate was not the greatest I must admit. But I was never bored!
MVP on Redondo is the best burger hole in the wall I have ever had! Try the Shaq Burger! The rent is outrageous though!
HomeSnacks User - 2018-09-19 00:58:59.568969
I moved to Long Beach to attend Cal State University Long Beach. Honestly, it changed my life. I grew up in a different suburb in California, but Long Beach is so different. I wouldn't necessarily live here for my whole life, but it was definitely worth coming here for college. I like coming back and visiting here to see my friends.
My favorite thing about Long Beach is that there are honestly always places to go to, and it's not too far to go to other fun cities like LA. It's not too quiet but never too loud either unless you live somewhere that is filled with college students. The weather is great, too. And of course, we're near a few beaches, so that's great.
Long Beach Articles


Rankings for Long Beach in California

Locations Around Long Beach
Map Of Long Beach, CA
Best Places Around Long Beach
Del Aire, CA
Population 11,115
La Mirada, CA
Population 46,945
Lakewood, CA
Population 80,510
Villa Park, CA
Population 5,776
Cypress, CA
Population 49,531
West Puente Valley, CA
Population 22,198
Rossmoor, CA
Population 11,895
La Palma, CA
Population 15,375
Artesia, CA
Population 16,044
Placentia, CA
Population 52,384
Long Beach Demographics And Statistics
Population over time in Long Beach
The current population in Long Beach is 458,491. The population has decreased -0.7% from 2010.
| Year | Population | % Change |
|---|---|---|
| 2023 | 458,491 | -0.8% |
| 2022 | 462,293 | -0.9% |
| 2021 | 466,565 | 1.0% |
| 2020 | 462,081 | -1.0% |
| 2019 | 466,776 | -0.4% |
| 2018 | 468,883 | -0.3% |
| 2017 | 470,489 | 0.1% |
| 2016 | 469,793 | -0.1% |
| 2015 | 470,237 | 0.4% |
| 2014 | 468,594 | 0.7% |
| 2013 | 465,424 | 0.4% |
| 2012 | 463,589 | 0.3% |
| 2011 | 462,197 | 0.1% |
| 2010 | 461,823 | - |
Race / Ethnicity in Long Beach
Long Beach is:
27.2% White with 124,894 White residents.
11.5% African American with 52,644 African American residents.
0.2% American Indian with 1,116 American Indian residents.
12.5% Asian with 57,232 Asian residents.
0.5% Hawaiian with 2,468 Hawaiian residents.
0.5% Other with 2,282 Other residents.
4.1% Two Or More with 18,768 Two Or More residents.
43.4% Hispanic with 199,087 Hispanic residents.
| Race | Long Beach | CA | USA |
|---|---|---|---|
| White | 27.2% | 34.6% | 58.2% |
| African American | 11.5% | 5.3% | 12.0% |
| American Indian | 0.2% | 0.3% | 0.5% |
| Asian | 12.5% | 15.1% | 5.7% |
| Hawaiian | 0.5% | 0.3% | 0.2% |
| Other | 0.5% | 0.5% | 0.5% |
| Two Or More | 4.1% | 4.1% | 3.9% |
| Hispanic | 43.4% | 39.8% | 19.0% |
Gender in Long Beach
Long Beach is 50.5% female with 231,556 female residents.
Long Beach is 49.5% male with 226,934 male residents.
| Gender | Long Beach | CA | USA |
|---|---|---|---|
| Female | 50.5% | 50.0% | 50.5% |
| Male | 49.5% | 50.0% | 49.5% |
Highest level of educational attainment in Long Beach for adults over 25
11.0% of adults in Long Beach completed < 9th grade.
7.0% of adults in Long Beach completed 9-12th grade.
18.0% of adults in Long Beach completed high school / ged.
22.0% of adults in Long Beach completed some college.
7.0% of adults in Long Beach completed associate's degree.
22.0% of adults in Long Beach completed bachelor's degree.
9.0% of adults in Long Beach completed master's degree.
2.0% of adults in Long Beach completed professional degree.
2.0% of adults in Long Beach completed doctorate degree.
| Education | Long Beach | CA | USA |
|---|---|---|---|
| < 9th Grade | 11.0% | 8.0% | 5.0% |
| 9-12th Grade | 7.0% | 7.0% | 6.0% |
| High School / GED | 18.0% | 20.0% | 26.0% |
| Some College | 22.0% | 20.0% | 19.0% |
| Associate's Degree | 7.0% | 8.0% | 9.0% |
| Bachelor's Degree | 22.0% | 22.0% | 21.0% |
| Master's Degree | 9.0% | 10.0% | 10.0% |
| Professional Degree | 2.0% | 3.0% | 2.0% |
| Doctorate Degree | 2.0% | 2.0% | 2.0% |
Household Income For Long Beach, California
5.4% of households in Long Beach earn Less than $10,000.
3.9% of households in Long Beach earn $10,000 to $14,999.
5.4% of households in Long Beach earn $15,000 to $24,999.
6.1% of households in Long Beach earn $25,000 to $34,999.
9.5% of households in Long Beach earn $35,000 to $49,999.
15.0% of households in Long Beach earn $50,000 to $74,999.
12.6% of households in Long Beach earn $75,000 to $99,999.
18.5% of households in Long Beach earn $100,000 to $149,999.
10.4% of households in Long Beach earn $150,000 to $199,999.
13.3% of households in Long Beach earn $200,000 or more.
| Income | Long Beach | CA | USA |
|---|---|---|---|
| Less than $10,000 | 5.4% | 4.4% | 4.9% |
| $10,000 to $14,999 | 3.9% | 3.0% | 3.6% |
| $15,000 to $24,999 | 5.4% | 5.2% | 6.6% |
| $25,000 to $34,999 | 6.1% | 5.5% | 6.8% |
| $35,000 to $49,999 | 9.5% | 8.4% | 10.4% |
| $50,000 to $74,999 | 15.0% | 13.3% | 15.7% |
| $75,000 to $99,999 | 12.6% | 11.8% | 12.7% |
| $100,000 to $149,999 | 18.5% | 17.9% | 17.4% |
| $150,000 to $199,999 | 10.4% | 11.1% | 9.3% |
| $200,000 or more | 13.3% | 19.4% | 12.6% |


