Marysville, CA
Demographics And Statistics
Living In Marysville, California Summary
Life in Marysville research summary. HomeSnacks has been using Saturday Night Science to research the quality of life in Marysville over the past nine years using Census, FBI, Zillow, and other primary data sources. Based on the most recently available data, we found the following about life in Marysville:
The population in Marysville is 12,703.
The median home value in Marysville is $390,028.
The median income in Marysville is $58,150.
The cost of living in Marysville is 114 which is 1.1x higher than the national average.
The median rent in Marysville is $1,223.
The unemployment rate in Marysville is 8.0%.
The poverty rate in Marysville is 22.5%.
The average high in Marysville is 71.9° and the average low is 47.2°.
Marysville SnackAbility
Overall SnackAbility
Marysville, CA Crime Report
Crime in Marysville summary. We use data from the FBI to determine the crime rates in Marysville. Key points include:
There were 354 total crimes in Marysville in the last reporting year.
The overall crime rate per 100,000 people in Marysville is 2,806.0 / 100k people.
The violent crime rate per 100,000 people in Marysville is 745.1 / 100k people.
The property crime rate per 100,000 people in Marysville is 2,060.9 / 100k people.
Overall, crime in Marysville is 32.40% above the national average.
Total Crimes
Above National Average
Crime In Marysville Comparison Table
| Statistic | Count Raw |
Marysville / 100k People |
California / 100k People |
National / 100k People |
|---|---|---|---|---|
| Total Crimes Per 100K | 354 | 2,806.0 | 2,564.5 | 2,119.2 |
| Violent Crime | 94 | 745.1 | 486.0 | 359.0 |
| Murder | 2 | 15.9 | 4.5 | 5.0 |
| Robbery | 10 | 79.3 | 119.1 | 61.0 |
| Aggravated Assault | 76 | 602.4 | 325.8 | 256.0 |
| Property Crime | 260 | 2,060.9 | 2,078.4 | 1,760.0 |
| Burglary | 26 | 206.1 | 305.8 | 229.0 |
| Larceny | 153 | 1,212.7 | 1,345.2 | 1,272.0 |
| Car Theft | 81 | 642.0 | 427.5 | 259.0 |
Marysville, CA Cost Of Living
Cost of living in Marysville summary. We use data on the cost of living to determine how expensive it is to live in Marysville. Real estate prices drive most of the variance in cost of living around California. Key points include:
The cost of living in Marysville is 114 with 100 being average.
The cost of living in Marysville is 1.1x higher than the national average.
The median home value in Marysville is $390,028.
The median income in Marysville is $58,150.
Marysville's Overall Cost Of Living
Higher Than The National Average
Cost Of Living In Marysville Comparison Table
| Living Expense | Marysville | California | National Average | |
|---|---|---|---|---|
| Overall | 114 | 141 | 100 | |
| Services | 108 | 110 | 100 | |
| Groceries | 107 | 112 | 100 | |
| Health | 114 | 110 | 100 | |
| Housing | 118 | 195 | 100 | |
| Transportation | 121 | 125 | 100 | |
| Utilities | 112 | 128 | 100 | |
Marysville, CA Weather
The average high in Marysville is 71.9° and the average low is 47.2°.
There are 54.6 days of precipitation each year.
Expect an average of 42.5 inches of precipitation each year with 15.3 inches of snow.
| Stat | Marysville |
|---|---|
| Average Annual High | 71.9 |
| Average Annual Low | 47.2 |
| Annual Precipitation Days | 54.6 |
| Average Annual Precipitation | 42.5 |
| Average Annual Snowfall | 15.3 |
Average High
Days of Rain
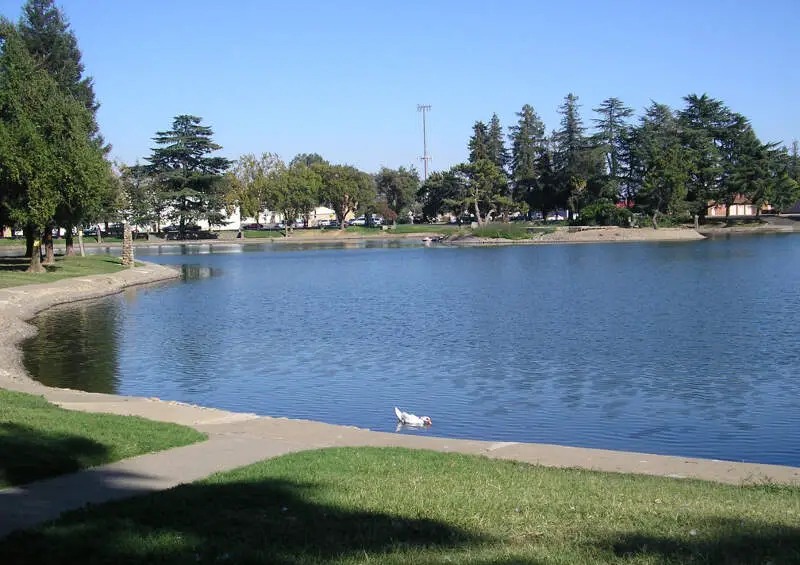
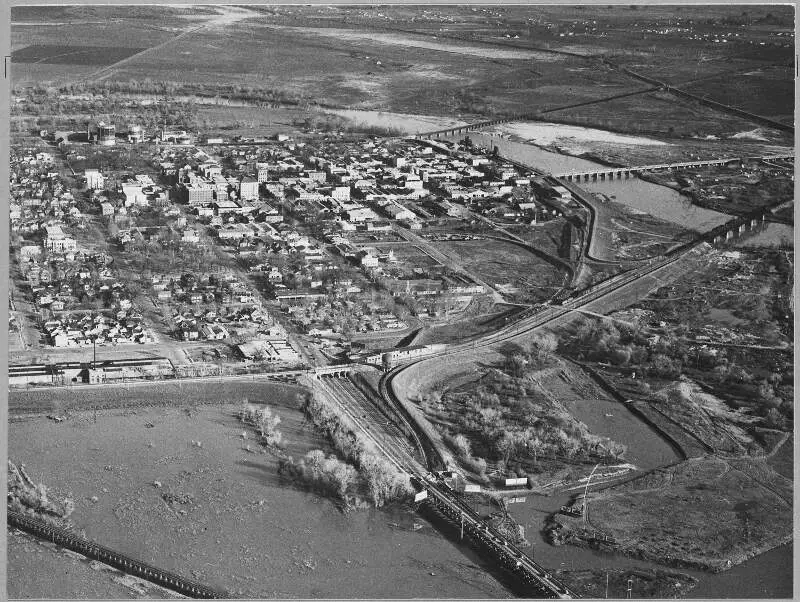
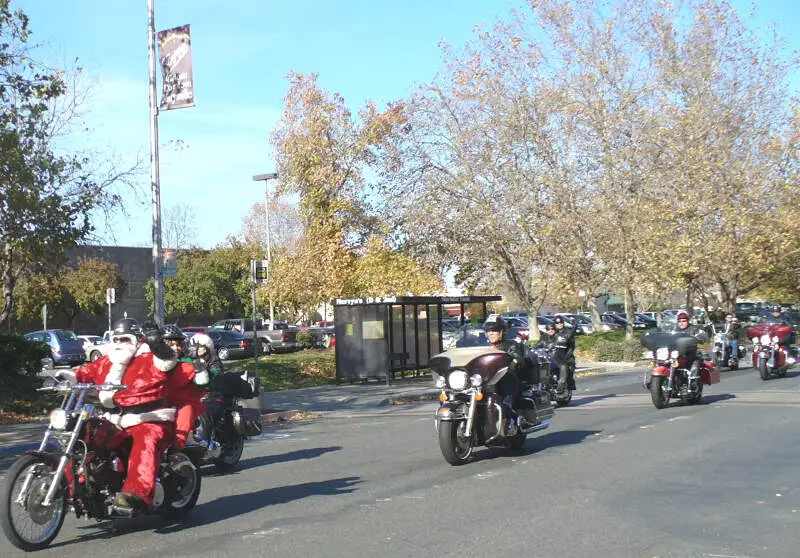
Marysville, CA Photos

Rankings for Marysville in California


Locations Around Marysville
Map Of Marysville, CA
Best Places Around Marysville
Palermo, CA
Population 5,440
Live Oak, CA
Population 16,866
Plumas Lake, CA
Population 8,424
Gridley, CA
Population 7,372
Olivehurst, CA
Population 19,071
Linda, CA
Population 23,215
Marysville Demographics And Statistics
Population over time in Marysville
The current population in Marysville is 12,703. The population has increased 3.3% from 2010.
| Year | Population | % Change |
|---|---|---|
| 2023 | 12,703 | 0.2% |
| 2022 | 12,681 | 1.8% |
| 2021 | 12,451 | -0.1% |
| 2020 | 12,467 | 1.1% |
| 2019 | 12,327 | 0.4% |
| 2018 | 12,282 | 0.5% |
| 2017 | 12,225 | 0.4% |
| 2016 | 12,176 | 0.1% |
| 2015 | 12,161 | 0.1% |
| 2014 | 12,144 | 0.0% |
| 2013 | 12,144 | -0.3% |
| 2012 | 12,178 | -0.6% |
| 2011 | 12,248 | -0.4% |
| 2010 | 12,295 | - |
Race / Ethnicity in Marysville
Marysville is:
59.3% White with 7,538 White residents.
3.2% African American with 404 African American residents.
0.6% American Indian with 77 American Indian residents.
6.4% Asian with 818 Asian residents.
0.0% Hawaiian with 0 Hawaiian residents.
0.7% Other with 93 Other residents.
6.1% Two Or More with 770 Two Or More residents.
23.6% Hispanic with 3,003 Hispanic residents.
| Race | Marysville | CA | USA |
|---|---|---|---|
| White | 59.3% | 34.6% | 58.2% |
| African American | 3.2% | 5.3% | 12.0% |
| American Indian | 0.6% | 0.3% | 0.5% |
| Asian | 6.4% | 15.1% | 5.7% |
| Hawaiian | 0.0% | 0.3% | 0.2% |
| Other | 0.7% | 0.5% | 0.5% |
| Two Or More | 6.1% | 4.1% | 3.9% |
| Hispanic | 23.6% | 39.8% | 19.0% |
Gender in Marysville
Marysville is 48.0% female with 6,098 female residents.
Marysville is 52.0% male with 6,605 male residents.
| Gender | Marysville | CA | USA |
|---|---|---|---|
| Female | 48.0% | 50.0% | 50.5% |
| Male | 52.0% | 50.0% | 49.5% |
Highest level of educational attainment in Marysville for adults over 25
6.0% of adults in Marysville completed < 9th grade.
8.0% of adults in Marysville completed 9-12th grade.
23.0% of adults in Marysville completed high school / ged.
33.0% of adults in Marysville completed some college.
14.0% of adults in Marysville completed associate's degree.
9.0% of adults in Marysville completed bachelor's degree.
4.0% of adults in Marysville completed master's degree.
2.0% of adults in Marysville completed professional degree.
1.0% of adults in Marysville completed doctorate degree.
| Education | Marysville | CA | USA |
|---|---|---|---|
| < 9th Grade | 6.0% | 8.0% | 5.0% |
| 9-12th Grade | 8.0% | 7.0% | 6.0% |
| High School / GED | 23.0% | 20.0% | 26.0% |
| Some College | 33.0% | 20.0% | 19.0% |
| Associate's Degree | 14.0% | 8.0% | 9.0% |
| Bachelor's Degree | 9.0% | 22.0% | 21.0% |
| Master's Degree | 4.0% | 10.0% | 10.0% |
| Professional Degree | 2.0% | 3.0% | 2.0% |
| Doctorate Degree | 1.0% | 2.0% | 2.0% |
Household Income For Marysville, California
7.0% of households in Marysville earn Less than $10,000.
6.4% of households in Marysville earn $10,000 to $14,999.
9.6% of households in Marysville earn $15,000 to $24,999.
11.4% of households in Marysville earn $25,000 to $34,999.
6.8% of households in Marysville earn $35,000 to $49,999.
21.1% of households in Marysville earn $50,000 to $74,999.
9.6% of households in Marysville earn $75,000 to $99,999.
17.0% of households in Marysville earn $100,000 to $149,999.
3.9% of households in Marysville earn $150,000 to $199,999.
7.2% of households in Marysville earn $200,000 or more.
| Income | Marysville | CA | USA |
|---|---|---|---|
| Less than $10,000 | 7.0% | 4.4% | 4.9% |
| $10,000 to $14,999 | 6.4% | 3.0% | 3.6% |
| $15,000 to $24,999 | 9.6% | 5.2% | 6.6% |
| $25,000 to $34,999 | 11.4% | 5.5% | 6.8% |
| $35,000 to $49,999 | 6.8% | 8.4% | 10.4% |
| $50,000 to $74,999 | 21.1% | 13.3% | 15.7% |
| $75,000 to $99,999 | 9.6% | 11.8% | 12.7% |
| $100,000 to $149,999 | 17.0% | 17.9% | 17.4% |
| $150,000 to $199,999 | 3.9% | 11.1% | 9.3% |
| $200,000 or more | 7.2% | 19.4% | 12.6% |


