Ontario, CA
Demographics And Statistics
Living In Ontario, California Summary
Life in Ontario research summary. HomeSnacks has been using Saturday Night Science to research the quality of life in Ontario over the past nine years using Census, FBI, Zillow, and other primary data sources. Based on the most recently available data, we found the following about life in Ontario:
The population in Ontario is 178,347.
The median home value in Ontario is $663,965.
The median income in Ontario is $82,806.
The cost of living in Ontario is 137 which is 1.4x higher than the national average.
The median rent in Ontario is $1,916.
The unemployment rate in Ontario is 6.0%.
The poverty rate in Ontario is 12.7%.
The average high in Ontario is 76.0° and the average low is 48.8°.
Ontario SnackAbility
Overall SnackAbility
Ontario, CA Crime Report
Crime in Ontario summary. We use data from the FBI to determine the crime rates in Ontario. Key points include:
There were 3,861 total crimes in Ontario in the last reporting year.
The overall crime rate per 100,000 people in Ontario is 2,089.7 / 100k people.
The violent crime rate per 100,000 people in Ontario is 272.2 / 100k people.
The property crime rate per 100,000 people in Ontario is 1,817.5 / 100k people.
Overall, crime in Ontario is -1.39% below the national average.
Total Crimes
Below National Average
Crime In Ontario Comparison Table
| Statistic | Count Raw |
Ontario / 100k People |
California / 100k People |
National / 100k People |
|---|---|---|---|---|
| Total Crimes Per 100K | 3,861 | 2,089.7 | 2,564.5 | 2,119.2 |
| Violent Crime | 503 | 272.2 | 486.0 | 359.0 |
| Murder | 4 | 2.2 | 4.5 | 5.0 |
| Robbery | 143 | 77.4 | 119.1 | 61.0 |
| Aggravated Assault | 275 | 148.8 | 325.8 | 256.0 |
| Property Crime | 3,358 | 1,817.5 | 2,078.4 | 1,760.0 |
| Burglary | 441 | 238.7 | 305.8 | 229.0 |
| Larceny | 2,057 | 1,113.3 | 1,345.2 | 1,272.0 |
| Car Theft | 860 | 465.5 | 427.5 | 259.0 |
Ontario, CA Cost Of Living
Cost of living in Ontario summary. We use data on the cost of living to determine how expensive it is to live in Ontario. Real estate prices drive most of the variance in cost of living around California. Key points include:
The cost of living in Ontario is 137 with 100 being average.
The cost of living in Ontario is 1.4x higher than the national average.
The median home value in Ontario is $663,965.
The median income in Ontario is $82,806.
Ontario's Overall Cost Of Living
Higher Than The National Average
Cost Of Living In Ontario Comparison Table
| Living Expense | Ontario | California | National Average | |
|---|---|---|---|---|
| Overall | 137 | 141 | 100 | |
| Services | 110 | 110 | 100 | |
| Groceries | 115 | 112 | 100 | |
| Health | 98 | 110 | 100 | |
| Housing | 205 | 195 | 100 | |
| Transportation | 125 | 125 | 100 | |
| Utilities | 92 | 128 | 100 | |
Ontario, CA Weather
The average high in Ontario is 76.0° and the average low is 48.8°.
There are 22.0 days of precipitation each year.
Expect an average of 14.2 inches of precipitation each year with 9.0 inches of snow.
| Stat | Ontario |
|---|---|
| Average Annual High | 76.0 |
| Average Annual Low | 48.8 |
| Annual Precipitation Days | 22.0 |
| Average Annual Precipitation | 14.2 |
| Average Annual Snowfall | 9.0 |
Average High
Days of Rain
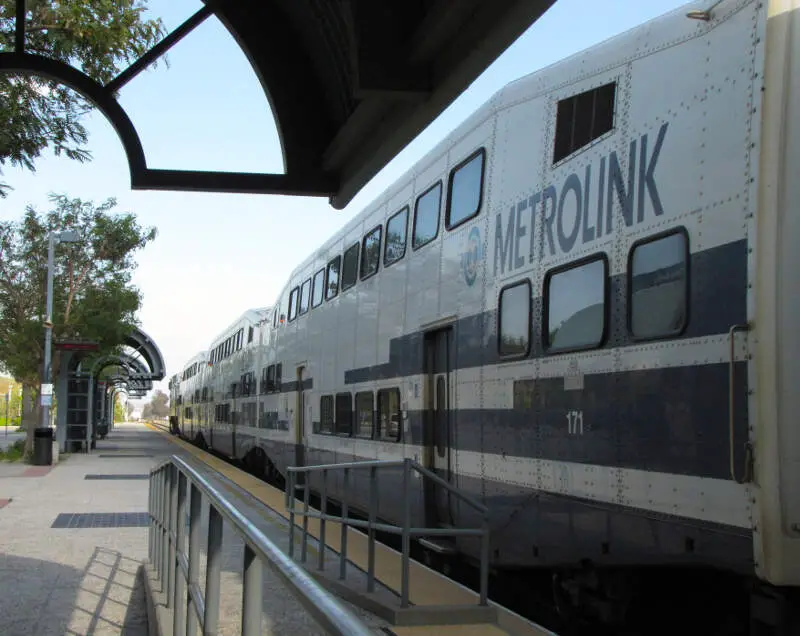
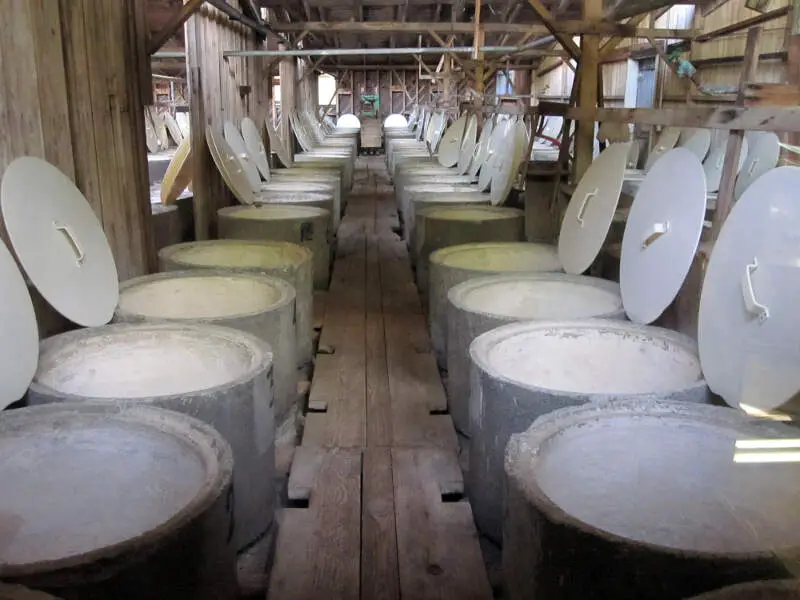
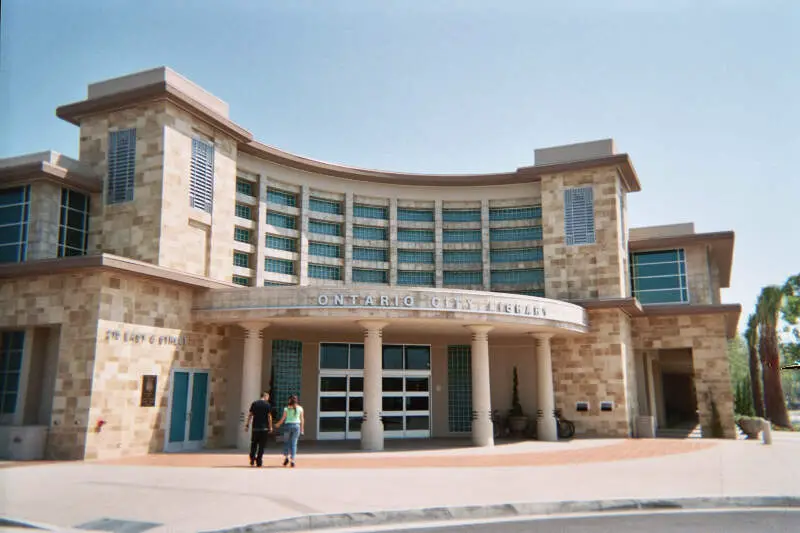
Ontario, CA Photos


Rankings for Ontario in California


Locations Around Ontario
Map Of Ontario, CA
Best Places Around Ontario
Vincent, CA
Population 15,151
Villa Park, CA
Population 5,776
Citrus, CA
Population 10,813
La Verne, CA
Population 30,804
Yorba Linda, CA
Population 67,407
Placentia, CA
Population 52,384
Walnut, CA
Population 27,857
Diamond Bar, CA
Population 53,750
Valinda, CA
Population 21,626
Claremont, CA
Population 36,553
Ontario Demographics And Statistics
Population over time in Ontario
The current population in Ontario is 178,347. The population has increased 7.9% from 2010.
| Year | Population | % Change |
|---|---|---|
| 2023 | 178,347 | 1.1% |
| 2022 | 176,326 | 0.6% |
| 2021 | 175,223 | -1.7% |
| 2020 | 178,194 | 0.8% |
| 2019 | 176,760 | 1.8% |
| 2018 | 173,580 | 1.5% |
| 2017 | 171,041 | 1.0% |
| 2016 | 169,389 | 0.7% |
| 2015 | 168,218 | 0.8% |
| 2014 | 166,892 | 0.7% |
| 2013 | 165,702 | 0.3% |
| 2012 | 165,260 | 0.1% |
| 2011 | 165,120 | -0.1% |
| 2010 | 165,215 | - |
Race / Ethnicity in Ontario
Ontario is:
13.7% White with 24,519 White residents.
6.0% African American with 10,763 African American residents.
0.2% American Indian with 294 American Indian residents.
8.3% Asian with 14,828 Asian residents.
0.3% Hawaiian with 497 Hawaiian residents.
0.4% Other with 702 Other residents.
2.8% Two Or More with 4,988 Two Or More residents.
68.3% Hispanic with 121,756 Hispanic residents.
| Race | Ontario | CA | USA |
|---|---|---|---|
| White | 13.7% | 34.6% | 58.2% |
| African American | 6.0% | 5.3% | 12.0% |
| American Indian | 0.2% | 0.3% | 0.5% |
| Asian | 8.3% | 15.1% | 5.7% |
| Hawaiian | 0.3% | 0.3% | 0.2% |
| Other | 0.4% | 0.5% | 0.5% |
| Two Or More | 2.8% | 4.1% | 3.9% |
| Hispanic | 68.3% | 39.8% | 19.0% |
Gender in Ontario
Ontario is 51.0% female with 91,020 female residents.
Ontario is 49.0% male with 87,327 male residents.
| Gender | Ontario | CA | USA |
|---|---|---|---|
| Female | 51.0% | 50.0% | 50.5% |
| Male | 49.0% | 50.0% | 49.5% |
Highest level of educational attainment in Ontario for adults over 25
11.0% of adults in Ontario completed < 9th grade.
10.0% of adults in Ontario completed 9-12th grade.
27.0% of adults in Ontario completed high school / ged.
22.0% of adults in Ontario completed some college.
9.0% of adults in Ontario completed associate's degree.
15.0% of adults in Ontario completed bachelor's degree.
4.0% of adults in Ontario completed master's degree.
1.0% of adults in Ontario completed professional degree.
1.0% of adults in Ontario completed doctorate degree.
| Education | Ontario | CA | USA |
|---|---|---|---|
| < 9th Grade | 11.0% | 8.0% | 5.0% |
| 9-12th Grade | 10.0% | 7.0% | 6.0% |
| High School / GED | 27.0% | 20.0% | 26.0% |
| Some College | 22.0% | 20.0% | 19.0% |
| Associate's Degree | 9.0% | 8.0% | 9.0% |
| Bachelor's Degree | 15.0% | 22.0% | 21.0% |
| Master's Degree | 4.0% | 10.0% | 10.0% |
| Professional Degree | 1.0% | 3.0% | 2.0% |
| Doctorate Degree | 1.0% | 2.0% | 2.0% |
Household Income For Ontario, California
4.0% of households in Ontario earn Less than $10,000.
2.2% of households in Ontario earn $10,000 to $14,999.
5.7% of households in Ontario earn $15,000 to $24,999.
5.9% of households in Ontario earn $25,000 to $34,999.
8.7% of households in Ontario earn $35,000 to $49,999.
18.6% of households in Ontario earn $50,000 to $74,999.
13.6% of households in Ontario earn $75,000 to $99,999.
21.2% of households in Ontario earn $100,000 to $149,999.
11.2% of households in Ontario earn $150,000 to $199,999.
9.1% of households in Ontario earn $200,000 or more.
| Income | Ontario | CA | USA |
|---|---|---|---|
| Less than $10,000 | 4.0% | 4.4% | 4.9% |
| $10,000 to $14,999 | 2.2% | 3.0% | 3.6% |
| $15,000 to $24,999 | 5.7% | 5.2% | 6.6% |
| $25,000 to $34,999 | 5.9% | 5.5% | 6.8% |
| $35,000 to $49,999 | 8.7% | 8.4% | 10.4% |
| $50,000 to $74,999 | 18.6% | 13.3% | 15.7% |
| $75,000 to $99,999 | 13.6% | 11.8% | 12.7% |
| $100,000 to $149,999 | 21.2% | 17.9% | 17.4% |
| $150,000 to $199,999 | 11.2% | 11.1% | 9.3% |
| $200,000 or more | 9.1% | 19.4% | 12.6% |


