Oxnard SnackAbility
Overall SnackAbility
Crime in Oxnard summary. We use data from the FBI to determine the crime rates in Oxnard. Key points include:
There were 4,882 total crimes in Oxnard in the last reporting year.
The overall crime rate per 100,000 people in Oxnard is 2,473.6 / 100k people.
The violent crime rate per 100,000 people in Oxnard is 596.4 / 100k people.
The property crime rate per 100,000 people in Oxnard is 1,877.3 / 100k people.
Overall, crime in Oxnard is 16.72% above the national average.
Total Crimes
Above National Average
Crime In Oxnard Comparison Table
| Statistic | Count Raw |
Oxnard / 100k People |
California / 100k People |
National / 100k People |
|---|---|---|---|---|
| Total Crimes Per 100K | 4,882 | 2,473.6 | 2,564.5 | 2,119.2 |
| Violent Crime | 1,177 | 596.4 | 486.0 | 359.0 |
| Murder | 6 | 3.0 | 4.5 | 5.0 |
| Robbery | 234 | 118.6 | 119.1 | 61.0 |
| Aggravated Assault | 872 | 441.8 | 325.8 | 256.0 |
| Property Crime | 3,705 | 1,877.3 | 2,078.4 | 1,760.0 |
| Burglary | 396 | 200.6 | 305.8 | 229.0 |
| Larceny | 2,596 | 1,315.4 | 1,345.2 | 1,272.0 |
| Car Theft | 713 | 361.3 | 427.5 | 259.0 |
Source: FBI Uniform Crime Reporting (2024)
Cost of living in Oxnard summary. We use data on the cost of living to determine how expensive it is to live in Oxnard. Real estate prices drive most of the variance in cost of living around California. Key points include:
The cost of living in Oxnard is 152 with 100 being average.
The cost of living in Oxnard is 1.5x higher than the national average.
The median home value in Oxnard is $767,290.
The median income in Oxnard is $96,212.
Oxnard's Overall Cost Of Living
Higher Than The National Average
Cost Of Living In Oxnard Comparison Table
| Living Expense | Oxnard | California | National Average |
|---|---|---|---|
| Overall | 152 | 142 | 100 |
| Services | 114 | 110 | 100 |
| Groceries | 114 | 118 | 100 |
| Health | 238 | 197 | 100 |
| Housing | 120 | 120 | 100 |
| Transportation | 120 | 121 | 100 |
| Utilities | 125 | 121 | 100 |
Source: Cost of living index, normalized to US average = 100
Oxnard, CA Weather
The average high in Oxnard is 72.0° and the average low is 51.7°.
There are 24.0 days of precipitation each year.
Expect an average of 17.2 inches of precipitation each year with 0.0 inches of snow.
| Stat | Oxnard |
|---|---|
| Average Annual High | 72.0 |
| Average Annual Low | 51.7 |
| Annual Precipitation Days | 24.0 |
| Average Annual Precipitation | 17.2 |
| Average Annual Snowfall | 0.0 |
Average High
Days of Rain
Source: NOAA climate normals (30-year)
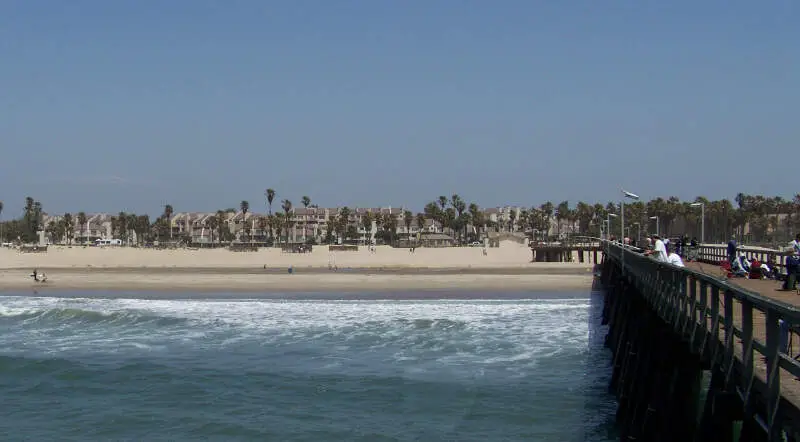
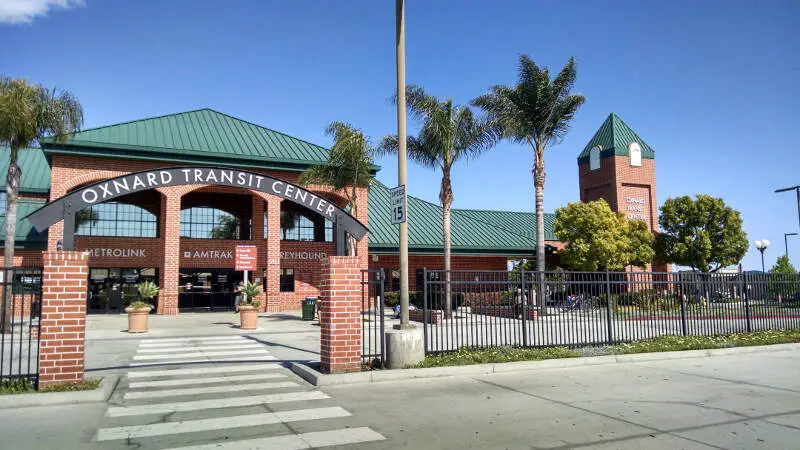
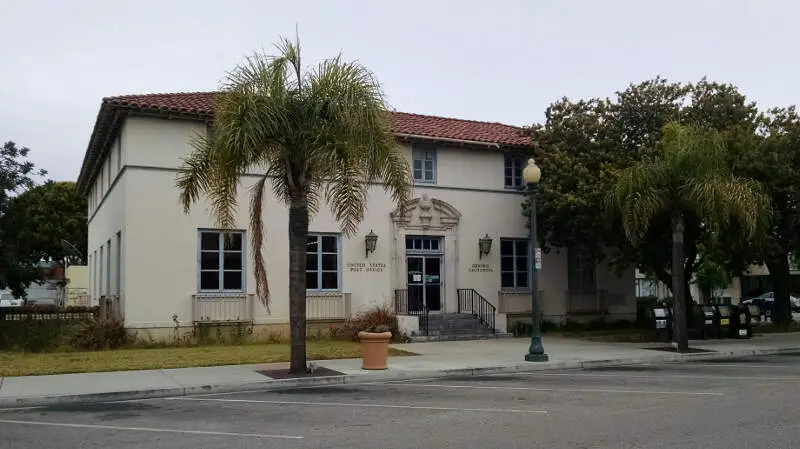
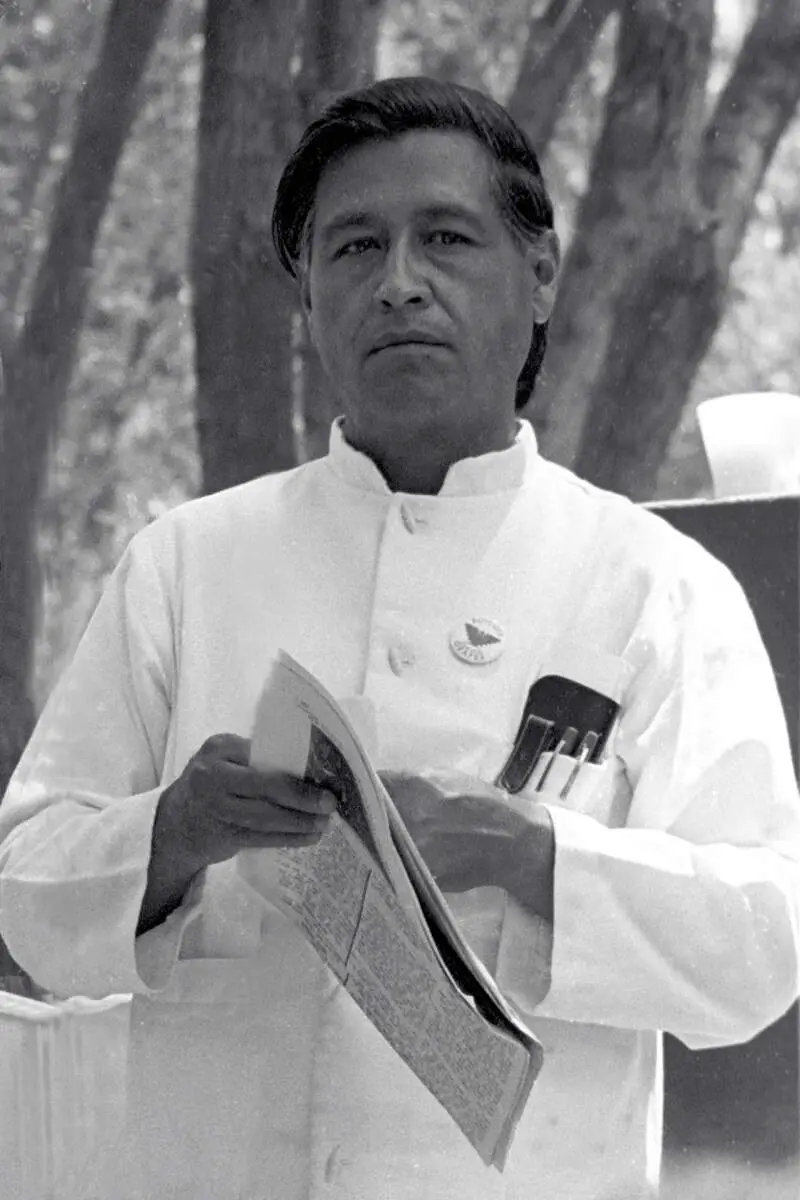
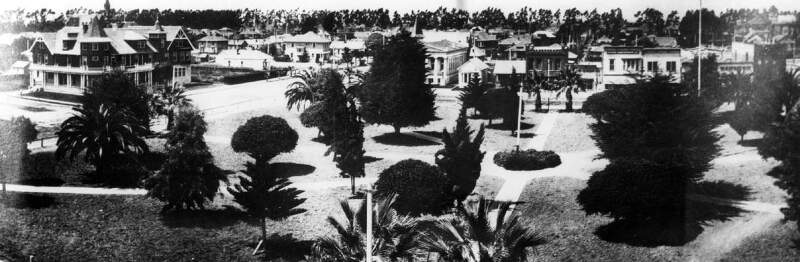
Oxnard, CA Photos


2 Reviews & Comments About Oxnard

I love this town because there's always something to do! Weather it's going to the beach or walking your dogs at the park, you can always find entertainment.
Whenever I try out a new place to eat or store to go, the staff is always friendly an they make me feel welcome.
The roads and infrastructure in Oxnard are horrible and traffic is too congested. The crime rate is too high and the primary language is Spanish, so it is impossible to communicate with anyone if you do not speak Spanish. The education system is failing and the residents don't seem to value education enough to address the problem.
What stood out most is the fact that nobody seems to know how to drive. They constantly turn left at a red light and I managed to avoid a collision daily during the time that I was there. If I had been in an accident, I probably would not have been able to communicate with the other driver since nobody seems to speak English in Oxnard anymore.
Rankings & Articles For Oxnard


Locations Around Oxnard
Map Of Oxnard, CA
Best Places Around Oxnard
Camarillo, CA
Population 70,186
Moorpark, CA
Population 35,854
Thousand Oaks, CA
Population 125,205
Mira Monte, CA
Population 6,888
Port Hueneme, CA
Population 21,582
El Rio, CA
Population 6,368
Santa Paula, CA
Population 31,376
Ojai, CA
Population 7,577
Oxnard Demographics And Statistics
Population over time in Oxnard
The current population in Oxnard is 200,928. The population has increased 4.4% from 2010.
| Year | Population | % Change |
|---|---|---|
| 2024 | 200,928 | -0.0% |
| 2023 | 201,014 | -0.6% |
| 2022 | 202,279 | -0.3% |
| 2021 | 202,981 | -2.3% |
| 2020 | 207,722 | -0.2% |
| 2019 | 208,154 | 0.3% |
| 2018 | 207,568 | 0.4% |
| 2017 | 206,732 | 1.0% |
| 2016 | 204,752 | 0.6% |
| 2015 | 203,495 | 0.9% |
| 2014 | 201,744 | 1.1% |
| 2013 | 199,574 | 1.1% |
| 2012 | 197,456 | 1.3% |
| 2011 | 194,972 | 1.3% |
| 2010 | 192,520 | - |
Race / Ethnicity in Oxnard
See the full breakdown
Oxnard is:
12.5% White with 25,147 White residents.
1.5% African American with 3,043 African American residents.
0.2% American Indian with 458 American Indian residents.
6.4% Asian with 12,795 Asian residents.
0.2% Hawaiian with 373 Hawaiian residents.
0.2% Other with 499 Other residents.
1.8% Two Or More with 3,617 Two Or More residents.
77.1% Hispanic with 154,996 Hispanic residents.
| Race | Oxnard | CA | USA |
|---|---|---|---|
| White | 12.5% | 33.8% | 57.4% |
| African American | 1.5% | 5.2% | 11.9% |
| American Indian | 0.2% | 0.3% | 0.5% |
| Asian | 6.4% | 15.3% | 5.9% |
| Hawaiian | 0.2% | 0.3% | 0.2% |
| Other | 0.2% | 0.6% | 0.6% |
| Two Or More | 1.8% | 4.4% | 4.3% |
| Hispanic | 77.1% | 40.2% | 19.3% |
Gender in Oxnard
See the full breakdown
Oxnard is 49.5% female with 99,361 female residents.
Oxnard is 50.5% male with 101,566 male residents.
| Gender | Oxnard | CA | USA |
|---|---|---|---|
| Female | 49.5% | 50.1% | 50.5% |
| Male | 50.5% | 49.9% | 49.5% |
Highest level of educational attainment in Oxnard for adults over 25
See the full breakdown
21.0% of adults in Oxnard completed < 9th grade.
10.0% of adults in Oxnard completed 9-12th grade.
25.0% of adults in Oxnard completed high school / ged.
18.0% of adults in Oxnard completed some college.
7.0% of adults in Oxnard completed associate's degree.
13.0% of adults in Oxnard completed bachelor's degree.
4.0% of adults in Oxnard completed master's degree.
1.0% of adults in Oxnard completed professional degree.
1.0% of adults in Oxnard completed doctorate degree.
| Education | Oxnard | CA | USA |
|---|---|---|---|
| < 9th Grade | 21.0% | 8.0% | 4.0% |
| 9-12th Grade | 10.0% | 7.0% | 6.0% |
| High School / GED | 25.0% | 20.0% | 26.0% |
| Some College | 18.0% | 19.0% | 19.0% |
| Associate's Degree | 7.0% | 8.0% | 9.0% |
| Bachelor's Degree | 13.0% | 23.0% | 22.0% |
| Master's Degree | 4.0% | 10.0% | 10.0% |
| Professional Degree | 1.0% | 3.0% | 2.0% |
| Doctorate Degree | 1.0% | 2.0% | 2.0% |
Household Income For Oxnard, California
See the full breakdown
3.0% of households in Oxnard earn Less than $10,000.
1.9% of households in Oxnard earn $10,000 to $14,999.
3.7% of households in Oxnard earn $15,000 to $24,999.
5.3% of households in Oxnard earn $25,000 to $34,999.
9.3% of households in Oxnard earn $35,000 to $49,999.
14.9% of households in Oxnard earn $50,000 to $74,999.
14.1% of households in Oxnard earn $75,000 to $99,999.
21.8% of households in Oxnard earn $100,000 to $149,999.
11.5% of households in Oxnard earn $150,000 to $199,999.
14.6% of households in Oxnard earn $200,000 or more.
| Income | Oxnard | CA | USA |
|---|---|---|---|
| Less than $10,000 | 3.0% | 4.5% | 5.0% |
| $10,000 to $14,999 | 1.9% | 2.9% | 3.4% |
| $15,000 to $24,999 | 3.7% | 5.0% | 6.3% |
| $25,000 to $34,999 | 5.3% | 5.3% | 6.6% |
| $35,000 to $49,999 | 9.3% | 8.1% | 10.1% |
| $50,000 to $74,999 | 14.9% | 13.0% | 15.5% |
| $75,000 to $99,999 | 14.1% | 11.6% | 12.6% |
| $100,000 to $149,999 | 21.8% | 17.8% | 17.5% |
| $150,000 to $199,999 | 11.5% | 11.3% | 9.6% |
| $200,000 or more | 14.6% | 20.5% | 13.4% |
Source: U.S. Census ACS 5-year estimates (2024)


