Thousand Oaks SnackAbility
Overall SnackAbility
Crime in Thousand Oaks summary. We use data from the FBI to determine the crime rates in Thousand Oaks. Key points include:
There were 1,374 total crimes in Thousand Oaks in the last reporting year.
The overall crime rate per 100,000 people in Thousand Oaks is 1,122.9 / 100k people.
The violent crime rate per 100,000 people in Thousand Oaks is 102.2 / 100k people.
The property crime rate per 100,000 people in Thousand Oaks is 1,020.7 / 100k people.
Overall, crime in Thousand Oaks is -47.01% below the national average.
Total Crimes
Below National Average
Crime In Thousand Oaks Comparison Table
| Statistic | Count Raw |
Thousand Oaks / 100k People |
California / 100k People |
National / 100k People |
|---|---|---|---|---|
| Total Crimes Per 100K | 1,374 | 1,122.9 | 2,564.5 | 2,119.2 |
| Violent Crime | 125 | 102.2 | 486.0 | 359.0 |
| Murder | 3 | 2.5 | 4.5 | 5.0 |
| Robbery | 23 | 18.8 | 119.1 | 61.0 |
| Aggravated Assault | 91 | 74.4 | 325.8 | 256.0 |
| Property Crime | 1,249 | 1,020.7 | 2,078.4 | 1,760.0 |
| Burglary | 153 | 125.0 | 305.8 | 229.0 |
| Larceny | 1,027 | 839.3 | 1,345.2 | 1,272.0 |
| Car Theft | 69 | 56.4 | 427.5 | 259.0 |
Source: FBI Uniform Crime Reporting (2024)
Cost of living in Thousand Oaks summary. We use data on the cost of living to determine how expensive it is to live in Thousand Oaks. Real estate prices drive most of the variance in cost of living around California. Key points include:
The cost of living in Thousand Oaks is 190 with 100 being average.
The cost of living in Thousand Oaks is 1.9x higher than the national average.
The median home value in Thousand Oaks is $1,049,633.
The median income in Thousand Oaks is $135,603.
Thousand Oaks's Overall Cost Of Living
Higher Than The National Average
Cost Of Living In Thousand Oaks Comparison Table
| Living Expense | Thousand Oaks | California | National Average |
|---|---|---|---|
| Overall | 190 | 142 | 100 |
| Services | 112 | 110 | 100 |
| Groceries | 118 | 118 | 100 |
| Health | 356 | 197 | 100 |
| Housing | 124 | 120 | 100 |
| Transportation | 120 | 121 | 100 |
| Utilities | 124 | 121 | 100 |
Source: Cost of living index, normalized to US average = 100
Thousand Oaks, CA Weather
The average high in Thousand Oaks is 72.0° and the average low is 51.7°.
There are 24.0 days of precipitation each year.
Expect an average of 17.2 inches of precipitation each year with 0.0 inches of snow.
| Stat | Thousand Oaks |
|---|---|
| Average Annual High | 72.0 |
| Average Annual Low | 51.7 |
| Annual Precipitation Days | 24.0 |
| Average Annual Precipitation | 17.2 |
| Average Annual Snowfall | 0.0 |
Average High
Days of Rain
Source: NOAA climate normals (30-year)
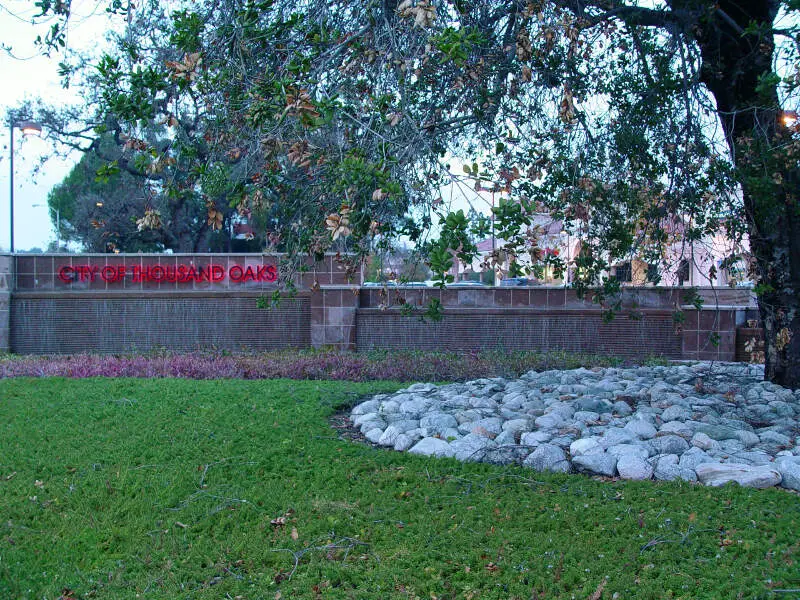
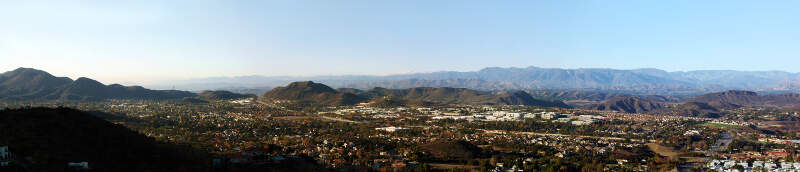
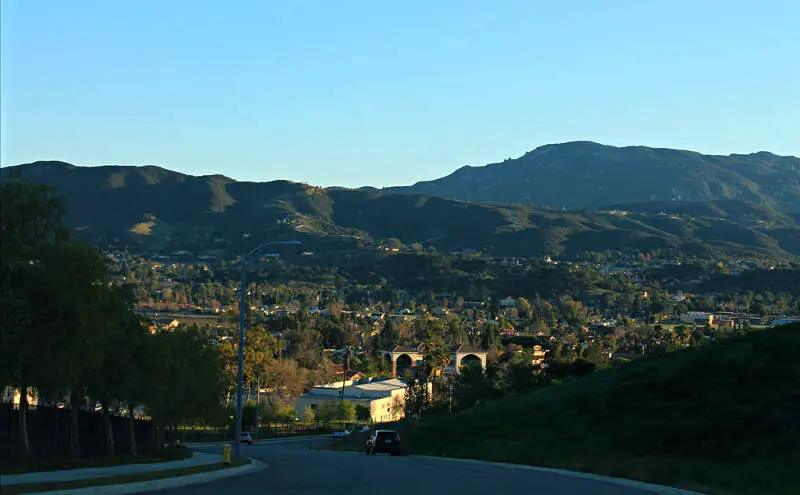
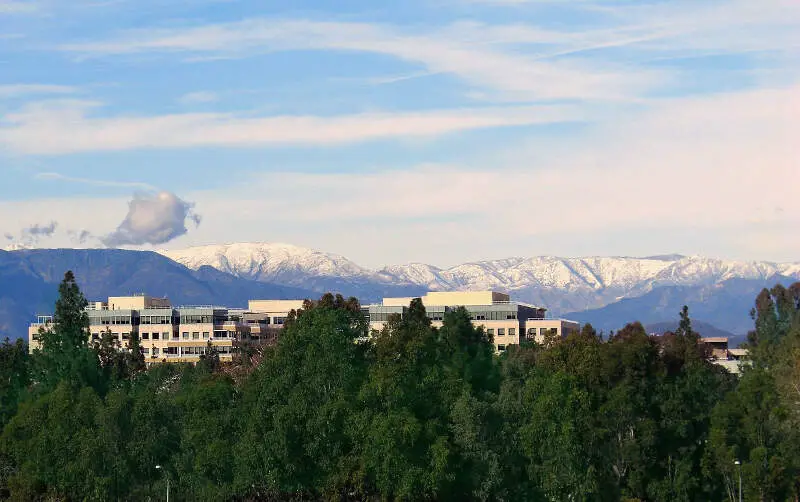
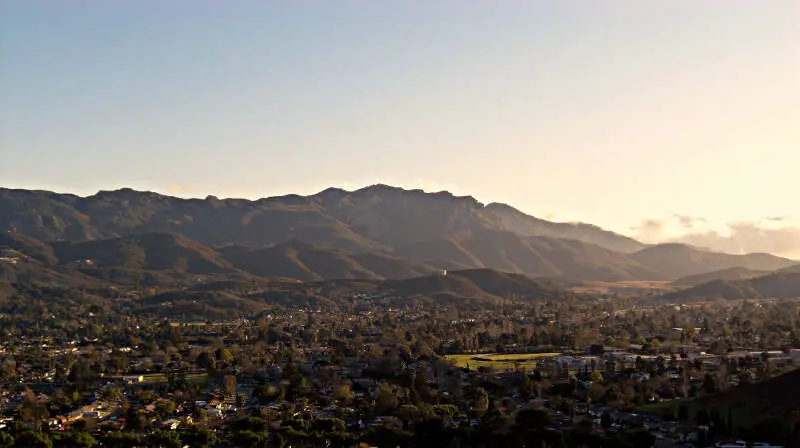
Thousand Oaks, CA Photos


Rankings & Articles For Thousand Oaks


Locations Around Thousand Oaks
Map Of Thousand Oaks, CA
Best Places Around Thousand Oaks
Camarillo, CA
Population 70,186
Agoura Hills, CA
Population 19,721
Moorpark, CA
Population 35,854
Oak Park, CA
Population 13,757
Simi Valley, CA
Population 125,634
Calabasas, CA
Population 22,669
Fillmore, CA
Population 16,816
Oxnard, CA
Population 200,928
Port Hueneme, CA
Population 21,582
El Rio, CA
Population 6,368
Thousand Oaks Demographics And Statistics
Population over time in Thousand Oaks
The current population in Thousand Oaks is 125,205. The population has increased 0.4% from 2010.
| Year | Population | % Change |
|---|---|---|
| 2024 | 125,205 | -0.4% |
| 2023 | 125,676 | -0.7% |
| 2022 | 126,532 | -0.6% |
| 2021 | 127,274 | -0.3% |
| 2020 | 127,648 | -0.2% |
| 2019 | 127,873 | -0.5% |
| 2018 | 128,481 | -0.3% |
| 2017 | 128,909 | 0.2% |
| 2016 | 128,623 | 0.0% |
| 2015 | 128,565 | 0.3% |
| 2014 | 128,126 | 0.6% |
| 2013 | 127,356 | 0.6% |
| 2012 | 126,570 | 0.7% |
| 2011 | 125,633 | 0.8% |
| 2010 | 124,671 | - |
Race / Ethnicity in Thousand Oaks
See the full breakdown
Thousand Oaks is:
62.3% White with 77,998 White residents.
1.8% African American with 2,290 African American residents.
0.1% American Indian with 107 American Indian residents.
8.7% Asian with 10,890 Asian residents.
0.1% Hawaiian with 63 Hawaiian residents.
1.1% Other with 1,420 Other residents.
5.3% Two Or More with 6,602 Two Or More residents.
20.6% Hispanic with 25,835 Hispanic residents.
| Race | Thousand Oaks | CA | USA |
|---|---|---|---|
| White | 62.3% | 33.8% | 57.4% |
| African American | 1.8% | 5.2% | 11.9% |
| American Indian | 0.1% | 0.3% | 0.5% |
| Asian | 8.7% | 15.3% | 5.9% |
| Hawaiian | 0.1% | 0.3% | 0.2% |
| Other | 1.1% | 0.6% | 0.6% |
| Two Or More | 5.3% | 4.4% | 4.3% |
| Hispanic | 20.6% | 40.2% | 19.3% |
Gender in Thousand Oaks
See the full breakdown
Thousand Oaks is 50.5% female with 63,243 female residents.
Thousand Oaks is 49.5% male with 61,962 male residents.
| Gender | Thousand Oaks | CA | USA |
|---|---|---|---|
| Female | 50.5% | 50.1% | 50.5% |
| Male | 49.5% | 49.9% | 49.5% |
Highest level of educational attainment in Thousand Oaks for adults over 25
See the full breakdown
3.0% of adults in Thousand Oaks completed < 9th grade.
3.0% of adults in Thousand Oaks completed 9-12th grade.
15.0% of adults in Thousand Oaks completed high school / ged.
18.0% of adults in Thousand Oaks completed some college.
10.0% of adults in Thousand Oaks completed associate's degree.
30.0% of adults in Thousand Oaks completed bachelor's degree.
14.0% of adults in Thousand Oaks completed master's degree.
4.0% of adults in Thousand Oaks completed professional degree.
3.0% of adults in Thousand Oaks completed doctorate degree.
| Education | Thousand Oaks | CA | USA |
|---|---|---|---|
| < 9th Grade | 3.0% | 8.0% | 4.0% |
| 9-12th Grade | 3.0% | 7.0% | 6.0% |
| High School / GED | 15.0% | 20.0% | 26.0% |
| Some College | 18.0% | 19.0% | 19.0% |
| Associate's Degree | 10.0% | 8.0% | 9.0% |
| Bachelor's Degree | 30.0% | 23.0% | 22.0% |
| Master's Degree | 14.0% | 10.0% | 10.0% |
| Professional Degree | 4.0% | 3.0% | 2.0% |
| Doctorate Degree | 3.0% | 2.0% | 2.0% |
Household Income For Thousand Oaks, California
See the full breakdown
4.6% of households in Thousand Oaks earn Less than $10,000.
1.7% of households in Thousand Oaks earn $10,000 to $14,999.
3.1% of households in Thousand Oaks earn $15,000 to $24,999.
3.4% of households in Thousand Oaks earn $25,000 to $34,999.
6.2% of households in Thousand Oaks earn $35,000 to $49,999.
10.2% of households in Thousand Oaks earn $50,000 to $74,999.
9.8% of households in Thousand Oaks earn $75,000 to $99,999.
16.7% of households in Thousand Oaks earn $100,000 to $149,999.
12.2% of households in Thousand Oaks earn $150,000 to $199,999.
32.2% of households in Thousand Oaks earn $200,000 or more.
| Income | Thousand Oaks | CA | USA |
|---|---|---|---|
| Less than $10,000 | 4.6% | 4.5% | 5.0% |
| $10,000 to $14,999 | 1.7% | 2.9% | 3.4% |
| $15,000 to $24,999 | 3.1% | 5.0% | 6.3% |
| $25,000 to $34,999 | 3.4% | 5.3% | 6.6% |
| $35,000 to $49,999 | 6.2% | 8.1% | 10.1% |
| $50,000 to $74,999 | 10.2% | 13.0% | 15.5% |
| $75,000 to $99,999 | 9.8% | 11.6% | 12.6% |
| $100,000 to $149,999 | 16.7% | 17.8% | 17.5% |
| $150,000 to $199,999 | 12.2% | 11.3% | 9.6% |
| $200,000 or more | 32.2% | 20.5% | 13.4% |
Source: U.S. Census ACS 5-year estimates (2024)


