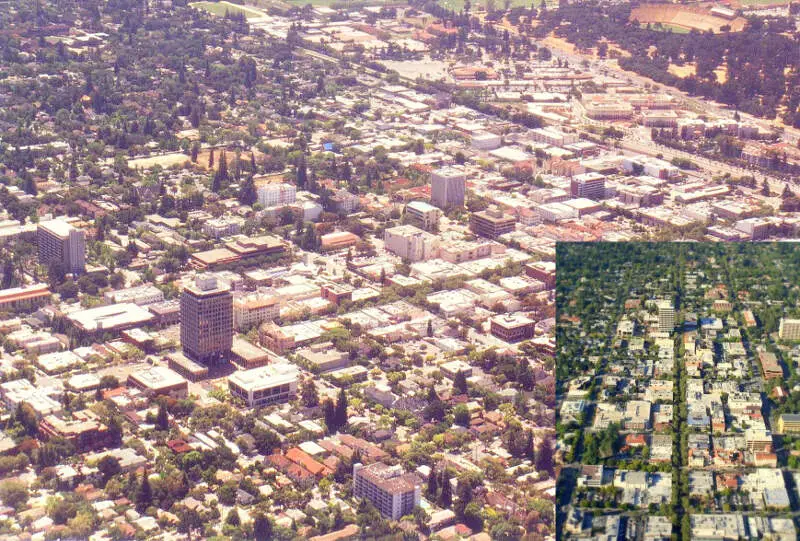
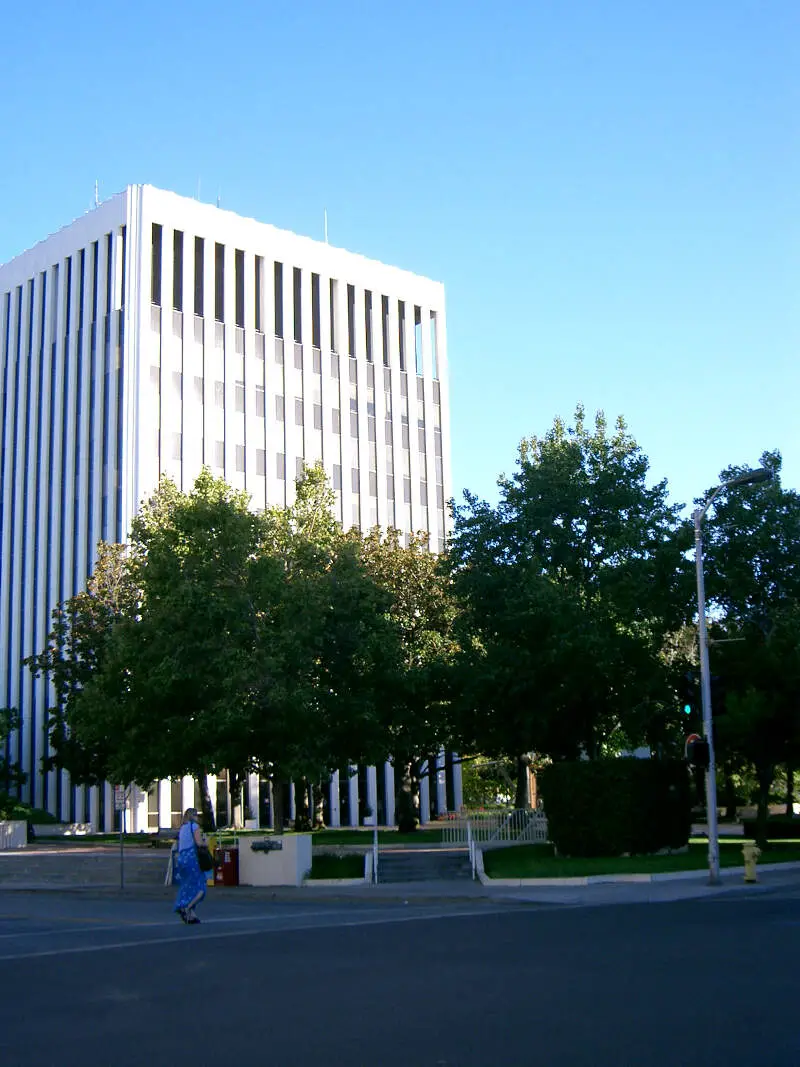
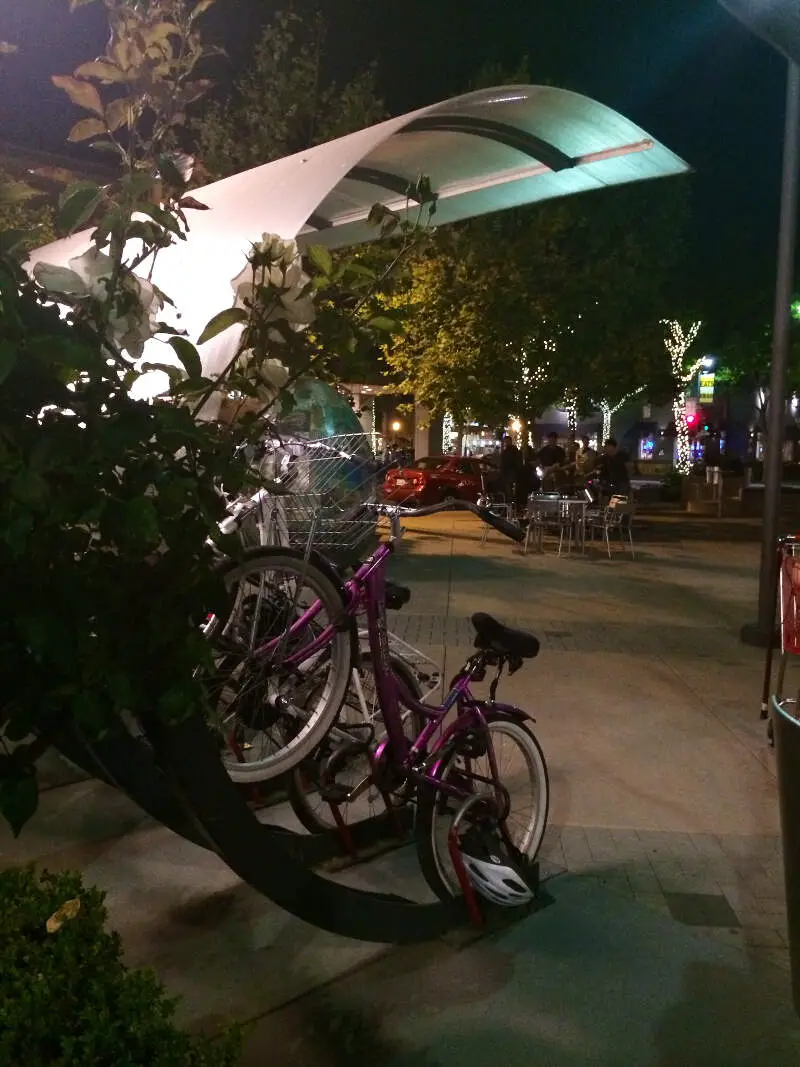
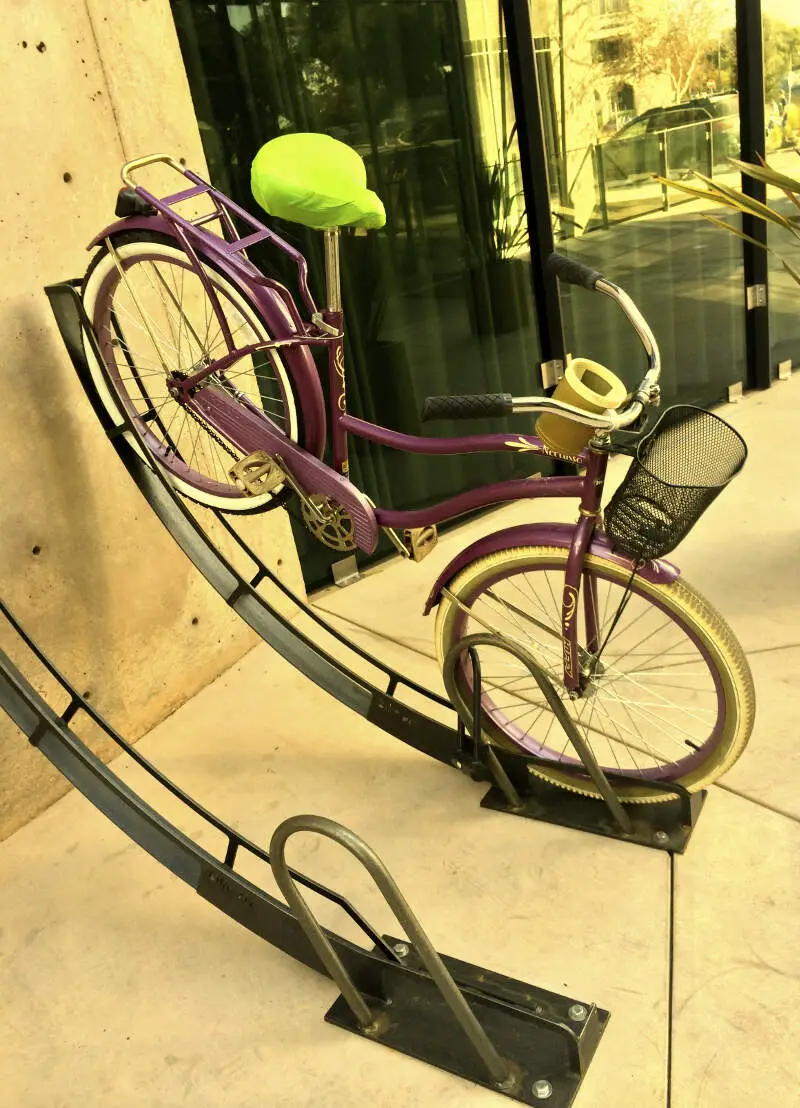
Palo Alto, CA
Demographics And Statistics
Living In Palo Alto, California Summary
Life in Palo Alto research summary. HomeSnacks has been using Saturday Night Science to research the quality of life in Palo Alto over the past nine years using Census, FBI, Zillow, and other primary data sources. Based on the most recently available data, we found the following about life in Palo Alto:
The population in Palo Alto is 67,231.
The median home value in Palo Alto is $3,453,770.
The median income in Palo Alto is $220,408.
The cost of living in Palo Alto is 334 which is 3.3x higher than the national average.
The median rent in Palo Alto is $3,328.
The unemployment rate in Palo Alto is 3.7%.
The poverty rate in Palo Alto is 5.4%.
The average high in Palo Alto is 71.1° and the average low is 48.8°.
Palo Alto SnackAbility
Overall SnackAbility
Palo Alto, CA Crime Report
Crime in Palo Alto summary. We use data from the FBI to determine the crime rates in Palo Alto. Key points include:
There were 2,112 total crimes in Palo Alto in the last reporting year.
The overall crime rate per 100,000 people in Palo Alto is 3,245.3 / 100k people.
The violent crime rate per 100,000 people in Palo Alto is 212.0 / 100k people.
The property crime rate per 100,000 people in Palo Alto is 3,033.2 / 100k people.
Overall, crime in Palo Alto is 53.13% above the national average.
Total Crimes
Above National Average
Crime In Palo Alto Comparison Table
| Statistic | Count Raw |
Palo Alto / 100k People |
California / 100k People |
National / 100k People |
|---|---|---|---|---|
| Total Crimes Per 100K | 2,112 | 3,245.3 | 2,564.5 | 2,119.2 |
| Violent Crime | 138 | 212.0 | 486.0 | 359.0 |
| Murder | 1 | 1.5 | 4.5 | 5.0 |
| Robbery | 35 | 53.8 | 119.1 | 61.0 |
| Aggravated Assault | 77 | 118.3 | 325.8 | 256.0 |
| Property Crime | 1,974 | 3,033.2 | 2,078.4 | 1,760.0 |
| Burglary | 147 | 225.9 | 305.8 | 229.0 |
| Larceny | 1,707 | 2,623.0 | 1,345.2 | 1,272.0 |
| Car Theft | 120 | 184.4 | 427.5 | 259.0 |
Palo Alto, CA Cost Of Living
Cost of living in Palo Alto summary. We use data on the cost of living to determine how expensive it is to live in Palo Alto. Real estate prices drive most of the variance in cost of living around California. Key points include:
The cost of living in Palo Alto is 334 with 100 being average.
The cost of living in Palo Alto is 3.3x higher than the national average.
The median home value in Palo Alto is $3,453,770.
The median income in Palo Alto is $220,408.
Palo Alto's Overall Cost Of Living
Higher Than The National Average
Cost Of Living In Palo Alto Comparison Table
| Living Expense | Palo Alto | California | National Average | |
|---|---|---|---|---|
| Overall | 334 | 141 | 100 | |
| Services | 106 | 110 | 100 | |
| Groceries | 114 | 112 | 100 | |
| Health | 122 | 110 | 100 | |
| Housing | 841 | 195 | 100 | |
| Transportation | 130 | 125 | 100 | |
| Utilities | 132 | 128 | 100 | |
Palo Alto, CA Weather
The average high in Palo Alto is 71.1° and the average low is 48.8°.
There are 37.9 days of precipitation each year.
Expect an average of 17.4 inches of precipitation each year with 1.6 inches of snow.
| Stat | Palo Alto |
|---|---|
| Average Annual High | 71.1 |
| Average Annual Low | 48.8 |
| Annual Precipitation Days | 37.9 |
| Average Annual Precipitation | 17.4 |
| Average Annual Snowfall | 1.6 |
Average High
Days of Rain
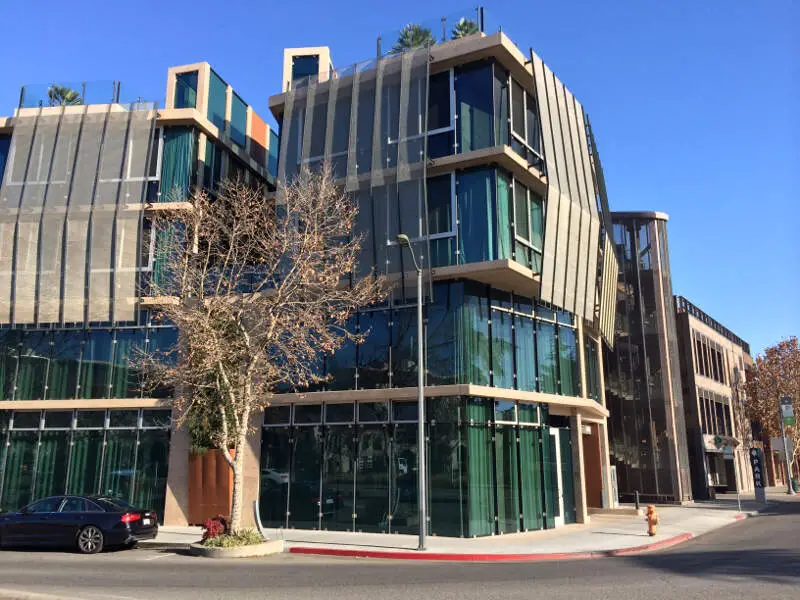
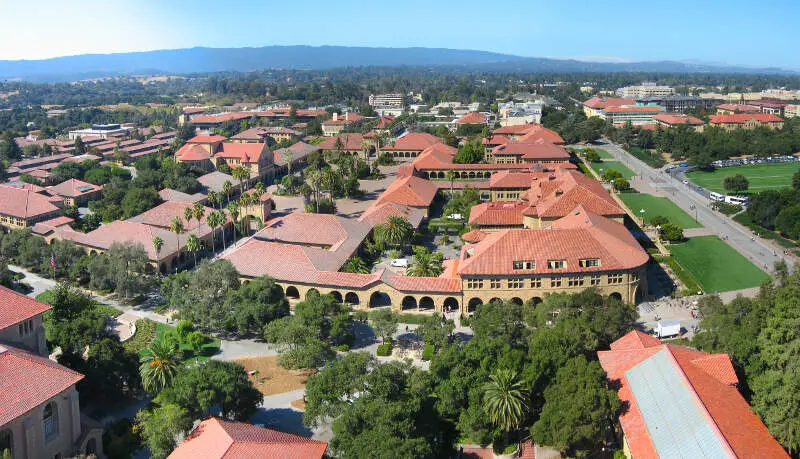
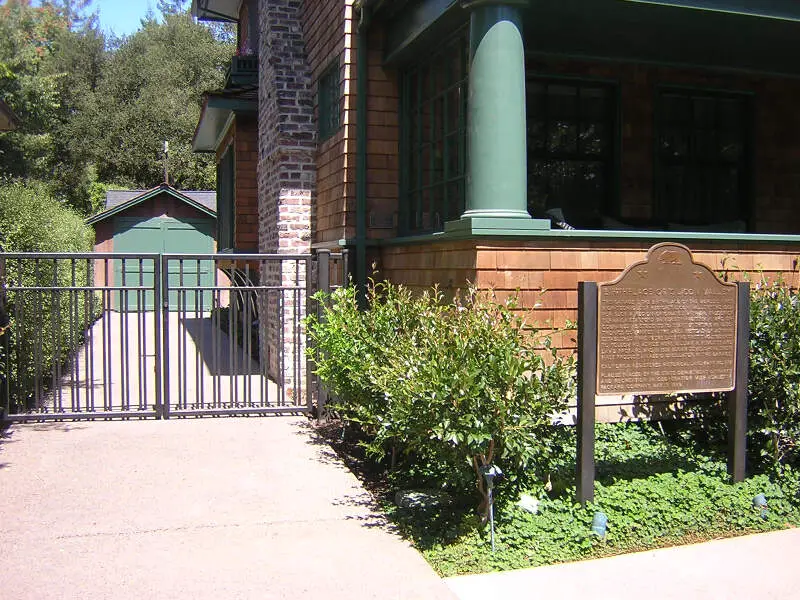
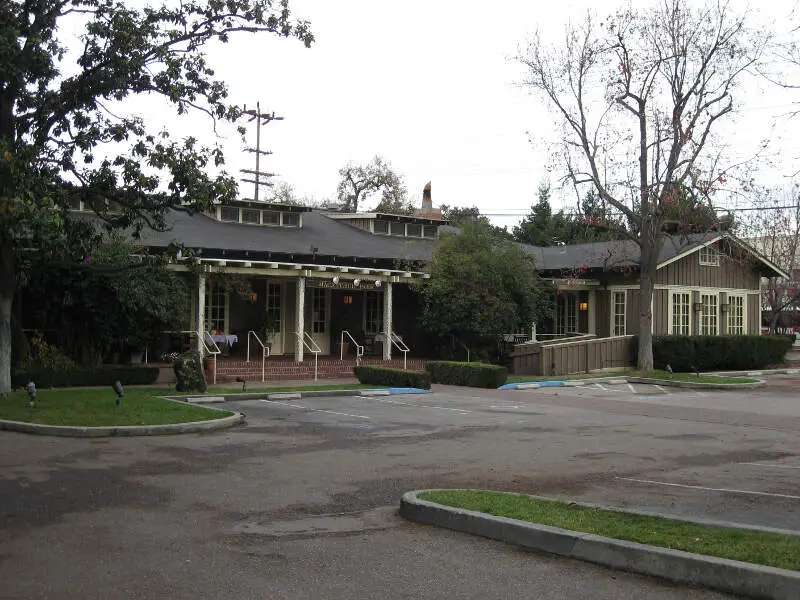
Palo Alto, CA Photos
1 Reviews & Comments About Palo Alto
/5

HomeSnacks User - None
I live in Palo Alto, and I never doubted that we ranked high on snobbery. After all, not only do we have a community theater company and a community orchestra, but we have a community opera company as well.||I don't know where Palo Alto stands with this metric or how much it is weighted, but I take objection to your inclusion of private school density as a criterion.
Firstly, the number of private schools in a city relative to that city's population is not necessarily the best measure of how many eligible students in a city attend private school, as private schools may vary in size and often do not restrict enrollment to the residents of their host city.
Secondly, while private school enrollment is an understandable measure to be associated with snobbery, given that in most parts of the country elites seek out private schools for the usually superior quality of education they provide, Palo Alto may be an exception that proves the rule.
In Palo Alto, the quality of our public schools rivals that of many nearby private schools. Therefore, many Palo Alto parents proudly send their children to public school, deeming private school unnecessarily expensive for its relative value. Does this fact make us more or less s****y-
Rankings for Palo Alto in California


Locations Around Palo Alto
Map Of Palo Alto, CA
Best Places Around Palo Alto
East Foothills, CA
Population 8,630
San Carlos, CA
Population 29,797
San Lorenzo, CA
Population 29,453
Cupertino, CA
Population 58,886
Los Altos, CA
Population 30,736
San Mateo, CA
Population 103,555
Belmont, CA
Population 27,505
Sunnyvale, CA
Population 153,455
North Fair Oaks, CA
Population 13,327
Millbrae, CA
Population 22,589
Palo Alto Demographics And Statistics
Population over time in Palo Alto
The current population in Palo Alto is 67,231. The population has increased 7.6% from 2010.
| Year | Population | % Change |
|---|---|---|
| 2023 | 67,231 | -1.0% |
| 2022 | 67,901 | -1.1% |
| 2021 | 68,624 | 1.0% |
| 2020 | 67,973 | 2.1% |
| 2019 | 66,573 | -0.7% |
| 2018 | 67,019 | -0.1% |
| 2017 | 67,082 | 0.6% |
| 2016 | 66,649 | 0.3% |
| 2015 | 66,478 | 0.7% |
| 2014 | 65,998 | 1.2% |
| 2013 | 65,234 | 1.1% |
| 2012 | 64,514 | 1.6% |
| 2011 | 63,475 | 1.6% |
| 2010 | 62,486 | - |
Race / Ethnicity in Palo Alto
Palo Alto is:
47.3% White with 31,809 White residents.
2.1% African American with 1,431 African American residents.
0.1% American Indian with 61 American Indian residents.
36.1% Asian with 24,267 Asian residents.
0.1% Hawaiian with 91 Hawaiian residents.
0.3% Other with 231 Other residents.
6.8% Two Or More with 4,566 Two Or More residents.
7.1% Hispanic with 4,775 Hispanic residents.
| Race | Palo Alto | CA | USA |
|---|---|---|---|
| White | 47.3% | 34.6% | 58.2% |
| African American | 2.1% | 5.3% | 12.0% |
| American Indian | 0.1% | 0.3% | 0.5% |
| Asian | 36.1% | 15.1% | 5.7% |
| Hawaiian | 0.1% | 0.3% | 0.2% |
| Other | 0.3% | 0.5% | 0.5% |
| Two Or More | 6.8% | 4.1% | 3.9% |
| Hispanic | 7.1% | 39.8% | 19.0% |
Gender in Palo Alto
Palo Alto is 51.5% female with 34,632 female residents.
Palo Alto is 48.5% male with 32,598 male residents.
| Gender | Palo Alto | CA | USA |
|---|---|---|---|
| Female | 51.5% | 50.0% | 50.5% |
| Male | 48.5% | 50.0% | 49.5% |
Highest level of educational attainment in Palo Alto for adults over 25
2.0% of adults in Palo Alto completed < 9th grade.
1.0% of adults in Palo Alto completed 9-12th grade.
5.0% of adults in Palo Alto completed high school / ged.
7.0% of adults in Palo Alto completed some college.
3.0% of adults in Palo Alto completed associate's degree.
27.0% of adults in Palo Alto completed bachelor's degree.
29.0% of adults in Palo Alto completed master's degree.
8.0% of adults in Palo Alto completed professional degree.
18.0% of adults in Palo Alto completed doctorate degree.
| Education | Palo Alto | CA | USA |
|---|---|---|---|
| < 9th Grade | 2.0% | 8.0% | 5.0% |
| 9-12th Grade | 1.0% | 7.0% | 6.0% |
| High School / GED | 5.0% | 20.0% | 26.0% |
| Some College | 7.0% | 20.0% | 19.0% |
| Associate's Degree | 3.0% | 8.0% | 9.0% |
| Bachelor's Degree | 27.0% | 22.0% | 21.0% |
| Master's Degree | 29.0% | 10.0% | 10.0% |
| Professional Degree | 8.0% | 3.0% | 2.0% |
| Doctorate Degree | 18.0% | 2.0% | 2.0% |
Household Income For Palo Alto, California
2.8% of households in Palo Alto earn Less than $10,000.
2.1% of households in Palo Alto earn $10,000 to $14,999.
2.3% of households in Palo Alto earn $15,000 to $24,999.
2.4% of households in Palo Alto earn $25,000 to $34,999.
3.3% of households in Palo Alto earn $35,000 to $49,999.
6.1% of households in Palo Alto earn $50,000 to $74,999.
5.8% of households in Palo Alto earn $75,000 to $99,999.
12.3% of households in Palo Alto earn $100,000 to $149,999.
10.1% of households in Palo Alto earn $150,000 to $199,999.
52.8% of households in Palo Alto earn $200,000 or more.
| Income | Palo Alto | CA | USA |
|---|---|---|---|
| Less than $10,000 | 2.8% | 4.4% | 4.9% |
| $10,000 to $14,999 | 2.1% | 3.0% | 3.6% |
| $15,000 to $24,999 | 2.3% | 5.2% | 6.6% |
| $25,000 to $34,999 | 2.4% | 5.5% | 6.8% |
| $35,000 to $49,999 | 3.3% | 8.4% | 10.4% |
| $50,000 to $74,999 | 6.1% | 13.3% | 15.7% |
| $75,000 to $99,999 | 5.8% | 11.8% | 12.7% |
| $100,000 to $149,999 | 12.3% | 17.9% | 17.4% |
| $150,000 to $199,999 | 10.1% | 11.1% | 9.3% |
| $200,000 or more | 52.8% | 19.4% | 12.6% |


