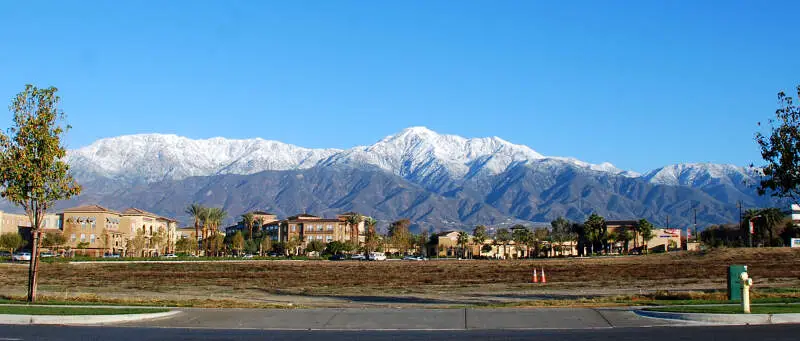
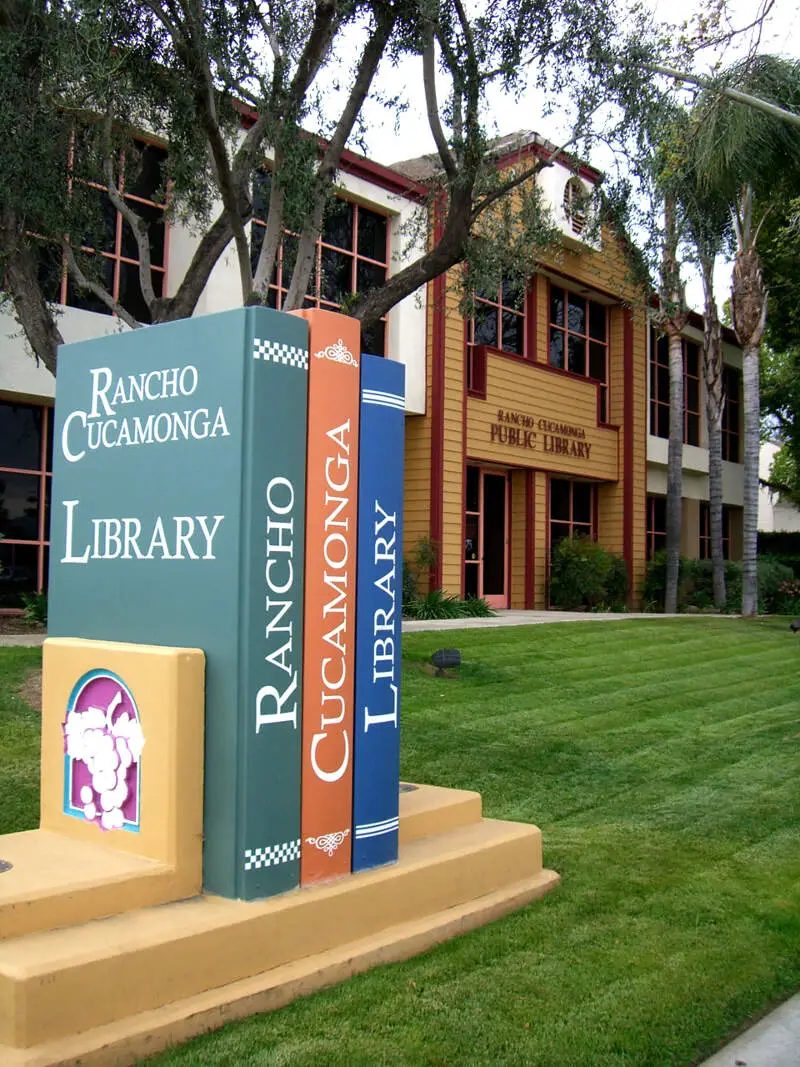
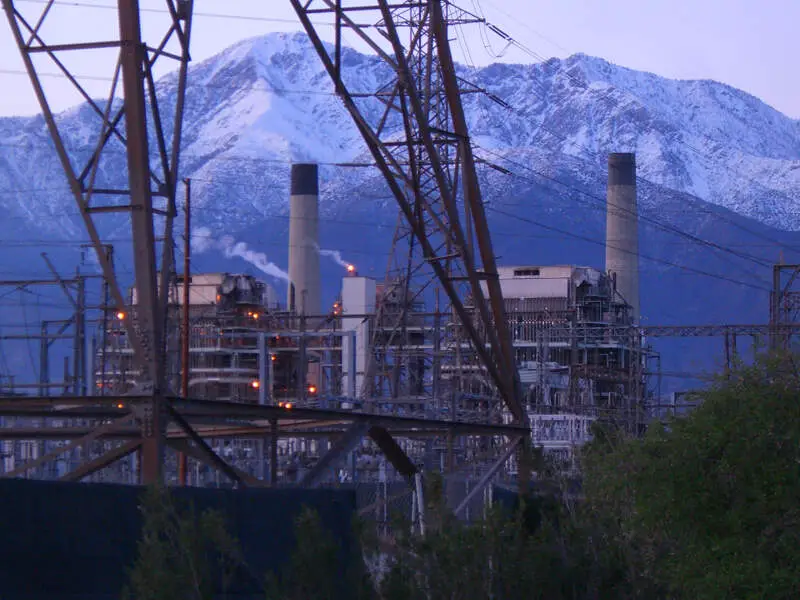
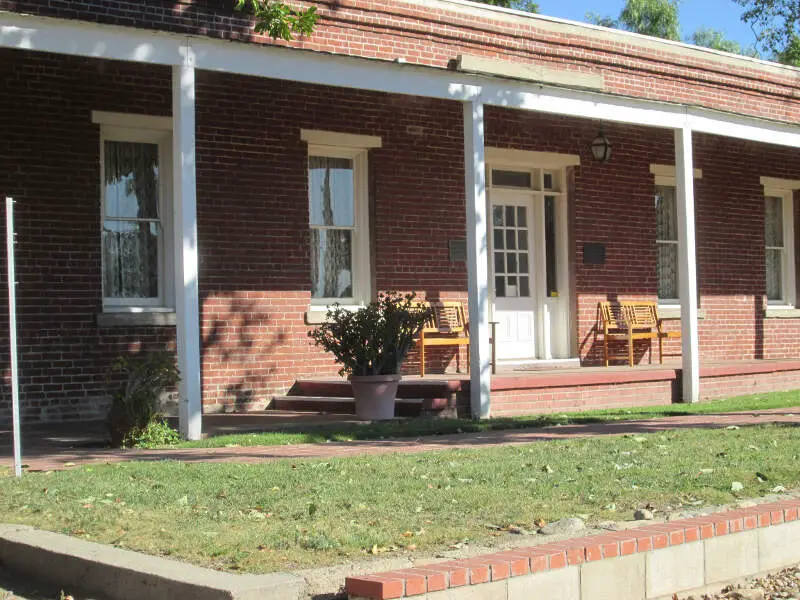
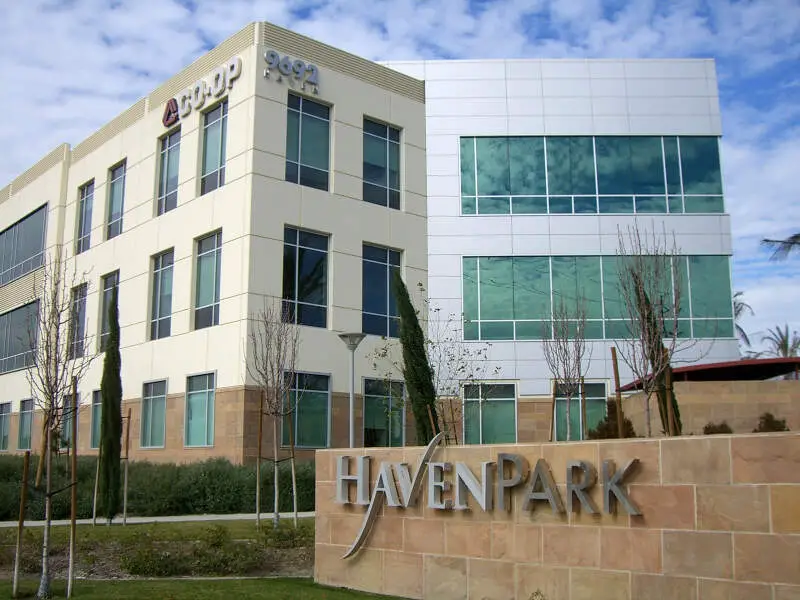
Rancho Cucamonga, CA
Demographics And Statistics
Living In Rancho Cucamonga, California Summary
Life in Rancho Cucamonga research summary. HomeSnacks has been using Saturday Night Science to research the quality of life in Rancho Cucamonga over the past nine years using Census, FBI, Zillow, and other primary data sources. Based on the most recently available data, we found the following about life in Rancho Cucamonga:
The population in Rancho Cucamonga is 174,693.
The median home value in Rancho Cucamonga is $780,513.
The median income in Rancho Cucamonga is $109,511.
The cost of living in Rancho Cucamonga is 154 which is 1.5x higher than the national average.
The median rent in Rancho Cucamonga is $2,286.
The unemployment rate in Rancho Cucamonga is 5.8%.
The poverty rate in Rancho Cucamonga is 8.0%.
The average high in Rancho Cucamonga is 76.0° and the average low is 48.8°.
Rancho Cucamonga SnackAbility
Overall SnackAbility
Rancho Cucamonga, CA Crime Report
Crime in Rancho Cucamonga summary. We use data from the FBI to determine the crime rates in Rancho Cucamonga. Key points include:
There were 3,669 total crimes in Rancho Cucamonga in the last reporting year.
The overall crime rate per 100,000 people in Rancho Cucamonga is 2,104.8 / 100k people.
The violent crime rate per 100,000 people in Rancho Cucamonga is 293.7 / 100k people.
The property crime rate per 100,000 people in Rancho Cucamonga is 1,811.1 / 100k people.
Overall, crime in Rancho Cucamonga is -0.68% below the national average.
Total Crimes
Below National Average
Crime In Rancho Cucamonga Comparison Table
| Statistic | Count Raw |
Rancho Cucamonga / 100k People |
California / 100k People |
National / 100k People |
|---|---|---|---|---|
| Total Crimes Per 100K | 3,669 | 2,104.8 | 2,564.5 | 2,119.2 |
| Violent Crime | 512 | 293.7 | 486.0 | 359.0 |
| Murder | 2 | 1.1 | 4.5 | 5.0 |
| Robbery | 111 | 63.7 | 119.1 | 61.0 |
| Aggravated Assault | 363 | 208.2 | 325.8 | 256.0 |
| Property Crime | 3,157 | 1,811.1 | 2,078.4 | 1,760.0 |
| Burglary | 476 | 273.1 | 305.8 | 229.0 |
| Larceny | 2,295 | 1,316.6 | 1,345.2 | 1,272.0 |
| Car Theft | 386 | 221.4 | 427.5 | 259.0 |
Rancho Cucamonga, CA Cost Of Living
Cost of living in Rancho Cucamonga summary. We use data on the cost of living to determine how expensive it is to live in Rancho Cucamonga. Real estate prices drive most of the variance in cost of living around California. Key points include:
The cost of living in Rancho Cucamonga is 154 with 100 being average.
The cost of living in Rancho Cucamonga is 1.5x higher than the national average.
The median home value in Rancho Cucamonga is $780,513.
The median income in Rancho Cucamonga is $109,511.
Rancho Cucamonga's Overall Cost Of Living
Higher Than The National Average
Cost Of Living In Rancho Cucamonga Comparison Table
| Living Expense | Rancho Cucamonga | California | National Average | |
|---|---|---|---|---|
| Overall | 154 | 141 | 100 | |
| Services | 114 | 110 | 100 | |
| Groceries | 112 | 112 | 100 | |
| Health | 100 | 110 | 100 | |
| Housing | 253 | 195 | 100 | |
| Transportation | 125 | 125 | 100 | |
| Utilities | 95 | 128 | 100 | |
Rancho Cucamonga, CA Weather
The average high in Rancho Cucamonga is 76.0° and the average low is 48.8°.
There are 22.0 days of precipitation each year.
Expect an average of 14.2 inches of precipitation each year with 9.0 inches of snow.
| Stat | Rancho Cucamonga |
|---|---|
| Average Annual High | 76.0 |
| Average Annual Low | 48.8 |
| Annual Precipitation Days | 22.0 |
| Average Annual Precipitation | 14.2 |
| Average Annual Snowfall | 9.0 |
Average High
Days of Rain
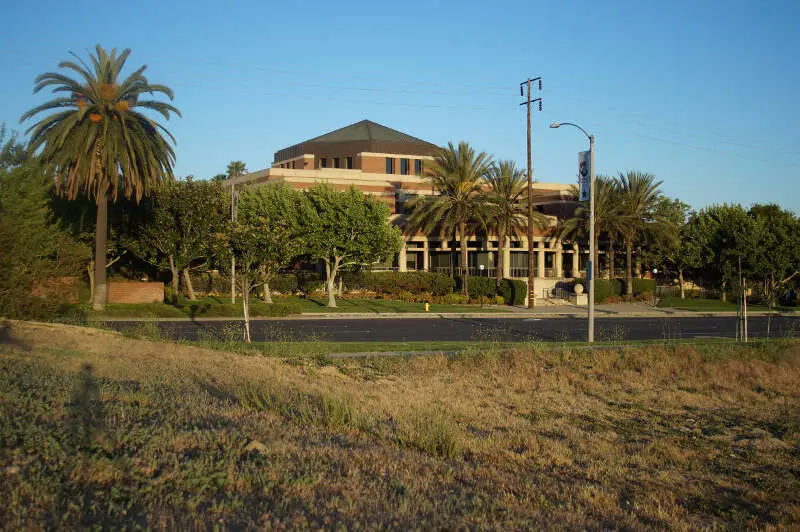
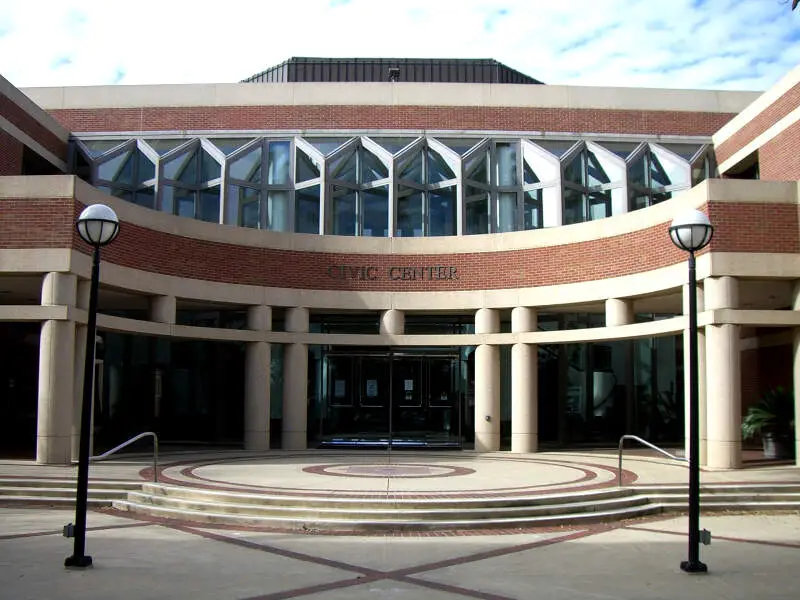
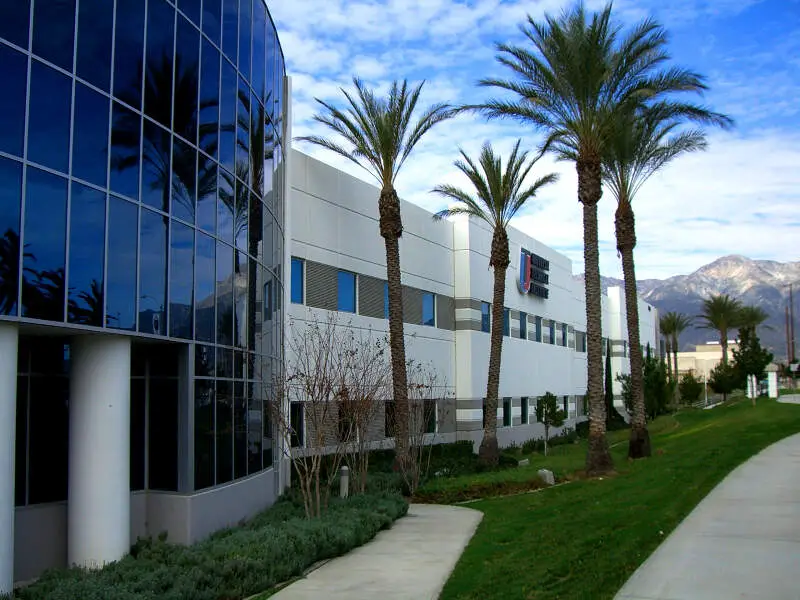
Rancho Cucamonga, CA Photos
2 Reviews & Comments About Rancho Cucamonga
/5

HomeSnacks User - 2018-07-13 18:06:41.269670
Rancho Cucamonga is a suburban town that doesn't have a high rate of crime and is known to house upper middle class families. Although a lot of families live here there are some areas that younger people stay even though it can be very expensive.
Favorite place to visit is the mall called Victoria Gardens. An outdoor mall that is a little on the pricey side, but caters towards all different types of crowds.
HomeSnacks User - 2019-05-03 04:13:13.300178
Car theft, GTA, schools inferior
easy to get to fwy if you are a thief or car thief
not enough cops for the crime!
Rankings for Rancho Cucamonga in California


Locations Around Rancho Cucamonga
Map Of Rancho Cucamonga, CA
Best Places Around Rancho Cucamonga
Citrus, CA
Population 10,813
La Verne, CA
Population 30,804
Walnut, CA
Population 27,857
Diamond Bar, CA
Population 53,750
Claremont, CA
Population 36,553
Glendora, CA
Population 51,350
Charter Oak, CA
Population 9,414
Covina, CA
Population 50,143
Grand Terrace, CA
Population 13,069
San Dimas, CA
Population 34,099
Rancho Cucamonga Demographics And Statistics
Population over time in Rancho Cucamonga
The current population in Rancho Cucamonga is 174,693. The population has increased 8.7% from 2010.
| Year | Population | % Change |
|---|---|---|
| 2023 | 174,693 | -0.0% |
| 2022 | 174,696 | 0.4% |
| 2021 | 173,946 | -2.3% |
| 2020 | 178,060 | 1.0% |
| 2019 | 176,379 | 0.4% |
| 2018 | 175,679 | 0.6% |
| 2017 | 174,573 | 0.7% |
| 2016 | 173,309 | 0.8% |
| 2015 | 171,858 | 1.0% |
| 2014 | 170,170 | 1.4% |
| 2013 | 167,743 | 1.2% |
| 2012 | 165,775 | 1.6% |
| 2011 | 163,151 | 1.5% |
| 2010 | 160,780 | - |
Race / Ethnicity in Rancho Cucamonga
Rancho Cucamonga is:
33.6% White with 58,678 White residents.
8.0% African American with 14,041 African American residents.
0.1% American Indian with 224 American Indian residents.
15.1% Asian with 26,324 Asian residents.
0.1% Hawaiian with 259 Hawaiian residents.
0.8% Other with 1,350 Other residents.
3.8% Two Or More with 6,655 Two Or More residents.
38.4% Hispanic with 67,162 Hispanic residents.
| Race | Rancho Cucamonga | CA | USA |
|---|---|---|---|
| White | 33.6% | 34.6% | 58.2% |
| African American | 8.0% | 5.3% | 12.0% |
| American Indian | 0.1% | 0.3% | 0.5% |
| Asian | 15.1% | 15.1% | 5.7% |
| Hawaiian | 0.1% | 0.3% | 0.2% |
| Other | 0.8% | 0.5% | 0.5% |
| Two Or More | 3.8% | 4.1% | 3.9% |
| Hispanic | 38.4% | 39.8% | 19.0% |
Gender in Rancho Cucamonga
Rancho Cucamonga is 50.2% female with 87,755 female residents.
Rancho Cucamonga is 49.8% male with 86,938 male residents.
| Gender | Rancho Cucamonga | CA | USA |
|---|---|---|---|
| Female | 50.2% | 50.0% | 50.5% |
| Male | 49.8% | 50.0% | 49.5% |
Highest level of educational attainment in Rancho Cucamonga for adults over 25
5.0% of adults in Rancho Cucamonga completed < 9th grade.
4.0% of adults in Rancho Cucamonga completed 9-12th grade.
20.0% of adults in Rancho Cucamonga completed high school / ged.
23.0% of adults in Rancho Cucamonga completed some college.
11.0% of adults in Rancho Cucamonga completed associate's degree.
23.0% of adults in Rancho Cucamonga completed bachelor's degree.
10.0% of adults in Rancho Cucamonga completed master's degree.
2.0% of adults in Rancho Cucamonga completed professional degree.
2.0% of adults in Rancho Cucamonga completed doctorate degree.
| Education | Rancho Cucamonga | CA | USA |
|---|---|---|---|
| < 9th Grade | 5.0% | 8.0% | 5.0% |
| 9-12th Grade | 4.0% | 7.0% | 6.0% |
| High School / GED | 20.0% | 20.0% | 26.0% |
| Some College | 23.0% | 20.0% | 19.0% |
| Associate's Degree | 11.0% | 8.0% | 9.0% |
| Bachelor's Degree | 23.0% | 22.0% | 21.0% |
| Master's Degree | 10.0% | 10.0% | 10.0% |
| Professional Degree | 2.0% | 3.0% | 2.0% |
| Doctorate Degree | 2.0% | 2.0% | 2.0% |
Household Income For Rancho Cucamonga, California
3.5% of households in Rancho Cucamonga earn Less than $10,000.
1.9% of households in Rancho Cucamonga earn $10,000 to $14,999.
3.8% of households in Rancho Cucamonga earn $15,000 to $24,999.
4.2% of households in Rancho Cucamonga earn $25,000 to $34,999.
7.0% of households in Rancho Cucamonga earn $35,000 to $49,999.
12.4% of households in Rancho Cucamonga earn $50,000 to $74,999.
13.1% of households in Rancho Cucamonga earn $75,000 to $99,999.
21.8% of households in Rancho Cucamonga earn $100,000 to $149,999.
12.9% of households in Rancho Cucamonga earn $150,000 to $199,999.
19.4% of households in Rancho Cucamonga earn $200,000 or more.
| Income | Rancho Cucamonga | CA | USA |
|---|---|---|---|
| Less than $10,000 | 3.5% | 4.4% | 4.9% |
| $10,000 to $14,999 | 1.9% | 3.0% | 3.6% |
| $15,000 to $24,999 | 3.8% | 5.2% | 6.6% |
| $25,000 to $34,999 | 4.2% | 5.5% | 6.8% |
| $35,000 to $49,999 | 7.0% | 8.4% | 10.4% |
| $50,000 to $74,999 | 12.4% | 13.3% | 15.7% |
| $75,000 to $99,999 | 13.1% | 11.8% | 12.7% |
| $100,000 to $149,999 | 21.8% | 17.9% | 17.4% |
| $150,000 to $199,999 | 12.9% | 11.1% | 9.3% |
| $200,000 or more | 19.4% | 19.4% | 12.6% |


