Rialto SnackAbility
Overall SnackAbility
Crime in Rialto summary. We use data from the FBI to determine the crime rates in Rialto. Key points include:
There were 3,133 total crimes in Rialto in the last reporting year.
The overall crime rate per 100,000 people in Rialto is 3,036.9 / 100k people.
The violent crime rate per 100,000 people in Rialto is 641.7 / 100k people.
The property crime rate per 100,000 people in Rialto is 2,395.2 / 100k people.
Overall, crime in Rialto is 43.30% above the national average.
Total Crimes
Above National Average
Crime In Rialto Comparison Table
| Statistic | Count Raw |
Rialto / 100k People |
California / 100k People |
National / 100k People |
|---|---|---|---|---|
| Total Crimes Per 100K | 3,133 | 3,036.9 | 2,564.5 | 2,119.2 |
| Violent Crime | 662 | 641.7 | 486.0 | 359.0 |
| Murder | 2 | 1.9 | 4.5 | 5.0 |
| Robbery | 128 | 124.1 | 119.1 | 61.0 |
| Aggravated Assault | 487 | 472.1 | 325.8 | 256.0 |
| Property Crime | 2,471 | 2,395.2 | 2,078.4 | 1,760.0 |
| Burglary | 314 | 304.4 | 305.8 | 229.0 |
| Larceny | 1,747 | 1,693.4 | 1,345.2 | 1,272.0 |
| Car Theft | 410 | 397.4 | 427.5 | 259.0 |
Source: FBI Uniform Crime Reporting (2024)
Cost of living in Rialto summary. We use data on the cost of living to determine how expensive it is to live in Rialto. Real estate prices drive most of the variance in cost of living around California. Key points include:
The cost of living in Rialto is 133 with 100 being average.
The cost of living in Rialto is 1.3x higher than the national average.
The median home value in Rialto is $588,566.
The median income in Rialto is $88,857.
Rialto's Overall Cost Of Living
Higher Than The National Average
Cost Of Living In Rialto Comparison Table
| Living Expense | Rialto | California | National Average |
|---|---|---|---|
| Overall | 133 | 142 | 100 |
| Services | 113 | 110 | 100 |
| Groceries | 117 | 118 | 100 |
| Health | 167 | 197 | 100 |
| Housing | 123 | 120 | 100 |
| Transportation | 116 | 121 | 100 |
| Utilities | 126 | 121 | 100 |
Source: Cost of living index, normalized to US average = 100
Rialto, CA Weather
The average high in Rialto is 76.0° and the average low is 48.8°.
There are 22.0 days of precipitation each year.
Expect an average of 14.2 inches of precipitation each year with 9.0 inches of snow.
| Stat | Rialto |
|---|---|
| Average Annual High | 76.0 |
| Average Annual Low | 48.8 |
| Annual Precipitation Days | 22.0 |
| Average Annual Precipitation | 14.2 |
| Average Annual Snowfall | 9.0 |
Average High
Days of Rain
Source: NOAA climate normals (30-year)
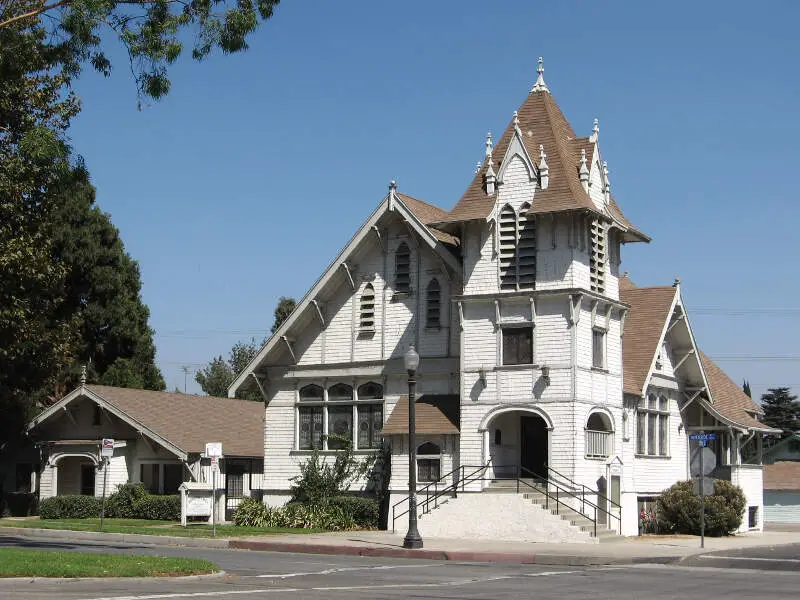
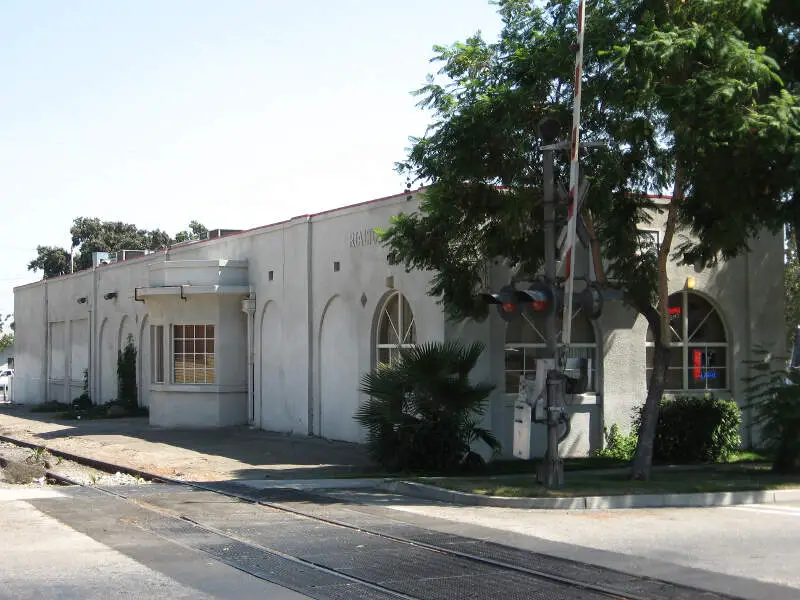
Rialto, CA Photos
2 Reviews & Comments About Rialto

Growing up in Rialto CA was a good experience. The down-town is like stepping back in time to the 50s. It was like nothing had changed with all the historic buildings and churches.
What stood out to me the most was the since of community that was alive and well in that town. It was not uncommon to see a giant group of kids playing in the street until the street lights came on.
Bad football teams. Good Mexican food.
It's growing. Used to be ghetto. Now it's all new homes.
Rankings & Articles For Rialto


Locations Around Rialto
Map Of Rialto, CA
Best Places Around Rialto
Claremont, CA
Population 36,595
Rancho Cucamonga, CA
Population 175,411
Grand Terrace, CA
Population 13,078
Eastvale, CA
Population 70,633
Corona, CA
Population 159,670
Home Gardens, CA
Population 10,506
Woodcrest, CA
Population 17,368
Loma Linda, CA
Population 25,122
Upland, CA
Population 79,257
Redlands, CA
Population 73,375
Rialto Demographics And Statistics
Population over time in Rialto
The current population in Rialto is 104,143. The population has increased 4.9% from 2010.
| Year | Population | % Change |
|---|---|---|
| 2024 | 104,143 | 0.3% |
| 2023 | 103,866 | -0.0% |
| 2022 | 103,873 | 0.1% |
| 2021 | 103,799 | 0.2% |
| 2020 | 103,549 | 0.5% |
| 2019 | 103,045 | 0.2% |
| 2018 | 102,873 | 0.2% |
| 2017 | 102,708 | 0.3% |
| 2016 | 102,418 | 0.4% |
| 2015 | 102,018 | 0.6% |
| 2014 | 101,367 | 0.9% |
| 2013 | 100,479 | 0.5% |
| 2012 | 100,009 | 0.5% |
| 2011 | 99,501 | 0.2% |
| 2010 | 99,311 | - |
Race / Ethnicity in Rialto
See the full breakdown
Rialto is:
8.8% White with 9,172 White residents.
11.3% African American with 11,764 African American residents.
0.1% American Indian with 107 American Indian residents.
2.2% Asian with 2,294 Asian residents.
0.0% Hawaiian with 32 Hawaiian residents.
1.0% Other with 1,025 Other residents.
1.7% Two Or More with 1,807 Two Or More residents.
74.8% Hispanic with 77,942 Hispanic residents.
| Race | Rialto | CA | USA |
|---|---|---|---|
| White | 8.8% | 33.8% | 57.4% |
| African American | 11.3% | 5.2% | 11.9% |
| American Indian | 0.1% | 0.3% | 0.5% |
| Asian | 2.2% | 15.3% | 5.9% |
| Hawaiian | 0.0% | 0.3% | 0.2% |
| Other | 1.0% | 0.6% | 0.6% |
| Two Or More | 1.7% | 4.4% | 4.3% |
| Hispanic | 74.8% | 40.2% | 19.3% |
Gender in Rialto
See the full breakdown
Rialto is 50.7% female with 52,823 female residents.
Rialto is 49.3% male with 51,320 male residents.
| Gender | Rialto | CA | USA |
|---|---|---|---|
| Female | 50.7% | 50.1% | 50.5% |
| Male | 49.3% | 49.9% | 49.5% |
Highest level of educational attainment in Rialto for adults over 25
See the full breakdown
14.0% of adults in Rialto completed < 9th grade.
11.0% of adults in Rialto completed 9-12th grade.
35.0% of adults in Rialto completed high school / ged.
21.0% of adults in Rialto completed some college.
7.0% of adults in Rialto completed associate's degree.
9.0% of adults in Rialto completed bachelor's degree.
3.0% of adults in Rialto completed master's degree.
0.0% of adults in Rialto completed professional degree.
0.0% of adults in Rialto completed doctorate degree.
| Education | Rialto | CA | USA |
|---|---|---|---|
| < 9th Grade | 14.0% | 8.0% | 4.0% |
| 9-12th Grade | 11.0% | 7.0% | 6.0% |
| High School / GED | 35.0% | 20.0% | 26.0% |
| Some College | 21.0% | 19.0% | 19.0% |
| Associate's Degree | 7.0% | 8.0% | 9.0% |
| Bachelor's Degree | 9.0% | 23.0% | 22.0% |
| Master's Degree | 3.0% | 10.0% | 10.0% |
| Professional Degree | 0.0% | 3.0% | 2.0% |
| Doctorate Degree | 0.0% | 2.0% | 2.0% |
Household Income For Rialto, California
See the full breakdown
3.3% of households in Rialto earn Less than $10,000.
2.8% of households in Rialto earn $10,000 to $14,999.
5.7% of households in Rialto earn $15,000 to $24,999.
6.9% of households in Rialto earn $25,000 to $34,999.
8.7% of households in Rialto earn $35,000 to $49,999.
14.6% of households in Rialto earn $50,000 to $74,999.
14.5% of households in Rialto earn $75,000 to $99,999.
22.5% of households in Rialto earn $100,000 to $149,999.
10.9% of households in Rialto earn $150,000 to $199,999.
10.1% of households in Rialto earn $200,000 or more.
| Income | Rialto | CA | USA |
|---|---|---|---|
| Less than $10,000 | 3.3% | 4.5% | 5.0% |
| $10,000 to $14,999 | 2.8% | 2.9% | 3.4% |
| $15,000 to $24,999 | 5.7% | 5.0% | 6.3% |
| $25,000 to $34,999 | 6.9% | 5.3% | 6.6% |
| $35,000 to $49,999 | 8.7% | 8.1% | 10.1% |
| $50,000 to $74,999 | 14.6% | 13.0% | 15.5% |
| $75,000 to $99,999 | 14.5% | 11.6% | 12.6% |
| $100,000 to $149,999 | 22.5% | 17.8% | 17.5% |
| $150,000 to $199,999 | 10.9% | 11.3% | 9.6% |
| $200,000 or more | 10.1% | 20.5% | 13.4% |
Source: U.S. Census ACS 5-year estimates (2024)


