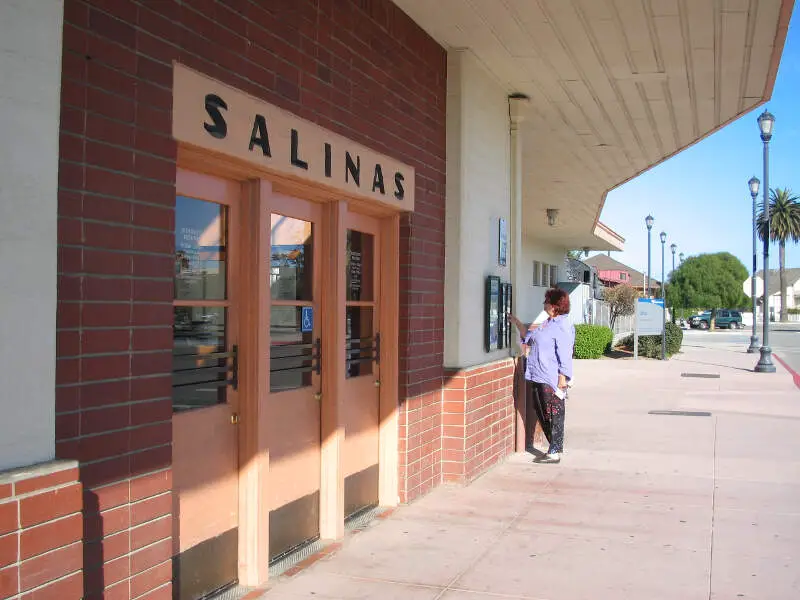
Salinas, CA
Demographics And Statistics
Living In Salinas, California Summary
Life in Salinas research summary. HomeSnacks has been using Saturday Night Science to research the quality of life in Salinas over the past nine years using Census, FBI, Zillow, and other primary data sources. Based on the most recently available data, we found the following about life in Salinas:
The population in Salinas is 161,993.
The median home value in Salinas is $732,006.
The median income in Salinas is $89,150.
The cost of living in Salinas is 149 which is 1.5x higher than the national average.
The median rent in Salinas is $1,923.
The unemployment rate in Salinas is 4.7%.
The poverty rate in Salinas is 14.2%.
The average high in Salinas is 68.4° and the average low is 47.0°.
Salinas SnackAbility
Overall SnackAbility
Salinas, CA Crime Report
Crime in Salinas summary. We use data from the FBI to determine the crime rates in Salinas. Key points include:
There were 3,481 total crimes in Salinas in the last reporting year.
The overall crime rate per 100,000 people in Salinas is 2,199.9 / 100k people.
The violent crime rate per 100,000 people in Salinas is 524.5 / 100k people.
The property crime rate per 100,000 people in Salinas is 1,675.4 / 100k people.
Overall, crime in Salinas is 3.81% above the national average.
Total Crimes
Above National Average
Crime In Salinas Comparison Table
| Statistic | Count Raw |
Salinas / 100k People |
California / 100k People |
National / 100k People |
|---|---|---|---|---|
| Total Crimes Per 100K | 3,481 | 2,199.9 | 2,564.5 | 2,119.2 |
| Violent Crime | 830 | 524.5 | 486.0 | 359.0 |
| Murder | 6 | 3.8 | 4.5 | 5.0 |
| Robbery | 223 | 140.9 | 119.1 | 61.0 |
| Aggravated Assault | 520 | 328.6 | 325.8 | 256.0 |
| Property Crime | 2,651 | 1,675.4 | 2,078.4 | 1,760.0 |
| Burglary | 232 | 146.6 | 305.8 | 229.0 |
| Larceny | 1,833 | 1,158.4 | 1,345.2 | 1,272.0 |
| Car Theft | 586 | 370.3 | 427.5 | 259.0 |
Salinas, CA Cost Of Living
Cost of living in Salinas summary. We use data on the cost of living to determine how expensive it is to live in Salinas. Real estate prices drive most of the variance in cost of living around California. Key points include:
The cost of living in Salinas is 149 with 100 being average.
The cost of living in Salinas is 1.5x higher than the national average.
The median home value in Salinas is $732,006.
The median income in Salinas is $89,150.
Salinas's Overall Cost Of Living
Higher Than The National Average
Cost Of Living In Salinas Comparison Table
| Living Expense | Salinas | California | National Average | |
|---|---|---|---|---|
| Overall | 149 | 141 | 100 | |
| Services | 110 | 110 | 100 | |
| Groceries | 117 | 112 | 100 | |
| Health | 125 | 110 | 100 | |
| Housing | 219 | 195 | 100 | |
| Transportation | 132 | 125 | 100 | |
| Utilities | 133 | 128 | 100 | |
Salinas, CA Weather
The average high in Salinas is 68.4° and the average low is 47.0°.
There are 36.3 days of precipitation each year.
Expect an average of 16.0 inches of precipitation each year with 0.3 inches of snow.
| Stat | Salinas |
|---|---|
| Average Annual High | 68.4 |
| Average Annual Low | 47.0 |
| Annual Precipitation Days | 36.3 |
| Average Annual Precipitation | 16.0 |
| Average Annual Snowfall | 0.3 |
Average High
Days of Rain
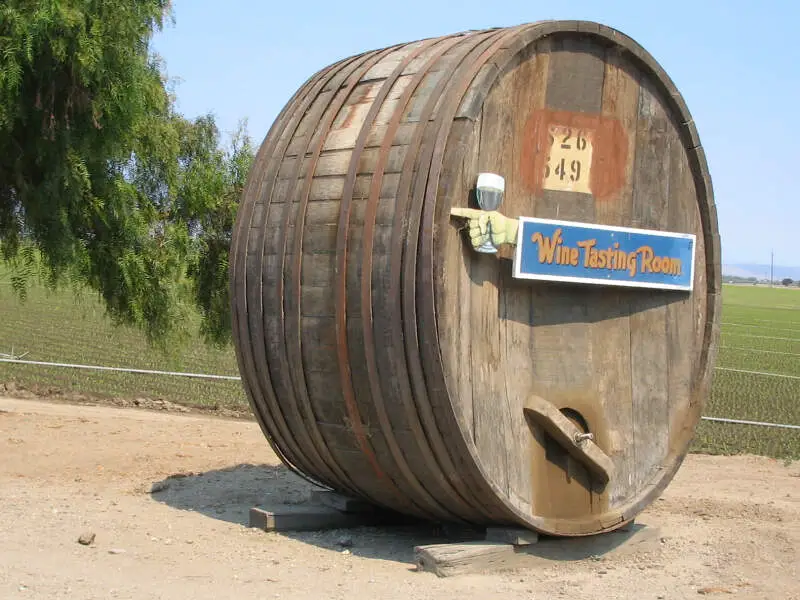
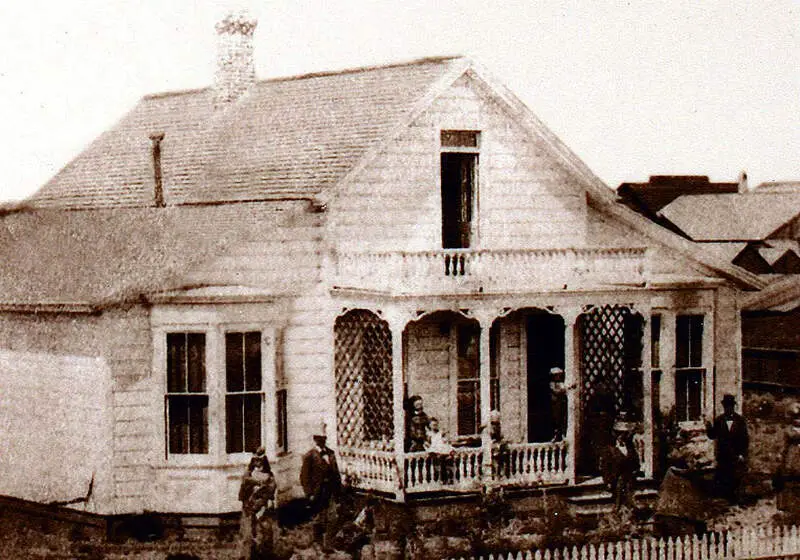
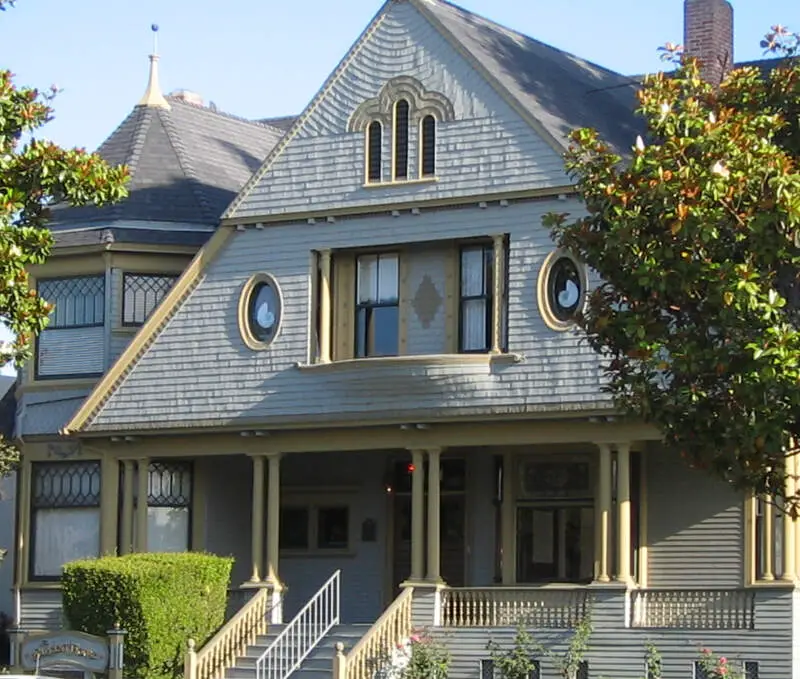
Salinas, CA Photos


1 Reviews & Comments About Salinas
/5

HomeSnacks User - 2019-03-26 05:29:11.711206
Crime is literally everywhere even in the wealthier neighborhoods but the east side is where you need to have a knife or a gun to protect yourself if your walking at night, the north side is also dangerous, the schools are good but not great and there's not that much to do.
Some of my favorite places are Natividad Creek park, Oldtown, and thats it there's nothing much to do.
Rankings for Salinas in California


Locations Around Salinas
Map Of Salinas, CA
Best Places Around Salinas
Seaside, CA
Population 31,964
Gonzales, CA
Population 8,526
Prunedale, CA
Population 19,286
Interlaken, CA
Population 8,191
Marina, CA
Population 22,324
Castroville, CA
Population 6,870
Pacific Grove, CA
Population 15,003
Monterey, CA
Population 29,772
Hollister, CA
Population 43,003
Watsonville, CA
Population 51,968
Salinas Demographics And Statistics
Population over time in Salinas
The current population in Salinas is 161,993. The population has increased 10.1% from 2010.
| Year | Population | % Change |
|---|---|---|
| 2023 | 161,993 | -0.5% |
| 2022 | 162,783 | -0.1% |
| 2021 | 163,004 | 4.4% |
| 2020 | 156,177 | 0.0% |
| 2019 | 156,143 | -0.3% |
| 2018 | 156,550 | -0.2% |
| 2017 | 156,811 | 0.6% |
| 2016 | 155,889 | 0.3% |
| 2015 | 155,366 | 0.8% |
| 2014 | 154,077 | 1.1% |
| 2013 | 152,340 | 1.1% |
| 2012 | 150,634 | 1.2% |
| 2011 | 148,780 | 1.2% |
| 2010 | 147,074 | - |
Race / Ethnicity in Salinas
Salinas is:
11.5% White with 18,685 White residents.
1.1% African American with 1,798 African American residents.
0.1% American Indian with 141 American Indian residents.
5.3% Asian with 8,655 Asian residents.
0.1% Hawaiian with 138 Hawaiian residents.
0.2% Other with 330 Other residents.
1.4% Two Or More with 2,231 Two Or More residents.
80.3% Hispanic with 130,015 Hispanic residents.
| Race | Salinas | CA | USA |
|---|---|---|---|
| White | 11.5% | 34.6% | 58.2% |
| African American | 1.1% | 5.3% | 12.0% |
| American Indian | 0.1% | 0.3% | 0.5% |
| Asian | 5.3% | 15.1% | 5.7% |
| Hawaiian | 0.1% | 0.3% | 0.2% |
| Other | 0.2% | 0.5% | 0.5% |
| Two Or More | 1.4% | 4.1% | 3.9% |
| Hispanic | 80.3% | 39.8% | 19.0% |
Gender in Salinas
Salinas is 49.3% female with 79,868 female residents.
Salinas is 50.7% male with 82,125 male residents.
| Gender | Salinas | CA | USA |
|---|---|---|---|
| Female | 49.3% | 50.0% | 50.5% |
| Male | 50.7% | 50.0% | 49.5% |
Highest level of educational attainment in Salinas for adults over 25
26.0% of adults in Salinas completed < 9th grade.
13.0% of adults in Salinas completed 9-12th grade.
23.0% of adults in Salinas completed high school / ged.
16.0% of adults in Salinas completed some college.
7.0% of adults in Salinas completed associate's degree.
11.0% of adults in Salinas completed bachelor's degree.
3.0% of adults in Salinas completed master's degree.
1.0% of adults in Salinas completed professional degree.
0.0% of adults in Salinas completed doctorate degree.
| Education | Salinas | CA | USA |
|---|---|---|---|
| < 9th Grade | 26.0% | 8.0% | 5.0% |
| 9-12th Grade | 13.0% | 7.0% | 6.0% |
| High School / GED | 23.0% | 20.0% | 26.0% |
| Some College | 16.0% | 20.0% | 19.0% |
| Associate's Degree | 7.0% | 8.0% | 9.0% |
| Bachelor's Degree | 11.0% | 22.0% | 21.0% |
| Master's Degree | 3.0% | 10.0% | 10.0% |
| Professional Degree | 1.0% | 3.0% | 2.0% |
| Doctorate Degree | 0.0% | 2.0% | 2.0% |
Household Income For Salinas, California
3.0% of households in Salinas earn Less than $10,000.
2.7% of households in Salinas earn $10,000 to $14,999.
6.5% of households in Salinas earn $15,000 to $24,999.
5.4% of households in Salinas earn $25,000 to $34,999.
9.4% of households in Salinas earn $35,000 to $49,999.
15.2% of households in Salinas earn $50,000 to $74,999.
14.4% of households in Salinas earn $75,000 to $99,999.
22.5% of households in Salinas earn $100,000 to $149,999.
10.6% of households in Salinas earn $150,000 to $199,999.
10.4% of households in Salinas earn $200,000 or more.
| Income | Salinas | CA | USA |
|---|---|---|---|
| Less than $10,000 | 3.0% | 4.4% | 4.9% |
| $10,000 to $14,999 | 2.7% | 3.0% | 3.6% |
| $15,000 to $24,999 | 6.5% | 5.2% | 6.6% |
| $25,000 to $34,999 | 5.4% | 5.5% | 6.8% |
| $35,000 to $49,999 | 9.4% | 8.4% | 10.4% |
| $50,000 to $74,999 | 15.2% | 13.3% | 15.7% |
| $75,000 to $99,999 | 14.4% | 11.8% | 12.7% |
| $100,000 to $149,999 | 22.5% | 17.9% | 17.4% |
| $150,000 to $199,999 | 10.6% | 11.1% | 9.3% |
| $200,000 or more | 10.4% | 19.4% | 12.6% |


