Santa Clara, CA
Demographics And Statistics
Living In Santa Clara, California Summary
Life in Santa Clara research summary. HomeSnacks has been using Saturday Night Science to research the quality of life in Santa Clara over the past nine years using Census, FBI, Zillow, and other primary data sources. Based on the most recently available data, we found the following about life in Santa Clara:
The population in Santa Clara is 129,239.
The median home value in Santa Clara is $1,666,520.
The median income in Santa Clara is $173,670.
The cost of living in Santa Clara is 234 which is 2.3x higher than the national average.
The median rent in Santa Clara is $2,985.
The unemployment rate in Santa Clara is 4.4%.
The poverty rate in Santa Clara is 7.8%.
The average high in Santa Clara is 71.1° and the average low is 48.8°.
Santa Clara SnackAbility
Overall SnackAbility
Santa Clara, CA Crime Report
Crime in Santa Clara summary. We use data from the FBI to determine the crime rates in Santa Clara. Key points include:
There were 3,540 total crimes in Santa Clara in the last reporting year.
The overall crime rate per 100,000 people in Santa Clara is 2,683.8 / 100k people.
The violent crime rate per 100,000 people in Santa Clara is 182.0 / 100k people.
The property crime rate per 100,000 people in Santa Clara is 2,501.9 / 100k people.
Overall, crime in Santa Clara is 26.64% above the national average.
Total Crimes
Above National Average
Crime In Santa Clara Comparison Table
| Statistic | Count Raw |
Santa Clara / 100k People |
California / 100k People |
National / 100k People |
|---|---|---|---|---|
| Total Crimes Per 100K | 3,540 | 2,683.8 | 2,564.5 | 2,119.2 |
| Violent Crime | 240 | 182.0 | 486.0 | 359.0 |
| Murder | 2 | 1.5 | 4.5 | 5.0 |
| Robbery | 76 | 57.6 | 119.1 | 61.0 |
| Aggravated Assault | 136 | 103.1 | 325.8 | 256.0 |
| Property Crime | 3,300 | 2,501.9 | 2,078.4 | 1,760.0 |
| Burglary | 445 | 337.4 | 305.8 | 229.0 |
| Larceny | 2,336 | 1,771.0 | 1,345.2 | 1,272.0 |
| Car Theft | 519 | 393.5 | 427.5 | 259.0 |
Santa Clara, CA Cost Of Living
Cost of living in Santa Clara summary. We use data on the cost of living to determine how expensive it is to live in Santa Clara. Real estate prices drive most of the variance in cost of living around California. Key points include:
The cost of living in Santa Clara is 234 with 100 being average.
The cost of living in Santa Clara is 2.3x higher than the national average.
The median home value in Santa Clara is $1,666,520.
The median income in Santa Clara is $173,670.
Santa Clara's Overall Cost Of Living
Higher Than The National Average
Cost Of Living In Santa Clara Comparison Table
| Living Expense | Santa Clara | California | National Average | |
|---|---|---|---|---|
| Overall | 234 | 141 | 100 | |
| Services | 107 | 110 | 100 | |
| Groceries | 114 | 112 | 100 | |
| Health | 125 | 110 | 100 | |
| Housing | 505 | 195 | 100 | |
| Transportation | 131 | 125 | 100 | |
| Utilities | 130 | 128 | 100 | |
Santa Clara, CA Weather
The average high in Santa Clara is 71.1° and the average low is 48.8°.
There are 37.9 days of precipitation each year.
Expect an average of 17.4 inches of precipitation each year with 1.6 inches of snow.
| Stat | Santa Clara |
|---|---|
| Average Annual High | 71.1 |
| Average Annual Low | 48.8 |
| Annual Precipitation Days | 37.9 |
| Average Annual Precipitation | 17.4 |
| Average Annual Snowfall | 1.6 |
Average High
Days of Rain
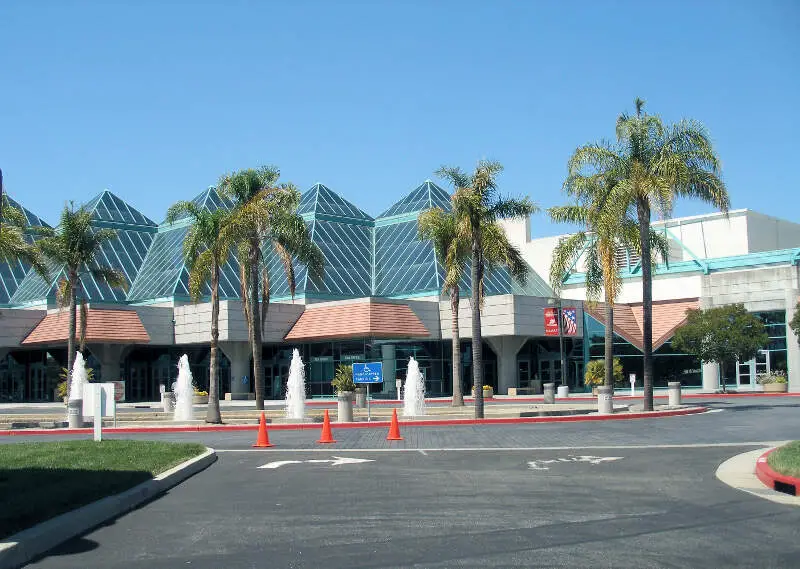
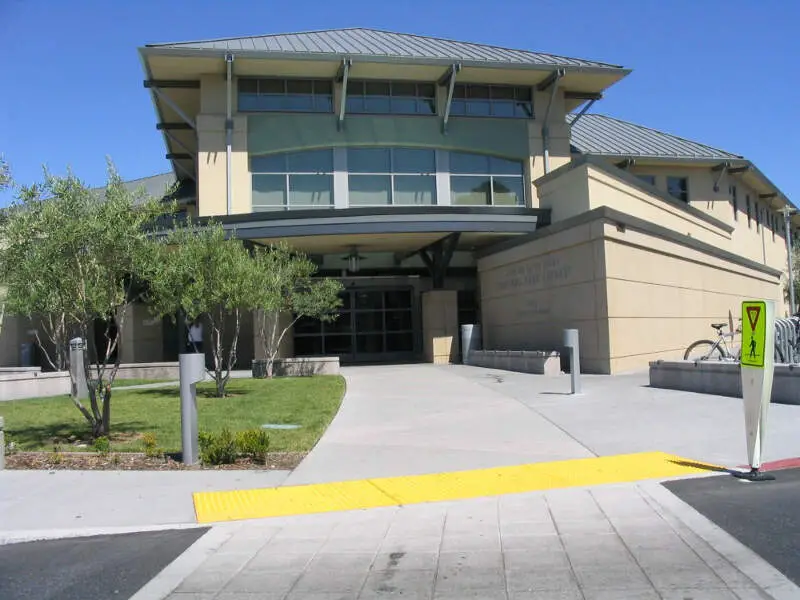
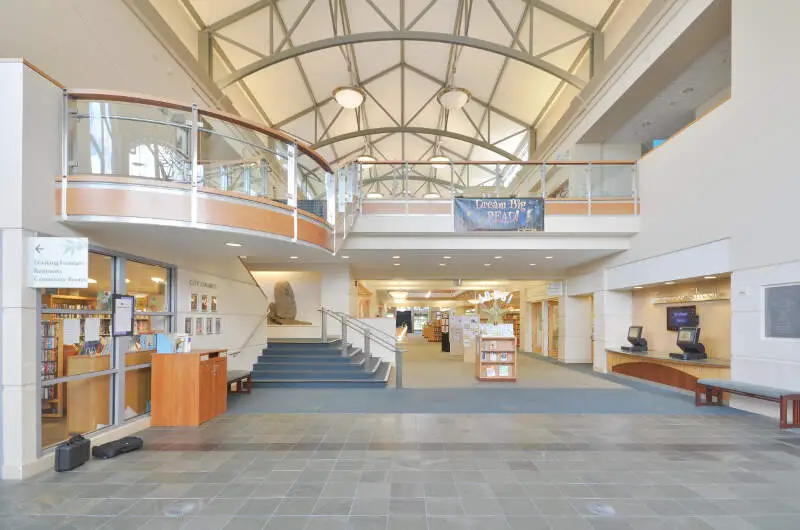
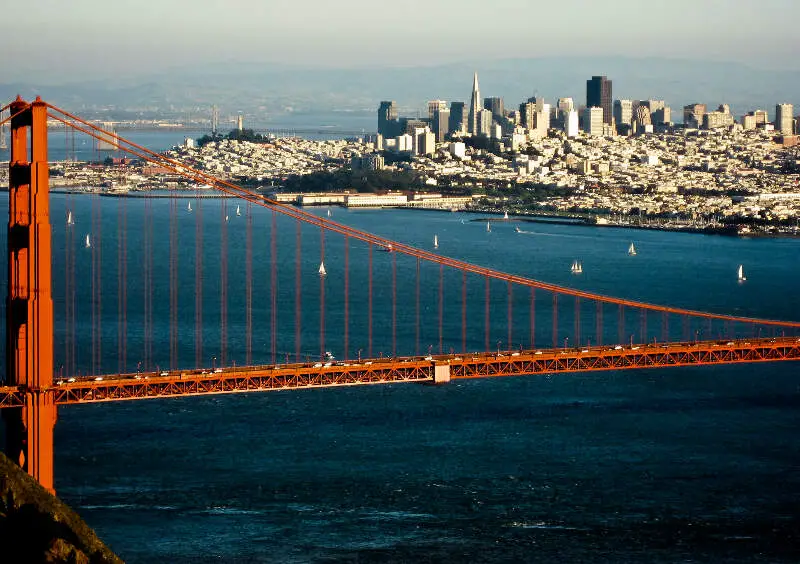
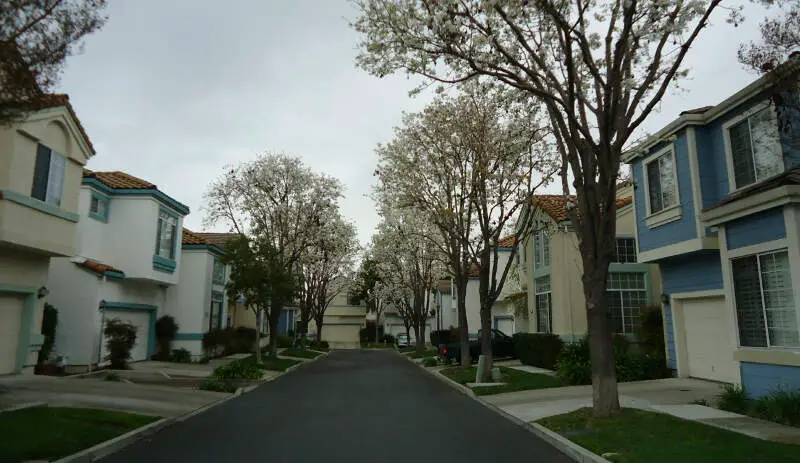
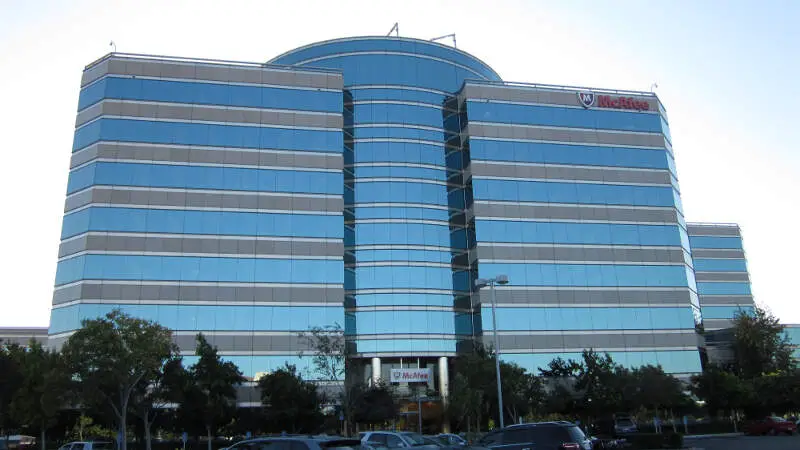
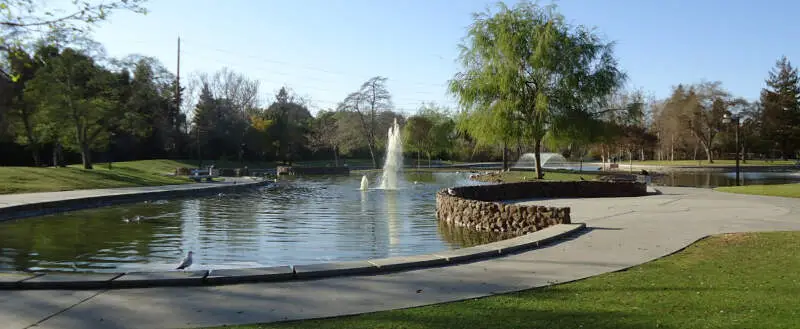
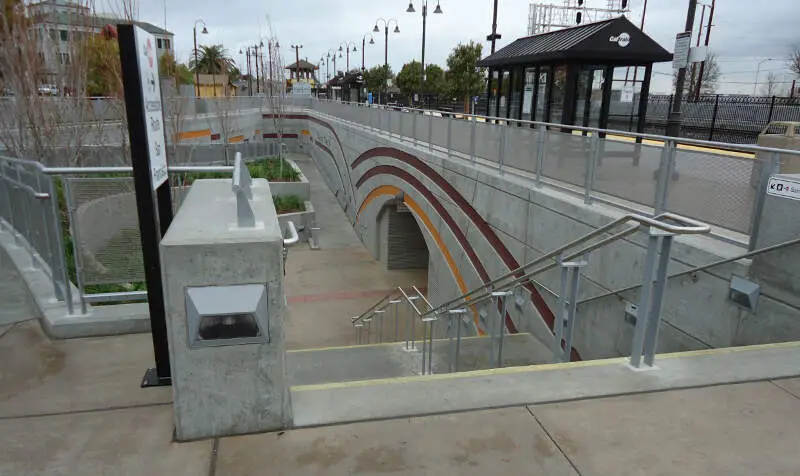
Santa Clara, CA Photos

Rankings for Santa Clara in California


Locations Around Santa Clara
Map Of Santa Clara, CA
Best Places Around Santa Clara
East Foothills, CA
Population 8,630
San Carlos, CA
Population 29,797
Cupertino, CA
Population 58,886
Los Altos, CA
Population 30,736
Sunnyvale, CA
Population 153,455
North Fair Oaks, CA
Population 13,327
Menlo Park, CA
Population 32,775
Mountain View, CA
Population 82,363
Saratoga, CA
Population 30,335
Campbell, CA
Population 42,848
Santa Clara Demographics And Statistics
Population over time in Santa Clara
The current population in Santa Clara is 129,239. The population has increased 14.9% from 2010.
| Year | Population | % Change |
|---|---|---|
| 2023 | 129,239 | 0.9% |
| 2022 | 128,058 | 0.1% |
| 2021 | 127,922 | 0.9% |
| 2020 | 126,723 | -0.8% |
| 2019 | 127,721 | 1.2% |
| 2018 | 126,209 | 1.3% |
| 2017 | 124,635 | 1.6% |
| 2016 | 122,725 | 1.1% |
| 2015 | 121,374 | 1.5% |
| 2014 | 119,525 | 1.4% |
| 2013 | 117,817 | 1.3% |
| 2012 | 116,301 | 1.6% |
| 2011 | 114,482 | 1.8% |
| 2010 | 112,466 | - |
Race / Ethnicity in Santa Clara
Santa Clara is:
28.6% White with 36,937 White residents.
2.0% African American with 2,611 African American residents.
0.1% American Indian with 111 American Indian residents.
47.4% Asian with 61,304 Asian residents.
0.7% Hawaiian with 859 Hawaiian residents.
0.5% Other with 676 Other residents.
4.6% Two Or More with 5,980 Two Or More residents.
16.1% Hispanic with 20,761 Hispanic residents.
| Race | Santa Clara | CA | USA |
|---|---|---|---|
| White | 28.6% | 34.6% | 58.2% |
| African American | 2.0% | 5.3% | 12.0% |
| American Indian | 0.1% | 0.3% | 0.5% |
| Asian | 47.4% | 15.1% | 5.7% |
| Hawaiian | 0.7% | 0.3% | 0.2% |
| Other | 0.5% | 0.5% | 0.5% |
| Two Or More | 4.6% | 4.1% | 3.9% |
| Hispanic | 16.1% | 39.8% | 19.0% |
Gender in Santa Clara
Santa Clara is 47.9% female with 61,869 female residents.
Santa Clara is 52.1% male with 67,370 male residents.
| Gender | Santa Clara | CA | USA |
|---|---|---|---|
| Female | 47.9% | 50.0% | 50.5% |
| Male | 52.1% | 50.0% | 49.5% |
Highest level of educational attainment in Santa Clara for adults over 25
4.0% of adults in Santa Clara completed < 9th grade.
3.0% of adults in Santa Clara completed 9-12th grade.
11.0% of adults in Santa Clara completed high school / ged.
12.0% of adults in Santa Clara completed some college.
6.0% of adults in Santa Clara completed associate's degree.
31.0% of adults in Santa Clara completed bachelor's degree.
26.0% of adults in Santa Clara completed master's degree.
2.0% of adults in Santa Clara completed professional degree.
5.0% of adults in Santa Clara completed doctorate degree.
| Education | Santa Clara | CA | USA |
|---|---|---|---|
| < 9th Grade | 4.0% | 8.0% | 5.0% |
| 9-12th Grade | 3.0% | 7.0% | 6.0% |
| High School / GED | 11.0% | 20.0% | 26.0% |
| Some College | 12.0% | 20.0% | 19.0% |
| Associate's Degree | 6.0% | 8.0% | 9.0% |
| Bachelor's Degree | 31.0% | 22.0% | 21.0% |
| Master's Degree | 26.0% | 10.0% | 10.0% |
| Professional Degree | 2.0% | 3.0% | 2.0% |
| Doctorate Degree | 5.0% | 2.0% | 2.0% |
Household Income For Santa Clara, California
3.9% of households in Santa Clara earn Less than $10,000.
0.8% of households in Santa Clara earn $10,000 to $14,999.
2.9% of households in Santa Clara earn $15,000 to $24,999.
3.1% of households in Santa Clara earn $25,000 to $34,999.
3.6% of households in Santa Clara earn $35,000 to $49,999.
7.1% of households in Santa Clara earn $50,000 to $74,999.
8.2% of households in Santa Clara earn $75,000 to $99,999.
14.4% of households in Santa Clara earn $100,000 to $149,999.
12.1% of households in Santa Clara earn $150,000 to $199,999.
43.9% of households in Santa Clara earn $200,000 or more.
| Income | Santa Clara | CA | USA |
|---|---|---|---|
| Less than $10,000 | 3.9% | 4.4% | 4.9% |
| $10,000 to $14,999 | 0.8% | 3.0% | 3.6% |
| $15,000 to $24,999 | 2.9% | 5.2% | 6.6% |
| $25,000 to $34,999 | 3.1% | 5.5% | 6.8% |
| $35,000 to $49,999 | 3.6% | 8.4% | 10.4% |
| $50,000 to $74,999 | 7.1% | 13.3% | 15.7% |
| $75,000 to $99,999 | 8.2% | 11.8% | 12.7% |
| $100,000 to $149,999 | 14.4% | 17.9% | 17.4% |
| $150,000 to $199,999 | 12.1% | 11.1% | 9.3% |
| $200,000 or more | 43.9% | 19.4% | 12.6% |


