Compare Santa Monica to…
Santa Monica SnackAbility
Overall SnackAbility
Crime in Santa Monica summary. We use data from the FBI to determine the crime rates in Santa Monica. Key points include:
There were 4,953 total crimes in Santa Monica in the last reporting year.
The overall crime rate per 100,000 people in Santa Monica is 5,568.4 / 100k people.
The violent crime rate per 100,000 people in Santa Monica is 778.0 / 100k people.
The property crime rate per 100,000 people in Santa Monica is 4,790.4 / 100k people.
Overall, crime in Santa Monica is 162.76% above the national average.
Total Crimes
Above National Average
Crime In Santa Monica Comparison Table
| Statistic | Count Raw |
Santa Monica / 100k People |
California / 100k People |
National / 100k People |
|---|---|---|---|---|
| Total Crimes Per 100K | 4,953 | 5,568.4 | 2,564.5 | 2,119.2 |
| Violent Crime | 692 | 778.0 | 486.0 | 359.0 |
| Murder | 4 | 4.5 | 4.5 | 5.0 |
| Robbery | 180 | 202.4 | 119.1 | 61.0 |
| Aggravated Assault | 444 | 499.2 | 325.8 | 256.0 |
| Property Crime | 4,261 | 4,790.4 | 2,078.4 | 1,760.0 |
| Burglary | 755 | 848.8 | 305.8 | 229.0 |
| Larceny | 3,009 | 3,382.9 | 1,345.2 | 1,272.0 |
| Car Theft | 497 | 558.8 | 427.5 | 259.0 |
Source: FBI Uniform Crime Reporting (2024)
Cost of living in Santa Monica summary. We use data on the cost of living to determine how expensive it is to live in Santa Monica. Real estate prices drive most of the variance in cost of living around California. Key points include:
The cost of living in Santa Monica is 274 with 100 being average.
The cost of living in Santa Monica is 2.7x higher than the national average.
The median home value in Santa Monica is $1,703,947.
The median income in Santa Monica is $114,885.
Santa Monica's Overall Cost Of Living
Higher Than The National Average
Cost Of Living In Santa Monica Comparison Table
| Living Expense | Santa Monica | California | National Average |
|---|---|---|---|
| Overall | 274 | 142 | 100 |
| Services | 114 | 110 | 100 |
| Groceries | 124 | 118 | 100 |
| Health | 624 | 197 | 100 |
| Housing | 121 | 120 | 100 |
| Transportation | 124 | 121 | 100 |
| Utilities | 132 | 121 | 100 |
Source: Cost of living index, normalized to US average = 100
Santa Monica, CA Weather
The average high in Santa Monica is 75.3° and the average low is 54.1°.
There are 22.7 days of precipitation each year.
Expect an average of 16.2 inches of precipitation each year with 0.2 inches of snow.
| Stat | Santa Monica |
|---|---|
| Average Annual High | 75.3 |
| Average Annual Low | 54.1 |
| Annual Precipitation Days | 22.7 |
| Average Annual Precipitation | 16.2 |
| Average Annual Snowfall | 0.2 |
Average High
Days of Rain
Source: NOAA climate normals (30-year)
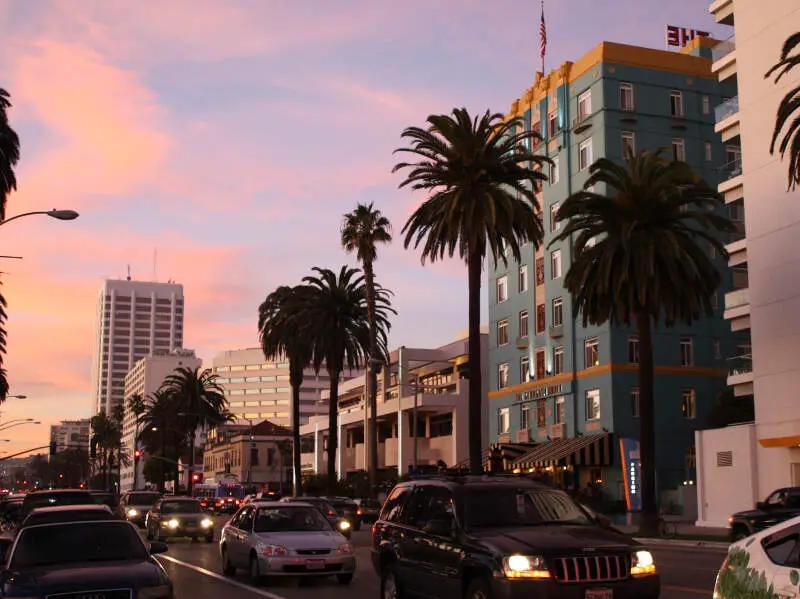
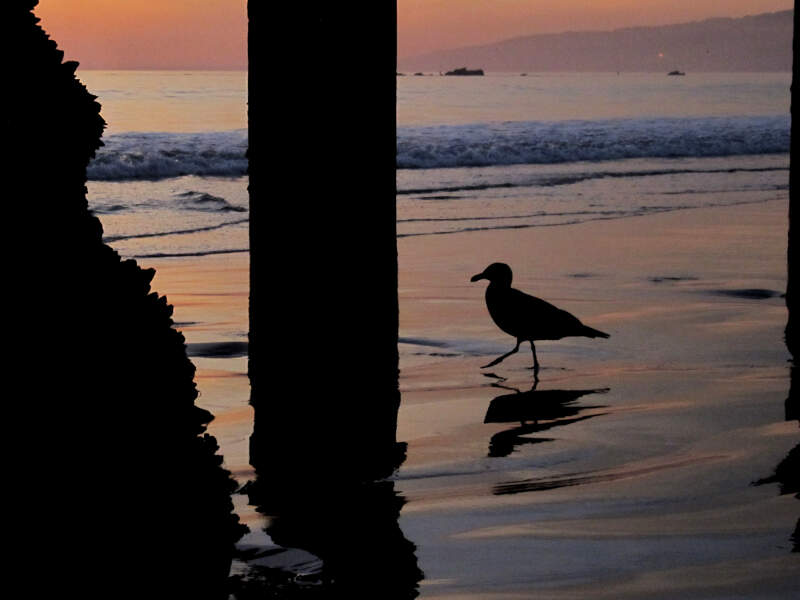
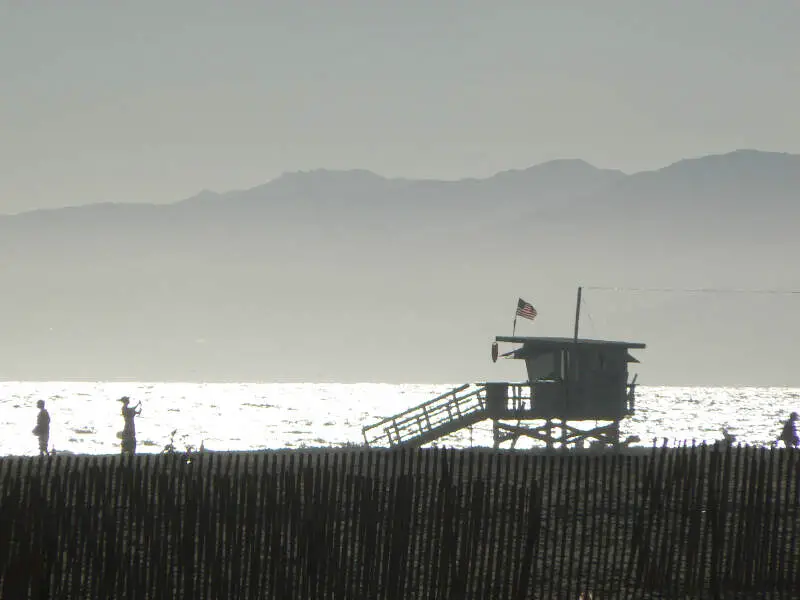
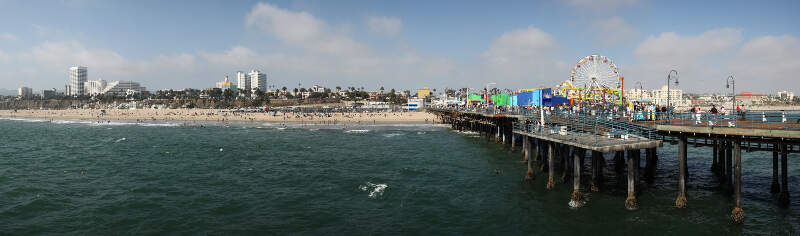
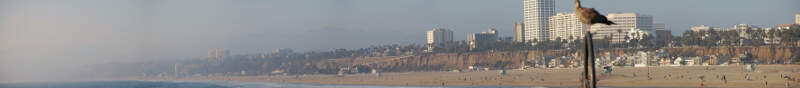
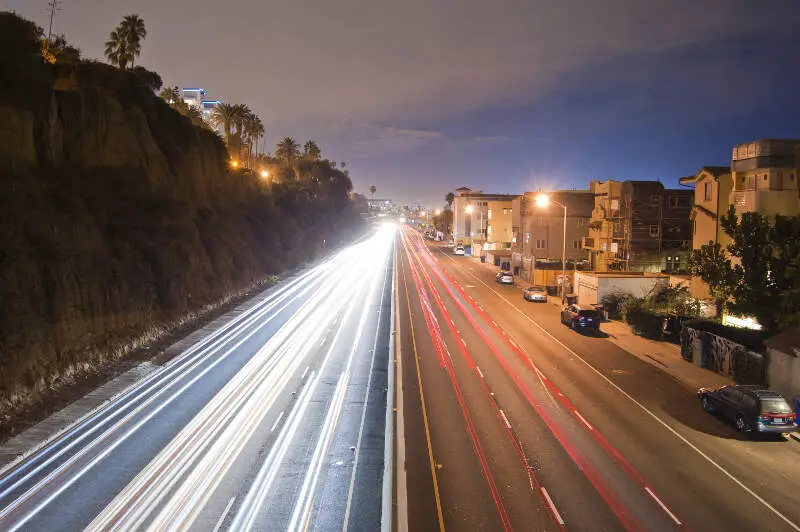
Santa Monica, CA Photos
Rankings & Articles For Santa Monica


Locations Around Santa Monica
Map Of Santa Monica, CA
Best Places Around Santa Monica
Del Aire, CA
Population 11,115
Agoura Hills, CA
Population 19,721
Oak Park, CA
Population 13,757
San Fernando, CA
Population 23,632
Torrance, CA
Population 142,130
South Pasadena, CA
Population 26,068
Redondo Beach, CA
Population 69,291
Rancho Palos Verdes, CA
Population 40,864
Ladera Heights, CA
Population 7,334
West Carson, CA
Population 22,143
Santa Monica Demographics And Statistics
Population over time in Santa Monica
The current population in Santa Monica is 91,169. The population has increased 2.8% from 2010.
| Year | Population | % Change |
|---|---|---|
| 2024 | 91,169 | -0.4% |
| 2023 | 91,535 | -0.7% |
| 2022 | 92,168 | -0.7% |
| 2021 | 92,828 | 1.3% |
| 2020 | 91,600 | 0.0% |
| 2019 | 91,577 | -0.5% |
| 2018 | 92,078 | -0.5% |
| 2017 | 92,495 | 0.3% |
| 2016 | 92,247 | 0.1% |
| 2015 | 92,169 | 0.6% |
| 2014 | 91,619 | 1.0% |
| 2013 | 90,752 | 0.8% |
| 2012 | 90,008 | 1.0% |
| 2011 | 89,153 | 0.5% |
| 2010 | 88,679 | - |
Race / Ethnicity in Santa Monica
See the full breakdown
Santa Monica is:
62.1% White with 56,633 White residents.
5.2% African American with 4,741 African American residents.
0.2% American Indian with 204 American Indian residents.
10.0% Asian with 9,141 Asian residents.
0.2% Hawaiian with 225 Hawaiian residents.
0.7% Other with 662 Other residents.
6.2% Two Or More with 5,626 Two Or More residents.
15.3% Hispanic with 13,937 Hispanic residents.
| Race | Santa Monica | CA | USA |
|---|---|---|---|
| White | 62.1% | 33.8% | 57.4% |
| African American | 5.2% | 5.2% | 11.9% |
| American Indian | 0.2% | 0.3% | 0.5% |
| Asian | 10.0% | 15.3% | 5.9% |
| Hawaiian | 0.2% | 0.3% | 0.2% |
| Other | 0.7% | 0.6% | 0.6% |
| Two Or More | 6.2% | 4.4% | 4.3% |
| Hispanic | 15.3% | 40.2% | 19.3% |
Gender in Santa Monica
See the full breakdown
Santa Monica is 53.1% female with 48,437 female residents.
Santa Monica is 46.9% male with 42,732 male residents.
| Gender | Santa Monica | CA | USA |
|---|---|---|---|
| Female | 53.1% | 50.1% | 50.5% |
| Male | 46.9% | 49.9% | 49.5% |
Highest level of educational attainment in Santa Monica for adults over 25
See the full breakdown
4.0% of adults in Santa Monica completed < 9th grade.
2.0% of adults in Santa Monica completed 9-12th grade.
8.0% of adults in Santa Monica completed high school / ged.
10.0% of adults in Santa Monica completed some college.
6.0% of adults in Santa Monica completed associate's degree.
40.0% of adults in Santa Monica completed bachelor's degree.
18.0% of adults in Santa Monica completed master's degree.
8.0% of adults in Santa Monica completed professional degree.
4.0% of adults in Santa Monica completed doctorate degree.
| Education | Santa Monica | CA | USA |
|---|---|---|---|
| < 9th Grade | 4.0% | 8.0% | 4.0% |
| 9-12th Grade | 2.0% | 7.0% | 6.0% |
| High School / GED | 8.0% | 20.0% | 26.0% |
| Some College | 10.0% | 19.0% | 19.0% |
| Associate's Degree | 6.0% | 8.0% | 9.0% |
| Bachelor's Degree | 40.0% | 23.0% | 22.0% |
| Master's Degree | 18.0% | 10.0% | 10.0% |
| Professional Degree | 8.0% | 3.0% | 2.0% |
| Doctorate Degree | 4.0% | 2.0% | 2.0% |
Household Income For Santa Monica, California
See the full breakdown
7.2% of households in Santa Monica earn Less than $10,000.
3.2% of households in Santa Monica earn $10,000 to $14,999.
4.9% of households in Santa Monica earn $15,000 to $24,999.
4.5% of households in Santa Monica earn $25,000 to $34,999.
6.1% of households in Santa Monica earn $35,000 to $49,999.
9.3% of households in Santa Monica earn $50,000 to $74,999.
9.0% of households in Santa Monica earn $75,000 to $99,999.
15.4% of households in Santa Monica earn $100,000 to $149,999.
11.0% of households in Santa Monica earn $150,000 to $199,999.
29.5% of households in Santa Monica earn $200,000 or more.
| Income | Santa Monica | CA | USA |
|---|---|---|---|
| Less than $10,000 | 7.2% | 4.5% | 5.0% |
| $10,000 to $14,999 | 3.2% | 2.9% | 3.4% |
| $15,000 to $24,999 | 4.9% | 5.0% | 6.3% |
| $25,000 to $34,999 | 4.5% | 5.3% | 6.6% |
| $35,000 to $49,999 | 6.1% | 8.1% | 10.1% |
| $50,000 to $74,999 | 9.3% | 13.0% | 15.5% |
| $75,000 to $99,999 | 9.0% | 11.6% | 12.6% |
| $100,000 to $149,999 | 15.4% | 17.8% | 17.5% |
| $150,000 to $199,999 | 11.0% | 11.3% | 9.6% |
| $200,000 or more | 29.5% | 20.5% | 13.4% |
Source: U.S. Census ACS 5-year estimates (2024)


