Long Beachvs.Santa Monica Which City Is Right for You in 2026?
A head-to-head guide to cost of living, jobs, transportation, weather, crime, and quality of life — so you can decide where to live, work, or visit.
Updated 2026-05-26 · By HomeSnacks Editorial
Long Beach vs. Santa Monica at a glance
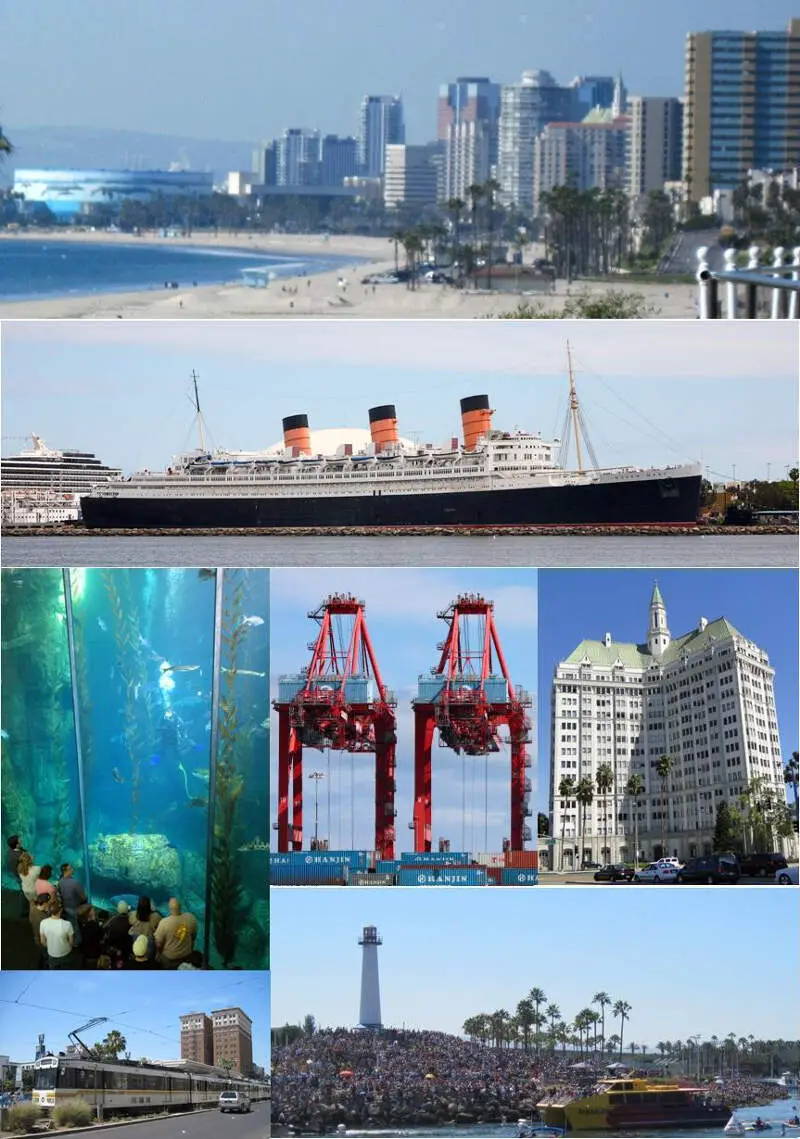
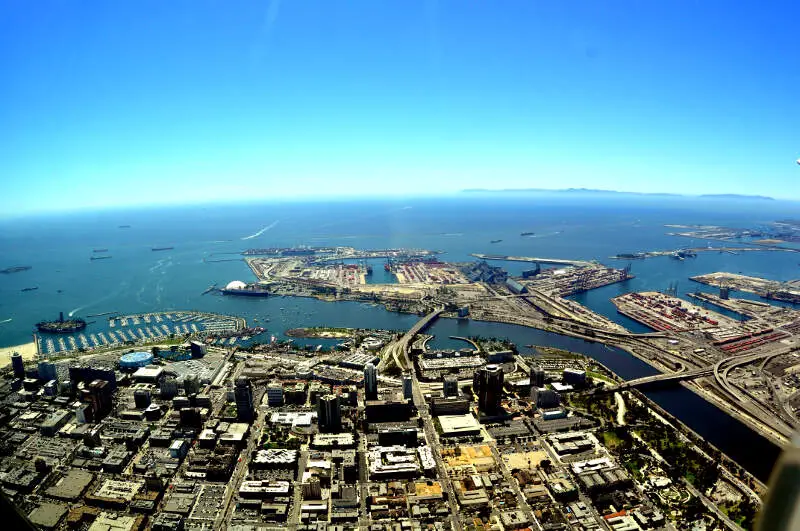
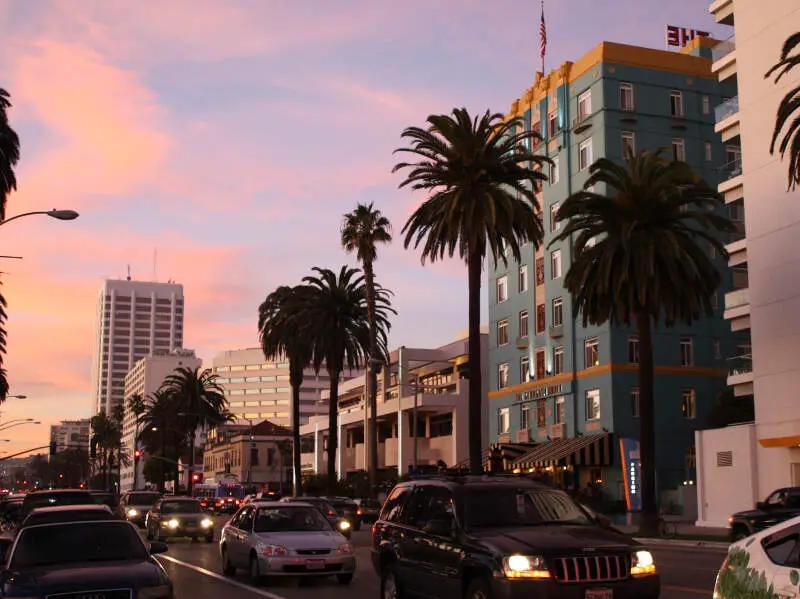
Choosing between Long Beach, CA and Santa Monica, CA comes down to which trade-offs you're willing to make. Long Beach is a coastal city in southeastern Los Angeles County, California, United States. It is the 44th-most populous city in the United States, with a population of 451,307 as of 2022. Santa Monica is a city in Los Angeles County, California, United States. It is situated along Santa Monica Bay on California's South Coast. As of the 2020 census, Santa Monica had a population of 93,076.
On cost of living, Long Beach is the cheaper city: its overall index sits at 163 versus 274 in Santa Monica (100 = national average). Median home values run $857,860 in Long Beach and $1,703,947 in Santa Monica, with median rents at $1,871 and $2,402 respectively. That puts the home-value-to-income ratio at 9.8x in Long Beach versus 14.8x in Santa Monica.
FBI crime data adds another wrinkle. Long Beach reports 4,155 total crimes per 100,000 residents annually versus 5,568 in Santa Monica. Long Beach is the more racially diverse of the two on a Herfindahl index basis — Long Beach skews 44% Hispanic while Santa Monica skews 62% White. On HomeSnacks' overall SnackAbility score, Santa Monica edges ahead at 8.5/10 versus 7/10 for Long Beach.
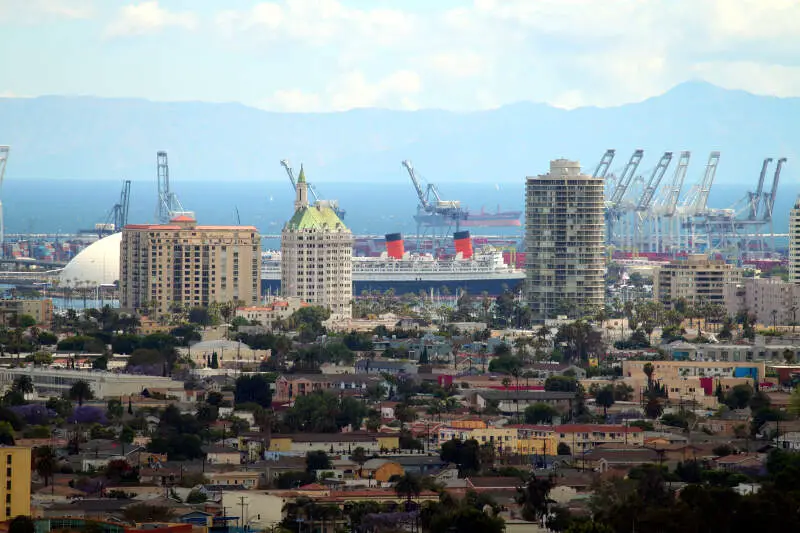
Long Beach vs. Santa Monica in photos
A side-by-side look at each city.


Cost of living
Long Beach is the cheaper city overall — 41% higher in Santa Monica than its rival. Index baseline: 100 = national average.
| Living expense | Long Beach | Santa Monica | US average |
|---|---|---|---|
| Overall | 163 | 274 | 100 |
| Services | 110 | 114 | 100 |
| Groceries | 119 | 124 | 100 |
| Health | 267 | 624 | 100 |
| Housing | 118 | 121 | 100 |
| Transportation | 121 | 124 | 100 |
| Utilities | 124 | 132 | 100 |
Lower index = cheaper. 100 = U.S. national average. Bar inside each cell scales relative to the highest value in the table.
Sources: HomeSnacks Cost of Living indices, normalized so 100 = U.S. national average. Drill in: Long Beach cost of living, Santa Monica cost of living, or the cheapest cities in America.
Housing breakdown
Home prices are higher in Long Beach. Compare absolute price and price-to-income — a $500k home in a $100k-income city is very different from one in a $50k-income city.
| Metric | Long Beach | Santa Monica | United States |
|---|---|---|---|
| Median Home Value | $857,860 | $1,703,947 | $332,700 |
| Median Rent | $1,871 | $2,402 | $1,413 |
| Median Income | $87,430 | $114,885 | $80,734 |
| Home Value To Income | 9.8x | 14.8x | 4.1x |
| Rent To Monthly Income | 0.26x | 0.25x | 0.21x |
Source: U.S. Census Bureau ACS 2020-2024. See also states with the highest rent in America.
Crime
Long Beach is the safer city — total crime rate of 4,155 per 100k people vs 5,568 for Santa Monica. US average: 2,119.
| Crime (per 100k) | Long Beach | Santa Monica | US average |
|---|---|---|---|
| Total crime | 4,155 | 5,568 | 2,119 |
| Murder | 8 | 4 | 5 |
| Robbery | 223 | 202 | 61 |
| Aggravated Assault | 400 | 499 | 256 |
| Violent Crime | 676 | 778 | 359 |
| Burglary | 705 | 849 | 229 |
| Larceny | 1,796 | 3,383 | 1,272 |
| Car Theft | 978 | 559 | 259 |
| Property Crime | 3,479 | 4,790 | 1,760 |
Lower = safer. Bar inside each cell scales relative to the highest crime rate in the table.
Source: FBI Uniform Crime Reporting (2024). All rates are per 100,000 people. City pages: Long Beach crime, Santa Monica crime. See also: safest cities in America.
Diversity
Long Beach is more racially diverse — lower HHI (closer to 0) means a more even mix across groups.
| Group | Long Beach | Santa Monica | United States |
|---|---|---|---|
| White | 26.2% | 62.1% | 57.4% |
| African American | 11.4% | 5.2% | 11.9% |
| American Indian | 0.3% | 0.2% | 0.5% |
| Asian | 12.7% | 10.0% | 5.9% |
| Hawaiian | 0.6% | 0.2% | 0.2% |
| Other | 0.5% | 0.7% | 0.6% |
| Two Or More | 4.5% | 6.2% | 4.3% |
| Hispanic | 43.8% | 15.3% | 19.3% |
Source: U.S. Census ACS 2020-2024. Lower HHI = more even racial mix. See also: most diverse cities in America.
SnackAbility — overall quality of life
Santa Monica scores higher overall — 8.5/10 vs 7/10. SnackAbility is our 1–10 quality-of-life score; the median U.S. city scores a 7.
SnackAbility is a HomeSnacks proprietary 1–10 score blending jobs, housing, education, commute, amenities, affordability, crime, and diversity. Median U.S. city ≈ 7. Data: Census, BLS, FBI. See also: best places to live in America.
Getting around: Long Beach vs. Santa Monica
How each city handles commuting, transit, walkability, and car culture — the day-to-day reality that shapes where you'd actually want to live.
Getting around Long Beach is primarily a car affair — the city sits at the confluence of the 405, 710, and 91 freeways, which gives you regional access but also means you will sit in traffic. Long Beach Transit and the Metro A Line (Blue) connect downtown to the broader LA Metro grid, and the free Passport shuttle loops through the waterfront and downtown core. Protected bike lanes make cycling viable in flatter neighborhoods like Belmont Shore and the East Village Arts District.
Santa Monica leans more heavily on transit and foot power. The Metro E Line (Expo) drops you at 4th & Colorado, putting downtown Los Angeles about 45 minutes away without touching the 10 freeway. The Big Blue Bus covers the Westside well, and Santa Monica consistently ranks among Southern California's most walkable cities.
Third Street Promenade, Main Street, and Montana Avenue are all reachable on foot or by Breeze Bike Share. If avoiding a car commute is a priority, Santa Monica has a real edge.
Jobs and careers in Long Beach vs. Santa Monica
The local job market, dominant industries, and which city to choose based on your career.
Long Beach anchors its economy around the Port of Long Beach, one of the busiest container ports in the Western Hemisphere, which feeds logistics, trade, and supply-chain jobs across the region. Boeing's commercial division has a large presence, Memorial Care and Dignity Health drive healthcare hiring, and Cal State Long Beach supplies a steady pipeline of graduates. Median household income sits at $87,430, solidly middle-class but a real gap below what you will find across town.
Santa Monica is ground zero for Silicon Beach. Hulu, Snap, and a cluster of ad-tech and streaming companies have offices within a few blocks of the pier, and the entertainment industry bleeds in from neighboring Culver City and Venice. That concentration of white-collar tech and media jobs pushes median household income to $114,885.
The tradeoff is a cost of living index of 274 against Long Beach's 163 — meaning the higher paychecks in Santa Monica get eaten faster by rent (median $2,402 versus Long Beach's $1,871) and everyday expenses.
Weather and climate
What to expect day-to-day — sun, fog, heat, rain, and the seasonal extremes that shape the lifestyle.
Both cities run on a classic Southern California Mediterranean rhythm: warm, dry summers and mild, occasionally wet winters with almost no risk of frost. That said, Long Beach sits a few miles inland from the open ocean in enough spots that it tends to run two to four degrees warmer in summer and sees the June marine layer burn off earlier in the day. Neighborhoods near Belmont Shore get the full beach breeze, but areas closer to the 710 corridor can feel noticeably hotter in a late-September heat wave.
Santa Monica hugs the coast directly and is perpetually cooled by onshore flow off the Pacific. Summer highs rarely crack 80°F near the water, and the marine layer (locals call it "June Gloom") can keep mornings gray well into July. If you prefer cooler, more consistent temperatures year-round, Santa Monica delivers.
If you want more sunshine hours in the morning and do not mind warmer afternoons, Long Beach tilts your way. Neither city will ask you to own a heavy coat.
Culture, nightlife, and entertainment
Food, music, neighborhoods, and the city vibe that gives each place its personality.
Long Beach punches above its weight culturally for a city its size. The Museum of Latin American Art (MOLAA) is the only museum in the US dedicated exclusively to contemporary Latin American art, the Queen Mary sits moored as a floating hotel and event venue, and the East Village Arts District draws a genuine gallery and live-music crowd.
Belmont Shore's 2nd Street is a walkable strip of neighborhood bars and independent restaurants, and Long Beach Pride is one of the longest-running LGBTQ+ festivals in the country. The city's Cambodian community along Anaheim Street gives it a culinary depth that surprises first-time visitors.
Santa Monica's cultural life skews wealthier and more tourist-facing. Third Street Promenade and the Santa Monica Pier dominate the visitor experience, but Bergamot Station houses a genuine cluster of contemporary art galleries worth an afternoon. Montana Avenue offers upscale boutique dining, and the Broad Stage books serious theater and chamber music.
Nightlife near the Promenade can feel generic, but Pico Boulevard and the area around Main Street host locally rooted bars and restaurants that feel less like a theme park. Expect to spend more for a comparable night out than you would in Long Beach.
Outdoor activities and day trips
Parks, beaches, hikes, and the weekend escapes that define life outside the city limits.
Long Beach has a wide, flat beach that stretches from Belmont Shore down to the breakwater. Shoreline Aquatic Park is a hub for kayaking, paddleboarding, and sailing, and the Colorado Lagoon has been restored into an urban nature spot for birding and kayaking.
El Dorado Regional Park, a few miles inland, gives you 450 acres of trails, a nature center, and disc golf. For day trips, the Catalina Island ferry departs from the Long Beach cruise terminal in about an hour.
Santa Monica's beach is narrower but feeds directly into the South Bay Bike Path, a paved coastal trail that runs 22 miles from Pacific Palisades to Torrance (one of the best urban cycling routes in the country). Palisades Park sits atop the bluffs overlooking the ocean and is worth a sunset walk. Santa Monica is also the de facto gateway to the Santa Monica Mountains: Topanga Canyon, Malibu Creek State Park, and the Backbone Trail are all within 20 minutes, and Long Beach has nothing comparable that close.
Bottom line: which city is right for you?
Based on the head-to-head data above, here's the short version — pick the city that lines up with what you actually care about.
Choose Long Beach if you prioritize…
- a lower cost of living (cheaper groceries, services, and day-to-day expenses).
- lower crime — a safer place to live, work, and raise a family.
- more affordable housing relative to Santa Monica.
- a more racially diverse community (lower HHI on Census data).
Choose Santa Monica if you prioritize…
- a higher overall SnackAbility quality-of-life score.
Methodology: winners are picked from public data — U.S. Census Bureau ACS (income, home value, rent, race/HHI), FBI Uniform Crime Reporting (crime rates per 100k), and HomeSnacks' proprietary SnackAbility quality-of-life score, which blends Bureau of Labor Statistics data with the above.
More about California

Best Places To Live In California
Photo: Public domain
Cheapest Places To Live In California
Photo: Public domain
Most Dangerous Cities In California
Photo: Public domain
Best Places To Raise A Family In California
Photo: Public domain
Best Places To Retire In California
Photo: Public domain
Richest Cities In California
Photo: Public domain
Safest Places In California
Photo: Public domain
Worst Places To Live In California
Photo: Public domain