Sonoma SnackAbility
Overall SnackAbility
Crime in Sonoma summary. We use data from the FBI to determine the crime rates in Sonoma. Key points include:
There were 141 total crimes in Sonoma in the last reporting year.
The overall crime rate per 100,000 people in Sonoma is 1,332.3 / 100k people.
The violent crime rate per 100,000 people in Sonoma is 179.5 / 100k people.
The property crime rate per 100,000 people in Sonoma is 1,152.8 / 100k people.
Overall, crime in Sonoma is -37.13% below the national average.
Total Crimes
Below National Average
Crime In Sonoma Comparison Table
| Statistic | Count Raw |
Sonoma / 100k People |
California / 100k People |
National / 100k People |
|---|---|---|---|---|
| Total Crimes Per 100K | 141 | 1,332.3 | 2,564.5 | 2,119.2 |
| Violent Crime | 19 | 179.5 | 486.0 | 359.0 |
| Murder | 0 | 0.0 | 4.5 | 5.0 |
| Robbery | 4 | 37.8 | 119.1 | 61.0 |
| Aggravated Assault | 14 | 132.3 | 325.8 | 256.0 |
| Property Crime | 122 | 1,152.8 | 2,078.4 | 1,760.0 |
| Burglary | 22 | 207.9 | 305.8 | 229.0 |
| Larceny | 92 | 869.3 | 1,345.2 | 1,272.0 |
| Car Theft | 8 | 75.6 | 427.5 | 259.0 |
Source: FBI Uniform Crime Reporting (2024)
Cost of living in Sonoma summary. We use data on the cost of living to determine how expensive it is to live in Sonoma. Real estate prices drive most of the variance in cost of living around California. Key points include:
The cost of living in Sonoma is 193 with 100 being average.
The cost of living in Sonoma is 1.9x higher than the national average.
The median home value in Sonoma is $943,021.
The median income in Sonoma is $98,527.
Sonoma's Overall Cost Of Living
Higher Than The National Average
Cost Of Living In Sonoma Comparison Table
| Living Expense | Sonoma | California | National Average |
|---|---|---|---|
| Overall | 193 | 142 | 100 |
| Services | 111 | 110 | 100 |
| Groceries | 114 | 118 | 100 |
| Health | 374 | 197 | 100 |
| Housing | 113 | 120 | 100 |
| Transportation | 116 | 121 | 100 |
| Utilities | 124 | 121 | 100 |
Source: Cost of living index, normalized to US average = 100
Sonoma, CA Weather
The average high in Sonoma is 69.7° and the average low is 46.0°.
There are 54.5 days of precipitation each year.
Expect an average of 40.4 inches of precipitation each year with 0.1 inches of snow.
| Stat | Sonoma |
|---|---|
| Average Annual High | 69.7 |
| Average Annual Low | 46.0 |
| Annual Precipitation Days | 54.5 |
| Average Annual Precipitation | 40.4 |
| Average Annual Snowfall | 0.1 |
Average High
Days of Rain
Source: NOAA climate normals (30-year)
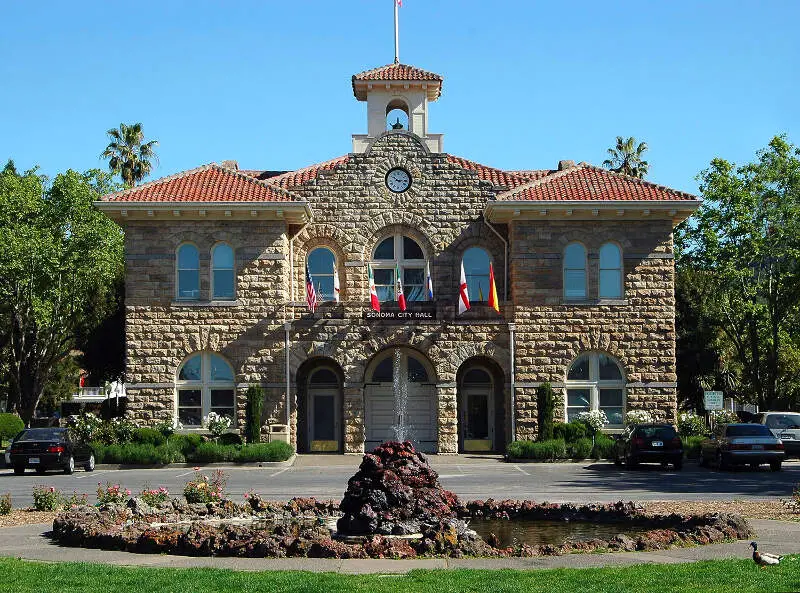
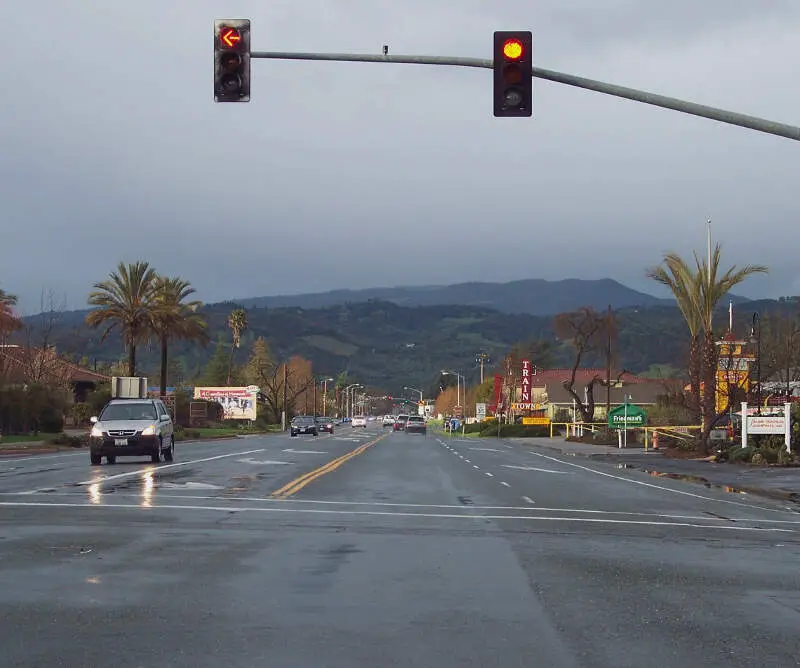
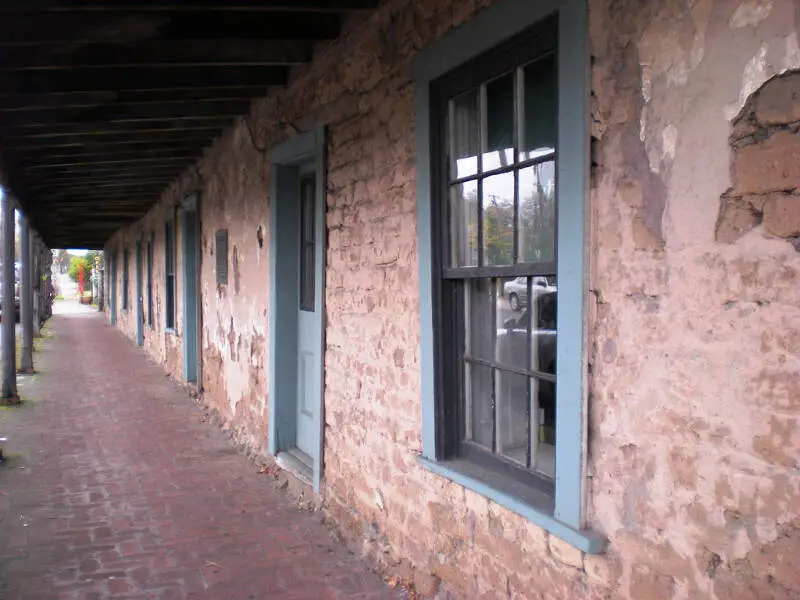
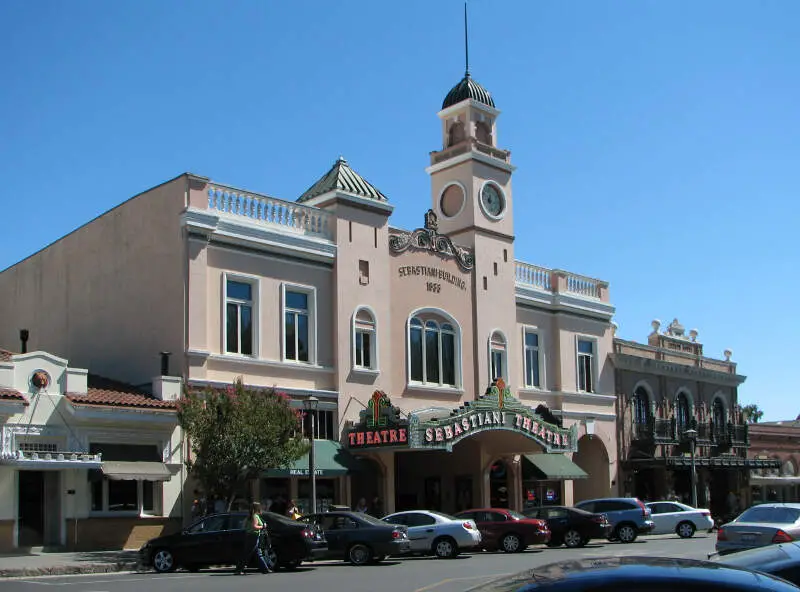
Sonoma, CA Photos


Rankings & Articles For Sonoma


Locations Around Sonoma
Map Of Sonoma, CA
Best Places Around Sonoma
Lucas Valley-Marinwood, CA
Population 6,473
Cotati, CA
Population 7,489
American Canyon, CA
Population 21,691
Napa, CA
Population 78,239
Petaluma, CA
Population 59,247
Novato, CA
Population 52,546
Santa Rosa, CA
Population 177,090
Rohnert Park, CA
Population 44,575
St. Helena, CA
Population 5,318
Sonoma Demographics And Statistics
Population over time in Sonoma
The current population in Sonoma is 10,670. The population has increased 3.7% from 2010.
| Year | Population | % Change |
|---|---|---|
| 2024 | 10,670 | -0.5% |
| 2023 | 10,726 | 0.2% |
| 2022 | 10,702 | -1.1% |
| 2021 | 10,819 | -2.4% |
| 2020 | 11,082 | 0.1% |
| 2019 | 11,075 | 0.0% |
| 2018 | 11,074 | 0.5% |
| 2017 | 11,014 | 0.6% |
| 2016 | 10,952 | 0.5% |
| 2015 | 10,897 | 0.7% |
| 2014 | 10,818 | 1.0% |
| 2013 | 10,710 | 1.0% |
| 2012 | 10,602 | 1.6% |
| 2011 | 10,430 | 1.3% |
| 2010 | 10,292 | - |
Race / Ethnicity in Sonoma
See the full breakdown
Sonoma is:
80.1% White with 8,542 White residents.
1.2% African American with 128 African American residents.
0.0% American Indian with 0 American Indian residents.
1.9% Asian with 203 Asian residents.
1.3% Hawaiian with 135 Hawaiian residents.
0.4% Other with 39 Other residents.
2.7% Two Or More with 286 Two Or More residents.
12.5% Hispanic with 1,337 Hispanic residents.
| Race | Sonoma | CA | USA |
|---|---|---|---|
| White | 80.1% | 33.8% | 57.4% |
| African American | 1.2% | 5.2% | 11.9% |
| American Indian | 0.0% | 0.3% | 0.5% |
| Asian | 1.9% | 15.3% | 5.9% |
| Hawaiian | 1.3% | 0.3% | 0.2% |
| Other | 0.4% | 0.6% | 0.6% |
| Two Or More | 2.7% | 4.4% | 4.3% |
| Hispanic | 12.5% | 40.2% | 19.3% |
Gender in Sonoma
See the full breakdown
Sonoma is 53.9% female with 5,753 female residents.
Sonoma is 46.1% male with 4,917 male residents.
| Gender | Sonoma | CA | USA |
|---|---|---|---|
| Female | 53.9% | 50.1% | 50.5% |
| Male | 46.1% | 49.9% | 49.5% |
Highest level of educational attainment in Sonoma for adults over 25
See the full breakdown
2.0% of adults in Sonoma completed < 9th grade.
2.0% of adults in Sonoma completed 9-12th grade.
18.0% of adults in Sonoma completed high school / ged.
20.0% of adults in Sonoma completed some college.
7.0% of adults in Sonoma completed associate's degree.
34.0% of adults in Sonoma completed bachelor's degree.
14.0% of adults in Sonoma completed master's degree.
2.0% of adults in Sonoma completed professional degree.
1.0% of adults in Sonoma completed doctorate degree.
| Education | Sonoma | CA | USA |
|---|---|---|---|
| < 9th Grade | 2.0% | 8.0% | 4.0% |
| 9-12th Grade | 2.0% | 7.0% | 6.0% |
| High School / GED | 18.0% | 20.0% | 26.0% |
| Some College | 20.0% | 19.0% | 19.0% |
| Associate's Degree | 7.0% | 8.0% | 9.0% |
| Bachelor's Degree | 34.0% | 23.0% | 22.0% |
| Master's Degree | 14.0% | 10.0% | 10.0% |
| Professional Degree | 2.0% | 3.0% | 2.0% |
| Doctorate Degree | 1.0% | 2.0% | 2.0% |
Household Income For Sonoma, California
See the full breakdown
3.2% of households in Sonoma earn Less than $10,000.
2.1% of households in Sonoma earn $10,000 to $14,999.
3.4% of households in Sonoma earn $15,000 to $24,999.
5.4% of households in Sonoma earn $25,000 to $34,999.
6.6% of households in Sonoma earn $35,000 to $49,999.
15.1% of households in Sonoma earn $50,000 to $74,999.
16.4% of households in Sonoma earn $75,000 to $99,999.
15.5% of households in Sonoma earn $100,000 to $149,999.
10.9% of households in Sonoma earn $150,000 to $199,999.
21.4% of households in Sonoma earn $200,000 or more.
| Income | Sonoma | CA | USA |
|---|---|---|---|
| Less than $10,000 | 3.2% | 4.5% | 5.0% |
| $10,000 to $14,999 | 2.1% | 2.9% | 3.4% |
| $15,000 to $24,999 | 3.4% | 5.0% | 6.3% |
| $25,000 to $34,999 | 5.4% | 5.3% | 6.6% |
| $35,000 to $49,999 | 6.6% | 8.1% | 10.1% |
| $50,000 to $74,999 | 15.1% | 13.0% | 15.5% |
| $75,000 to $99,999 | 16.4% | 11.6% | 12.6% |
| $100,000 to $149,999 | 15.5% | 17.8% | 17.5% |
| $150,000 to $199,999 | 10.9% | 11.3% | 9.6% |
| $200,000 or more | 21.4% | 20.5% | 13.4% |
Source: U.S. Census ACS 5-year estimates (2024)


