Whittier, CA
Demographics And Statistics
Living In Whittier, California Summary
Life in Whittier research summary. HomeSnacks has been using Saturday Night Science to research the quality of life in Whittier over the past nine years using Census, FBI, Zillow, and other primary data sources. Based on the most recently available data, we found the following about life in Whittier:
The population in Whittier is 85,925.
The median home value in Whittier is $800,239.
The median income in Whittier is $92,374.
The cost of living in Whittier is 164 which is 1.6x higher than the national average.
The median rent in Whittier is $1,829.
The unemployment rate in Whittier is 5.4%.
The poverty rate in Whittier is 8.8%.
The average high in Whittier is 75.3° and the average low is 54.1°.
Whittier SnackAbility
Overall SnackAbility
Whittier, CA Crime Report
Crime in Whittier summary. We use data from the FBI to determine the crime rates in Whittier. Key points include:
There were 2,384 total crimes in Whittier in the last reporting year.
The overall crime rate per 100,000 people in Whittier is 2,865.9 / 100k people.
The violent crime rate per 100,000 people in Whittier is 490.5 / 100k people.
The property crime rate per 100,000 people in Whittier is 2,375.4 / 100k people.
Overall, crime in Whittier is 35.23% above the national average.
Total Crimes
Above National Average
Crime In Whittier Comparison Table
| Statistic | Count Raw |
Whittier / 100k People |
California / 100k People |
National / 100k People |
|---|---|---|---|---|
| Total Crimes Per 100K | 2,384 | 2,865.9 | 2,564.5 | 2,119.2 |
| Violent Crime | 408 | 490.5 | 486.0 | 359.0 |
| Murder | 5 | 6.0 | 4.5 | 5.0 |
| Robbery | 119 | 143.1 | 119.1 | 61.0 |
| Aggravated Assault | 260 | 312.6 | 325.8 | 256.0 |
| Property Crime | 1,976 | 2,375.4 | 2,078.4 | 1,760.0 |
| Burglary | 284 | 341.4 | 305.8 | 229.0 |
| Larceny | 1,336 | 1,606.0 | 1,345.2 | 1,272.0 |
| Car Theft | 356 | 428.0 | 427.5 | 259.0 |
Whittier, CA Cost Of Living
Cost of living in Whittier summary. We use data on the cost of living to determine how expensive it is to live in Whittier. Real estate prices drive most of the variance in cost of living around California. Key points include:
The cost of living in Whittier is 164 with 100 being average.
The cost of living in Whittier is 1.6x higher than the national average.
The median home value in Whittier is $800,239.
The median income in Whittier is $92,374.
Whittier's Overall Cost Of Living
Higher Than The National Average
Cost Of Living In Whittier Comparison Table
| Living Expense | Whittier | California | National Average | |
|---|---|---|---|---|
| Overall | 164 | 141 | 100 | |
| Services | 115 | 110 | 100 | |
| Groceries | 110 | 112 | 100 | |
| Health | 108 | 110 | 100 | |
| Housing | 269 | 195 | 100 | |
| Transportation | 123 | 125 | 100 | |
| Utilities | 113 | 128 | 100 | |
Whittier, CA Weather
The average high in Whittier is 75.3° and the average low is 54.1°.
There are 22.7 days of precipitation each year.
Expect an average of 16.2 inches of precipitation each year with 0.2 inches of snow.
| Stat | Whittier |
|---|---|
| Average Annual High | 75.3 |
| Average Annual Low | 54.1 |
| Annual Precipitation Days | 22.7 |
| Average Annual Precipitation | 16.2 |
| Average Annual Snowfall | 0.2 |
Average High
Days of Rain
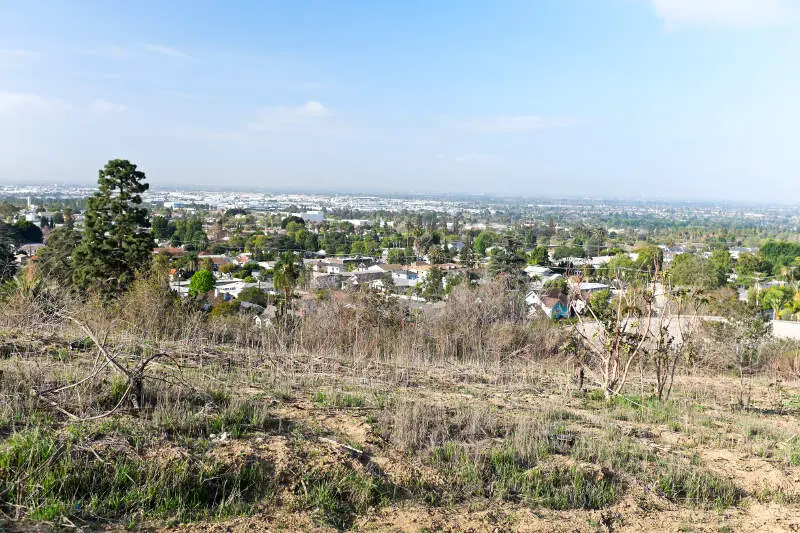
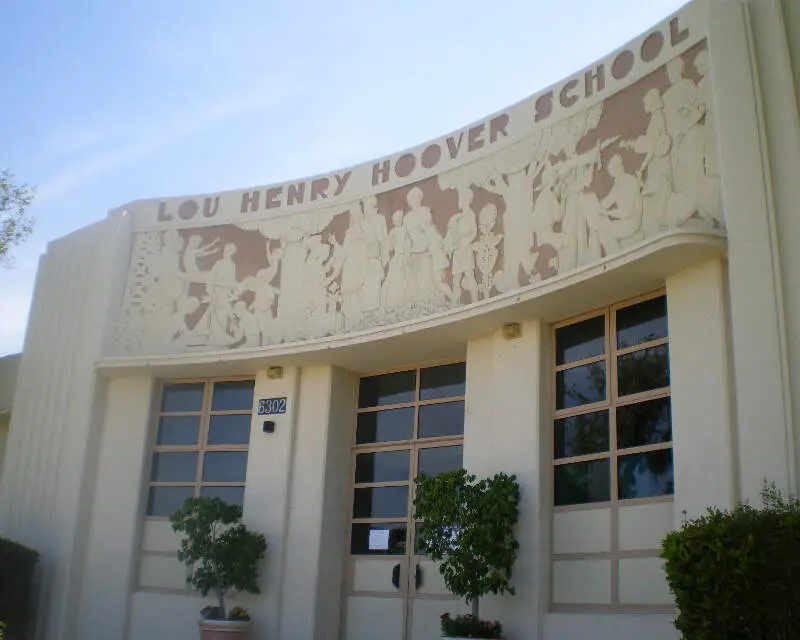
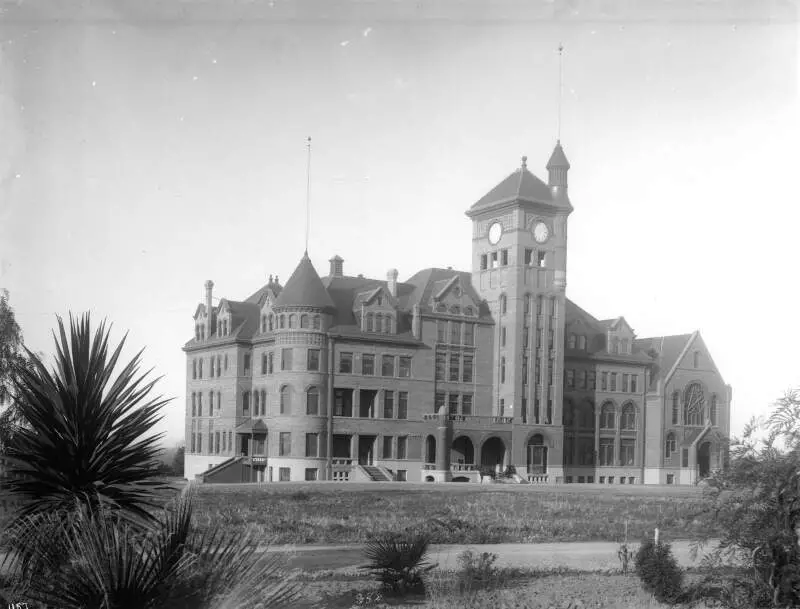
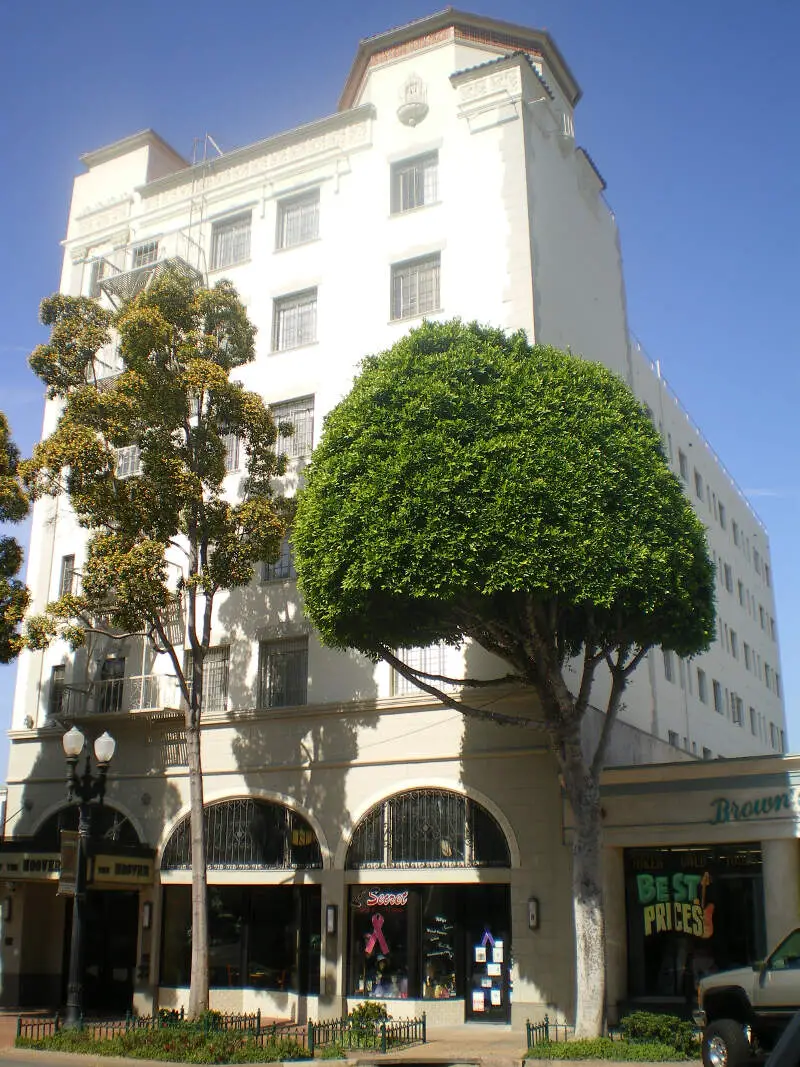
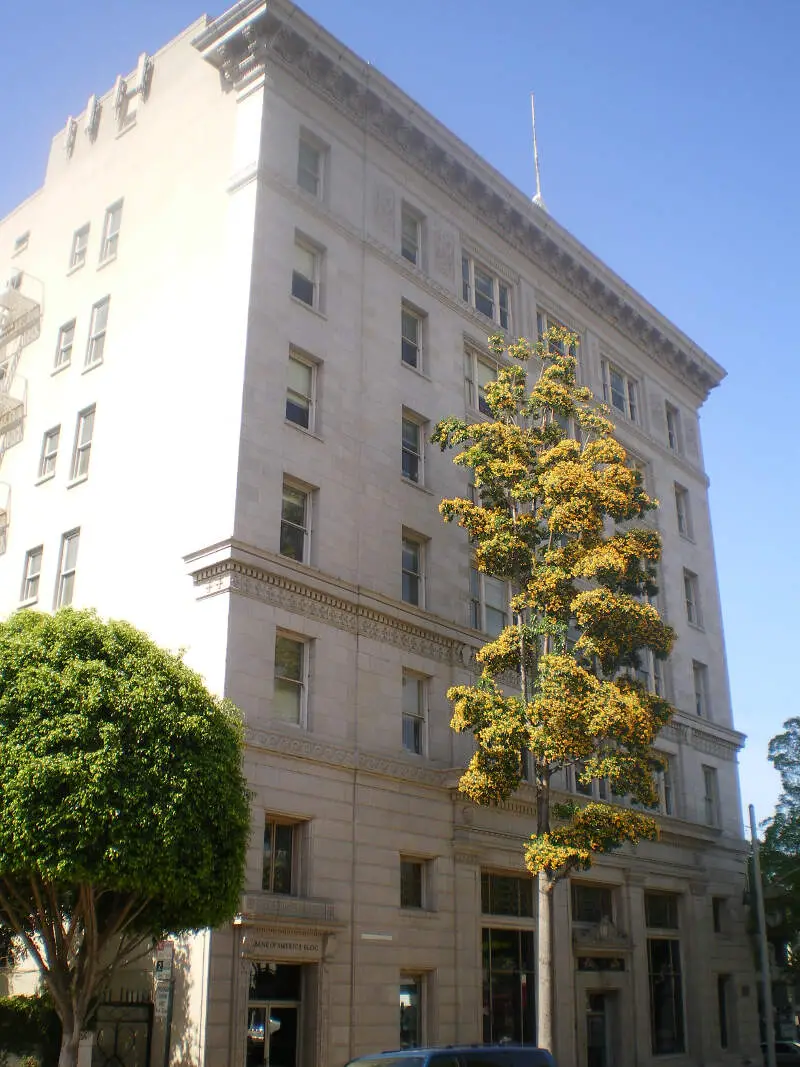
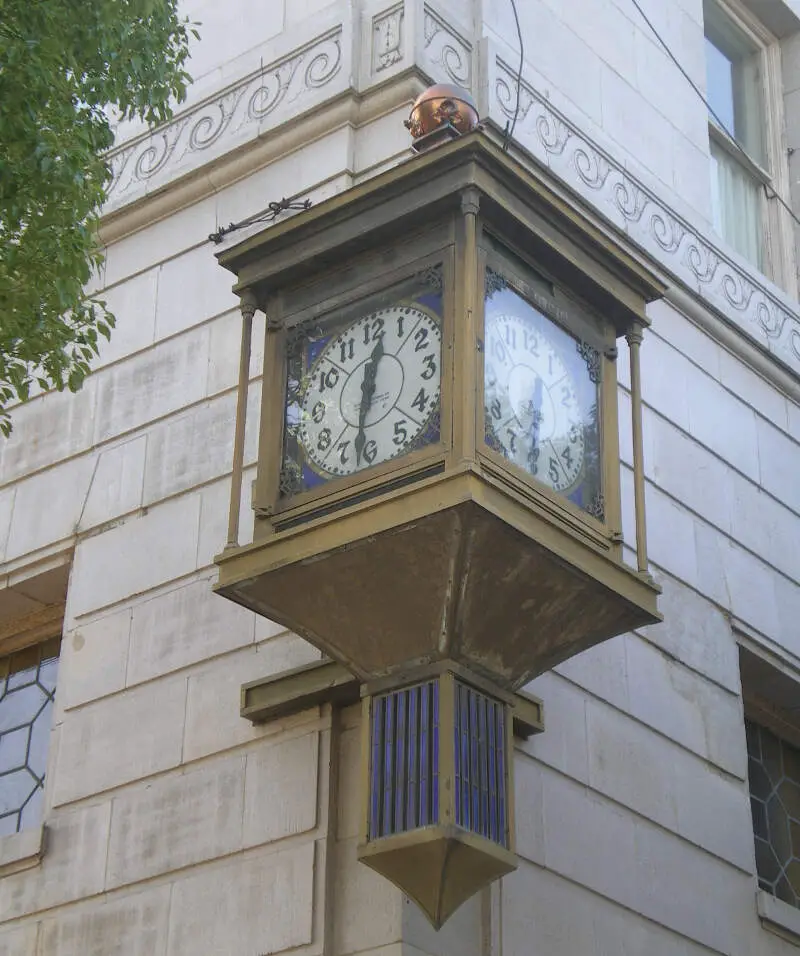
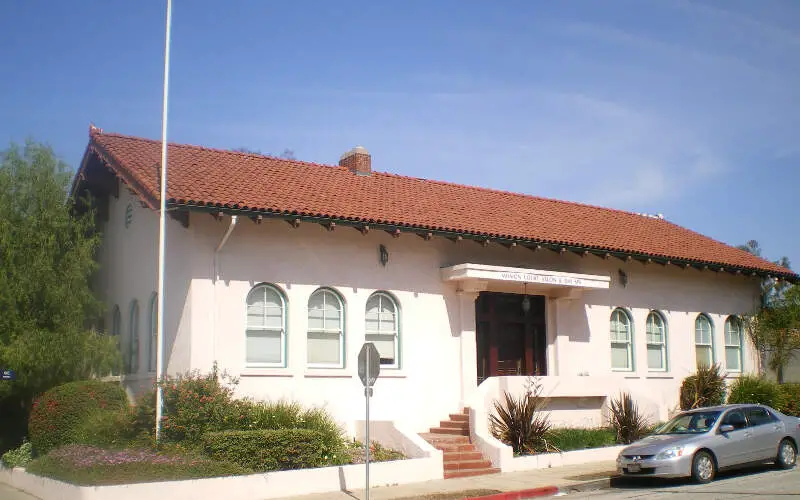
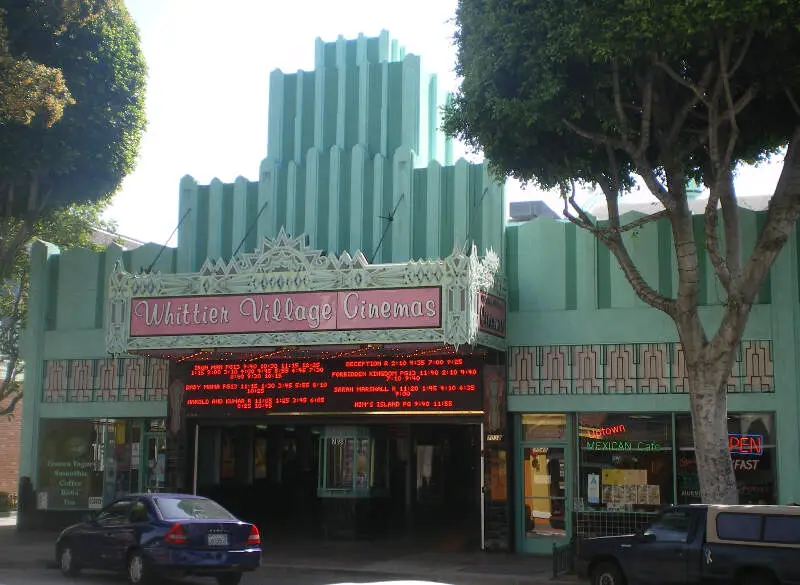
Whittier, CA Photos
1 Reviews & Comments About Whittier
/5

HomeSnacks User - 2018-07-15 15:22:13.619814
I've learned that Whittier offers some terrific public schools with Leffingwell Elementary being its gold standard as it recently became a Blue Ribbon school.
The homelessness has become a problem in Whittier as homeless camps from East LA have seeped into our community. However, the small-town feel of the community with generous residents outweighs the negatives.
Rankings for Whittier in California


Locations Around Whittier
Map Of Whittier, CA
Best Places Around Whittier
La Mirada, CA
Population 46,945
North Tustin, CA
Population 26,038
Vincent, CA
Population 15,151
Lakewood, CA
Population 80,510
Villa Park, CA
Population 5,776
Cypress, CA
Population 49,531
West Puente Valley, CA
Population 22,198
Rossmoor, CA
Population 11,895
Citrus, CA
Population 10,813
South Monrovia Island, CA
Population 7,072
Whittier Demographics And Statistics
Population over time in Whittier
The current population in Whittier is 85,925. The population has increased 1.1% from 2010.
| Year | Population | % Change |
|---|---|---|
| 2023 | 85,925 | -0.6% |
| 2022 | 86,459 | -0.8% |
| 2021 | 87,184 | 2.8% |
| 2020 | 84,821 | -1.5% |
| 2019 | 86,090 | -0.5% |
| 2018 | 86,523 | -0.4% |
| 2017 | 86,852 | 0.3% |
| 2016 | 86,630 | -0.1% |
| 2015 | 86,688 | 0.3% |
| 2014 | 86,400 | 0.7% |
| 2013 | 85,832 | 0.5% |
| 2012 | 85,423 | 0.3% |
| 2011 | 85,161 | 0.2% |
| 2010 | 84,997 | - |
Race / Ethnicity in Whittier
Whittier is:
23.1% White with 19,871 White residents.
1.0% African American with 873 African American residents.
0.3% American Indian with 255 American Indian residents.
4.8% Asian with 4,090 Asian residents.
0.0% Hawaiian with 26 Hawaiian residents.
2.2% Other with 1,871 Other residents.
1.9% Two Or More with 1,630 Two Or More residents.
66.7% Hispanic with 57,309 Hispanic residents.
| Race | Whittier | CA | USA |
|---|---|---|---|
| White | 23.1% | 34.6% | 58.2% |
| African American | 1.0% | 5.3% | 12.0% |
| American Indian | 0.3% | 0.3% | 0.5% |
| Asian | 4.8% | 15.1% | 5.7% |
| Hawaiian | 0.0% | 0.3% | 0.2% |
| Other | 2.2% | 0.5% | 0.5% |
| Two Or More | 1.9% | 4.1% | 3.9% |
| Hispanic | 66.7% | 39.8% | 19.0% |
Gender in Whittier
Whittier is 51.7% female with 44,402 female residents.
Whittier is 48.3% male with 41,522 male residents.
| Gender | Whittier | CA | USA |
|---|---|---|---|
| Female | 51.7% | 50.0% | 50.5% |
| Male | 48.3% | 50.0% | 49.5% |
Highest level of educational attainment in Whittier for adults over 25
6.0% of adults in Whittier completed < 9th grade.
6.0% of adults in Whittier completed 9-12th grade.
28.0% of adults in Whittier completed high school / ged.
22.0% of adults in Whittier completed some college.
10.0% of adults in Whittier completed associate's degree.
18.0% of adults in Whittier completed bachelor's degree.
8.0% of adults in Whittier completed master's degree.
1.0% of adults in Whittier completed professional degree.
1.0% of adults in Whittier completed doctorate degree.
| Education | Whittier | CA | USA |
|---|---|---|---|
| < 9th Grade | 6.0% | 8.0% | 5.0% |
| 9-12th Grade | 6.0% | 7.0% | 6.0% |
| High School / GED | 28.0% | 20.0% | 26.0% |
| Some College | 22.0% | 20.0% | 19.0% |
| Associate's Degree | 10.0% | 8.0% | 9.0% |
| Bachelor's Degree | 18.0% | 22.0% | 21.0% |
| Master's Degree | 8.0% | 10.0% | 10.0% |
| Professional Degree | 1.0% | 3.0% | 2.0% |
| Doctorate Degree | 1.0% | 2.0% | 2.0% |
Household Income For Whittier, California
4.0% of households in Whittier earn Less than $10,000.
1.9% of households in Whittier earn $10,000 to $14,999.
6.1% of households in Whittier earn $15,000 to $24,999.
4.6% of households in Whittier earn $25,000 to $34,999.
8.0% of households in Whittier earn $35,000 to $49,999.
16.1% of households in Whittier earn $50,000 to $74,999.
12.9% of households in Whittier earn $75,000 to $99,999.
18.9% of households in Whittier earn $100,000 to $149,999.
12.4% of households in Whittier earn $150,000 to $199,999.
15.2% of households in Whittier earn $200,000 or more.
| Income | Whittier | CA | USA |
|---|---|---|---|
| Less than $10,000 | 4.0% | 4.4% | 4.9% |
| $10,000 to $14,999 | 1.9% | 3.0% | 3.6% |
| $15,000 to $24,999 | 6.1% | 5.2% | 6.6% |
| $25,000 to $34,999 | 4.6% | 5.5% | 6.8% |
| $35,000 to $49,999 | 8.0% | 8.4% | 10.4% |
| $50,000 to $74,999 | 16.1% | 13.3% | 15.7% |
| $75,000 to $99,999 | 12.9% | 11.8% | 12.7% |
| $100,000 to $149,999 | 18.9% | 17.9% | 17.4% |
| $150,000 to $199,999 | 12.4% | 11.1% | 9.3% |
| $200,000 or more | 15.2% | 19.4% | 12.6% |


