Woodland, CA
Demographics And Statistics
Living In Woodland, California Summary
Life in Woodland research summary. HomeSnacks has been using Saturday Night Science to research the quality of life in Woodland over the past nine years using Census, FBI, Zillow, and other primary data sources. Based on the most recently available data, we found the following about life in Woodland:
The population in Woodland is 61,256.
The median home value in Woodland is $546,899.
The median income in Woodland is $87,880.
The cost of living in Woodland is 133 which is 1.3x higher than the national average.
The median rent in Woodland is $1,500.
The unemployment rate in Woodland is 5.3%.
The poverty rate in Woodland is 8.1%.
The average high in Woodland is 74.6° and the average low is 48.5°.
Woodland SnackAbility
Overall SnackAbility
Woodland, CA Crime Report
Crime in Woodland summary. We use data from the FBI to determine the crime rates in Woodland. Key points include:
There were 1,036 total crimes in Woodland in the last reporting year.
The overall crime rate per 100,000 people in Woodland is 1,693.4 / 100k people.
The violent crime rate per 100,000 people in Woodland is 274.6 / 100k people.
The property crime rate per 100,000 people in Woodland is 1,418.8 / 100k people.
Overall, crime in Woodland is -20.09% below the national average.
Total Crimes
Below National Average
Crime In Woodland Comparison Table
| Statistic | Count Raw |
Woodland / 100k People |
California / 100k People |
National / 100k People |
|---|---|---|---|---|
| Total Crimes Per 100K | 1,036 | 1,693.4 | 2,564.5 | 2,119.2 |
| Violent Crime | 168 | 274.6 | 486.0 | 359.0 |
| Murder | 5 | 8.2 | 4.5 | 5.0 |
| Robbery | 37 | 60.5 | 119.1 | 61.0 |
| Aggravated Assault | 111 | 181.4 | 325.8 | 256.0 |
| Property Crime | 868 | 1,418.8 | 2,078.4 | 1,760.0 |
| Burglary | 72 | 117.7 | 305.8 | 229.0 |
| Larceny | 643 | 1,051.0 | 1,345.2 | 1,272.0 |
| Car Theft | 153 | 250.1 | 427.5 | 259.0 |
Woodland, CA Cost Of Living
Cost of living in Woodland summary. We use data on the cost of living to determine how expensive it is to live in Woodland. Real estate prices drive most of the variance in cost of living around California. Key points include:
The cost of living in Woodland is 133 with 100 being average.
The cost of living in Woodland is 1.3x higher than the national average.
The median home value in Woodland is $546,899.
The median income in Woodland is $87,880.
Woodland's Overall Cost Of Living
Higher Than The National Average
Cost Of Living In Woodland Comparison Table
| Living Expense | Woodland | California | National Average | |
|---|---|---|---|---|
| Overall | 133 | 141 | 100 | |
| Services | 107 | 110 | 100 | |
| Groceries | 109 | 112 | 100 | |
| Health | 114 | 110 | 100 | |
| Housing | 182 | 195 | 100 | |
| Transportation | 122 | 125 | 100 | |
| Utilities | 112 | 128 | 100 | |
Woodland, CA Weather
The average high in Woodland is 74.6° and the average low is 48.5°.
There are 44.1 days of precipitation each year.
Expect an average of 21.3 inches of precipitation each year with 0.0 inches of snow.
| Stat | Woodland |
|---|---|
| Average Annual High | 74.6 |
| Average Annual Low | 48.5 |
| Annual Precipitation Days | 44.1 |
| Average Annual Precipitation | 21.3 |
| Average Annual Snowfall | 0.0 |
Average High
Days of Rain
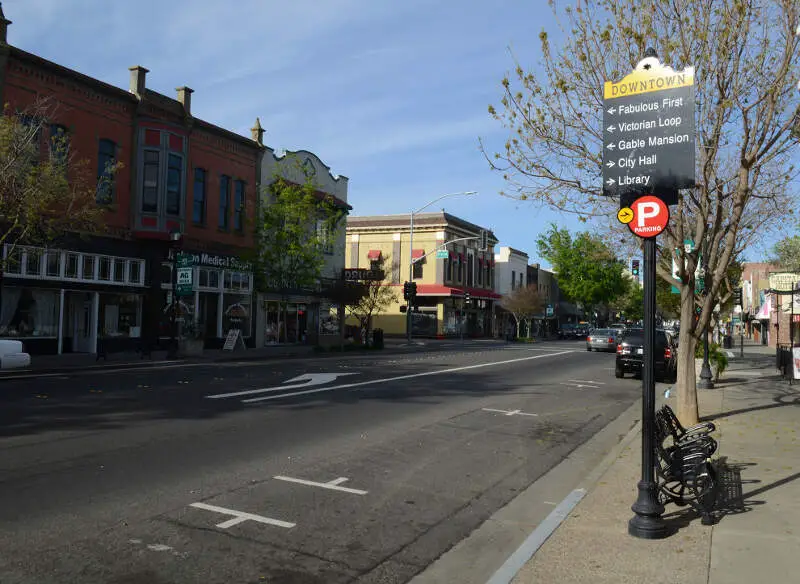
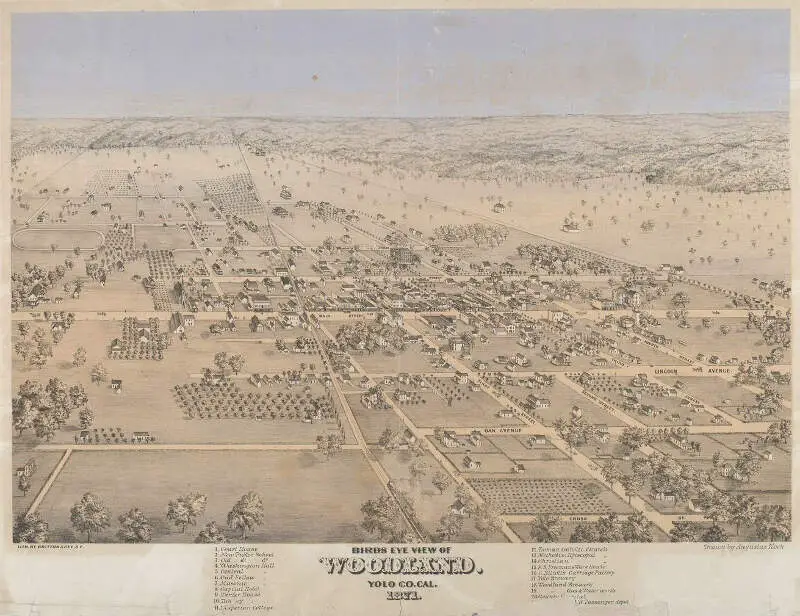
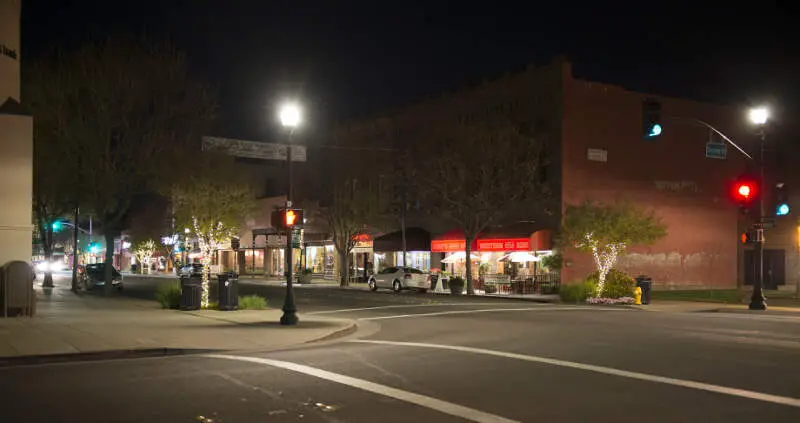
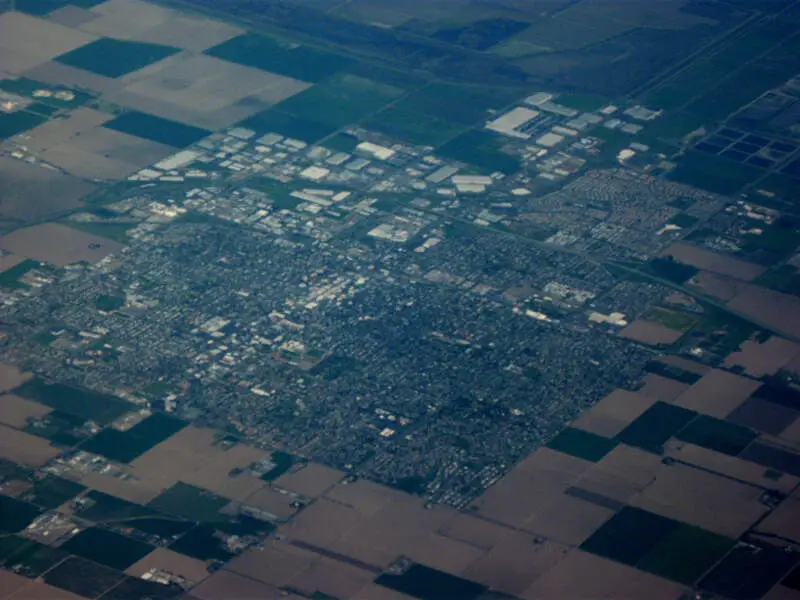
Woodland, CA Photos

Rankings for Woodland in California


Locations Around Woodland
Map Of Woodland, CA
Best Places Around Woodland
Davis, CA
Population 66,801
Winters, CA
Population 7,453
Dixon, CA
Population 19,158
Elverta, CA
Population 4,252
Rio Linda, CA
Population 16,951
Sacramento, CA
Population 524,802
West Sacramento, CA
Population 54,496
Parkway, CA
Population 15,880
Lemon Hill, CA
Population 14,942
Woodland Demographics And Statistics
Population over time in Woodland
The current population in Woodland is 61,256. The population has increased 11.8% from 2010.
| Year | Population | % Change |
|---|---|---|
| 2023 | 61,256 | 0.0% |
| 2022 | 61,227 | 0.4% |
| 2021 | 60,977 | 2.0% |
| 2020 | 59,759 | 0.1% |
| 2019 | 59,710 | 1.1% |
| 2018 | 59,044 | 1.2% |
| 2017 | 58,324 | 1.3% |
| 2016 | 57,552 | 1.0% |
| 2015 | 56,997 | 1.1% |
| 2014 | 56,390 | 0.9% |
| 2013 | 55,888 | 0.5% |
| 2012 | 55,585 | 0.6% |
| 2011 | 55,229 | 0.8% |
| 2010 | 54,785 | - |
Race / Ethnicity in Woodland
Woodland is:
34.8% White with 21,339 White residents.
1.7% African American with 1,064 African American residents.
0.5% American Indian with 314 American Indian residents.
7.9% Asian with 4,866 Asian residents.
0.6% Hawaiian with 361 Hawaiian residents.
0.3% Other with 178 Other residents.
4.4% Two Or More with 2,668 Two Or More residents.
49.7% Hispanic with 30,466 Hispanic residents.
| Race | Woodland | CA | USA |
|---|---|---|---|
| White | 34.8% | 34.6% | 58.2% |
| African American | 1.7% | 5.3% | 12.0% |
| American Indian | 0.5% | 0.3% | 0.5% |
| Asian | 7.9% | 15.1% | 5.7% |
| Hawaiian | 0.6% | 0.3% | 0.2% |
| Other | 0.3% | 0.5% | 0.5% |
| Two Or More | 4.4% | 4.1% | 3.9% |
| Hispanic | 49.7% | 39.8% | 19.0% |
Gender in Woodland
Woodland is 50.0% female with 30,614 female residents.
Woodland is 50.0% male with 30,641 male residents.
| Gender | Woodland | CA | USA |
|---|---|---|---|
| Female | 50.0% | 50.0% | 50.5% |
| Male | 50.0% | 50.0% | 49.5% |
Highest level of educational attainment in Woodland for adults over 25
10.0% of adults in Woodland completed < 9th grade.
6.0% of adults in Woodland completed 9-12th grade.
23.0% of adults in Woodland completed high school / ged.
23.0% of adults in Woodland completed some college.
8.0% of adults in Woodland completed associate's degree.
18.0% of adults in Woodland completed bachelor's degree.
7.0% of adults in Woodland completed master's degree.
2.0% of adults in Woodland completed professional degree.
3.0% of adults in Woodland completed doctorate degree.
| Education | Woodland | CA | USA |
|---|---|---|---|
| < 9th Grade | 10.0% | 8.0% | 5.0% |
| 9-12th Grade | 6.0% | 7.0% | 6.0% |
| High School / GED | 23.0% | 20.0% | 26.0% |
| Some College | 23.0% | 20.0% | 19.0% |
| Associate's Degree | 8.0% | 8.0% | 9.0% |
| Bachelor's Degree | 18.0% | 22.0% | 21.0% |
| Master's Degree | 7.0% | 10.0% | 10.0% |
| Professional Degree | 2.0% | 3.0% | 2.0% |
| Doctorate Degree | 3.0% | 2.0% | 2.0% |
Household Income For Woodland, California
3.4% of households in Woodland earn Less than $10,000.
1.9% of households in Woodland earn $10,000 to $14,999.
5.8% of households in Woodland earn $15,000 to $24,999.
6.2% of households in Woodland earn $25,000 to $34,999.
8.7% of households in Woodland earn $35,000 to $49,999.
16.1% of households in Woodland earn $50,000 to $74,999.
13.3% of households in Woodland earn $75,000 to $99,999.
20.8% of households in Woodland earn $100,000 to $149,999.
10.9% of households in Woodland earn $150,000 to $199,999.
12.9% of households in Woodland earn $200,000 or more.
| Income | Woodland | CA | USA |
|---|---|---|---|
| Less than $10,000 | 3.4% | 4.4% | 4.9% |
| $10,000 to $14,999 | 1.9% | 3.0% | 3.6% |
| $15,000 to $24,999 | 5.8% | 5.2% | 6.6% |
| $25,000 to $34,999 | 6.2% | 5.5% | 6.8% |
| $35,000 to $49,999 | 8.7% | 8.4% | 10.4% |
| $50,000 to $74,999 | 16.1% | 13.3% | 15.7% |
| $75,000 to $99,999 | 13.3% | 11.8% | 12.7% |
| $100,000 to $149,999 | 20.8% | 17.9% | 17.4% |
| $150,000 to $199,999 | 10.9% | 11.1% | 9.3% |
| $200,000 or more | 12.9% | 19.4% | 12.6% |


