Everyone wants a bit of a blissful breeze or a scoop of sunny sanctuary when looking for a place to live in Virginia.
The more sun, the more you can go outside. The more you go outside, the more you’ll feel at peace. The more you’ll feel at peace, the more you’ll enjoy where you live.
So it makes sense to try and find the places with the best weather in Virginia. We used Saturday Night Science to compare the number of sunny days, total precipitation, and the deviation from the ideal 70-degree weather for 117 places in Virginia over 10,000 people.
Grab your shades and put away your raincoat as we look at the cities with the best weather in Virginia.
294.9 sunny days · 67.2 degree average high
Fort Hunt is a census-designated place in Fairfax County, Virginia, United States. It is most famous for being the site of former P.O. Box 1142, a military interrogation center during World War II. It is also notable for its high population of senior citizens and for being one of the first suburbs in wealthy Fairfax County. The population was 16,045 at the 2010 census.
294.9 sunny days · 67.0 degree average high
294.9 sunny days · 66.9 degree average high
Hybla Valley is a census-designated place in Fairfax County, Virginia, United States, south of Alexandria. The population was 15,801 at the 2010 census, down from 16,721 in 2000 due to a reduction in area, resulting from some of the eastward neighborhoods including much of Hollin Hills being moved to the Fort Hunt CDP.
293.5 sunny days · 66.9 degree average high
292.5 sunny days · 70.2 degree average high
Hopewell is an independent city within Prince George County in the Commonwealth of Virginia. As of the 2010 census, the population was 22,591. The Bureau of Economic Analysis combines the city of Hopewell with Prince George County for statistical purposes.
Data | Crime | Cost of living | Movers
292.9 sunny days · 68.2 degree average high
Poquoson is an independent city in the Commonwealth of Virginia. As of the 2010 census, the population was 12,150. The Bureau of Economic Analysis combines the city of Poquoson with surrounding York County for statistical purposes.
Data | Crime | Cost of living | Movers
294.9 sunny days · 66.6 degree average high
292.5 sunny days · 68.1 degree average high
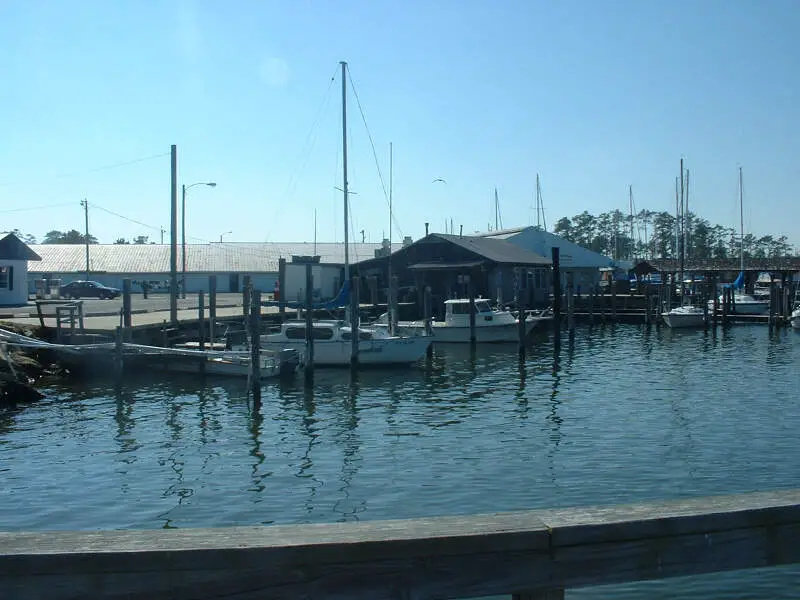
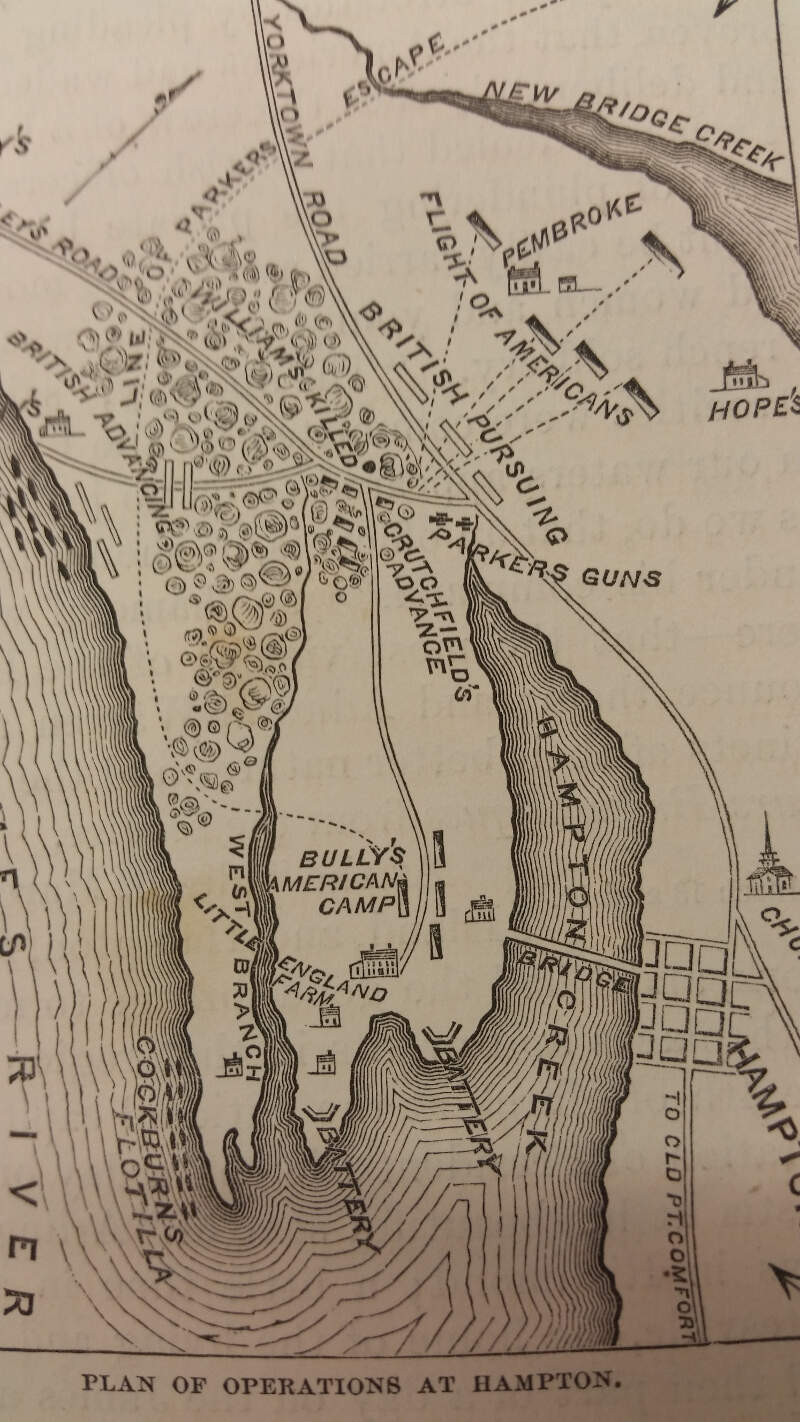
Hampton is an independent city in the Commonwealth of Virginia, United States of America. As of the 2010 census, the population was 137,436.
Data | Crime | Cost of living | Movers
293.5 sunny days · 66.6 degree average high
292.7 sunny days · 66.8 degree average high
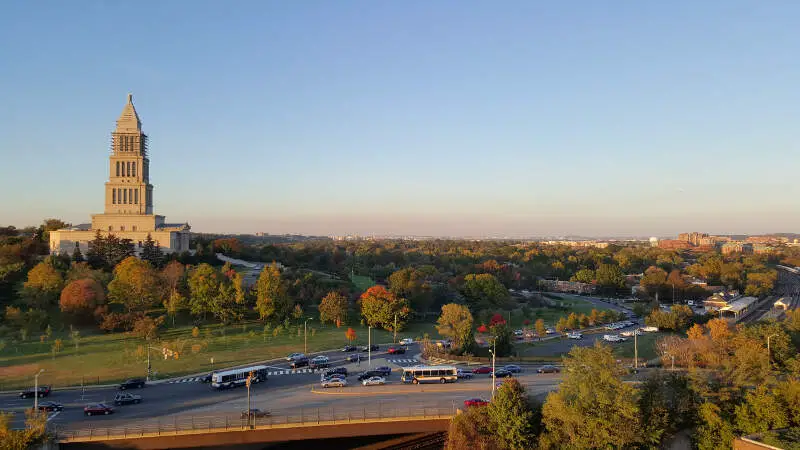
Alexandria is an independent city in the Commonwealth of Virginia in the United States. As of the 2010 census, the population was 139,966, and in 2016, the population was estimated to be 155,810. Located along the western bank of the Potomac River, Alexandria is approximately 7 miles south of downtown Washington, D.C.
Data | Crime | Cost of living | Movers
The receipts
Compare the top ten
Pick a metric. The bars rescale. The red line is Virginia’s statewide median.
On the map
Where Virginia’s best weather is
Saturday Night Science
How We Determined The Cities In Virginia With The Best Weather
To rank the most fair weather cities in Virginia, we used Saturday Night Science and the National Oceanic and Atmospheric Administration (NOAA) database, to see which cities in the Old Dominion get the best weather.
We used the following criteria to find the best weather:
- Number of sunny days
- Highest average low
- Average high deviation from 70 degrees
- Least amount of rain
- Least amount of snow
We ranked each city of over 10,000 people in Virginia from best to worst on each criterion. We then averaged each ranking into a weather quality index. The city with the best index, Fort Hunt, was anointed the city with the best weather in Virginia.
Before we get too far, here are the annual precipitation rates for major cities: Virginia Beach (44.8 inches), Norfolk (46.3 inches), and Chesapeake (47.3 inches).
The cities with the best weather in Virginia are Fort Hunt, Huntington, Hybla Valley, Marumsco, Hopewell, Poquoson, Rose Hill CDP (Fairfax County), Hampton, Newington Forest, and Alexandria.
There’s a complete chart at the bottom.
The full plate
Detailed List Of Places With The Best Weather In Virginia
Click any column to sort. Search by city name.
| Rank | City | Population | Sunny Days | Avg. High | Precipitation (Inches) | Snow (Inches) |
|---|---|---|---|---|---|---|
| 1 | Fort Hunt | 17,273 | 294.9 | 67.2 | 41.6 | 14.3 |
| 2 | Huntington | 12,718 | 294.9 | 67.0 | 41.6 | 15.2 |
| 3 | Hybla Valley | 16,106 | 294.9 | 66.9 | 41.5 | 15.4 |
| 4 | Marumsco | 38,847 | 293.5 | 66.9 | 41.4 | 14.3 |
| 5 | Hopewell | 22,279 | 292.5 | 70.2 | 46.3 | 4.8 |
| 6 | Poquoson | 12,077 | 292.9 | 68.2 | 46.7 | 4.2 |
| 7 | Rose Hill CDP (Fairfax County) | 20,142 | 294.9 | 66.6 | 41.7 | 15.8 |
| 8 | Hampton | 137,081 | 292.5 | 68.1 | 46.8 | 4.7 |
| 9 | Newington Forest | 12,280 | 293.5 | 66.6 | 41.4 | 16.5 |
| 10 | Alexandria | 149,315 | 292.7 | 66.8 | 42.0 | 15.3 |
| 11 | Montclair | 19,896 | 293.5 | 66.7 | 41.5 | 13.8 |
| 12 | Newport News | 181,323 | 290.8 | 68.9 | 47.4 | 4.6 |
| 13 | Portsmouth | 96,135 | 290.3 | 69.7 | 47.0 | 4.7 |
| 14 | Petersburg | 32,123 | 290.8 | 69.7 | 46.2 | 6.2 |
| 15 | Chesapeake | 230,601 | 290.3 | 69.9 | 47.3 | 5.2 |
| 16 | Lincolnia | 23,802 | 294.9 | 66.6 | 42.2 | 16.2 |
| 17 | Colonial Heights | 17,515 | 290.8 | 70.1 | 46.2 | 6.4 |
| 18 | Richmond | 213,735 | 291.3 | 69.0 | 44.2 | 11.6 |
| 19 | East Highland Park | 14,733 | 291.3 | 68.9 | 44.0 | 12.0 |
| 20 | Lakeside | 13,039 | 291.3 | 68.9 | 44.0 | 12.0 |
| 21 | Norfolk | 245,452 | 290.1 | 68.9 | 46.3 | 4.8 |
| 22 | Lake Ridge | 43,963 | 293.5 | 66.4 | 41.5 | 16.8 |
| 23 | Cherry Hill | 18,089 | 288.0 | 66.9 | 41.2 | 12.8 |
| 24 | Arlington | 223,945 | 291.8 | 66.5 | 42.8 | 15.5 |
| 25 | Lorton | 19,722 | 288.0 | 66.9 | 41.2 | 15.8 |
| 26 | Laurel | 16,618 | 291.8 | 68.7 | 43.9 | 12.9 |
| 27 | Suffolk | 86,184 | 288.3 | 70.0 | 48.5 | 4.7 |
| 28 | Danville | 42,450 | 289.7 | 69.8 | 44.3 | 5.0 |
| 29 | Wyndham | 10,040 | 291.8 | 68.8 | 43.6 | 14.1 |
| 30 | Virginia Beach | 448,290 | 289.8 | 68.5 | 44.8 | 6.1 |
| 31 | Tuckahoe | 47,316 | 291.6 | 68.9 | 43.9 | 12.2 |
| 32 | Timberlake | 12,440 | 293.8 | 67.2 | 42.0 | 11.2 |
| 33 | Williamsburg | 14,754 | 288.7 | 69.8 | 47.6 | 5.7 |
| 34 | Highland Springs | 16,955 | 290.1 | 69.0 | 44.1 | 10.2 |
| 35 | Roanoke | 98,736 | 292.8 | 67.2 | 43.2 | 15.2 |
| 36 | Mechanicsville | 37,210 | 290.0 | 69.0 | 43.9 | 12.6 |
| 37 | Kingstowne | 15,935 | 288.6 | 66.7 | 41.5 | 16.1 |
| 38 | Chester | 21,927 | 288.7 | 69.5 | 45.5 | 7.0 |
| 39 | Lynchburg | 78,158 | 294.1 | 67.3 | 42.3 | 13.2 |
| 40 | Manchester | 10,378 | 290.3 | 69.1 | 44.7 | 8.7 |
| 41 | Short Pump | 26,902 | 291.4 | 68.7 | 43.8 | 12.5 |
| 42 | Meadowbrook | 19,027 | 288.7 | 69.2 | 44.7 | 7.7 |
| 43 | Burke | 42,205 | 293.5 | 66.1 | 41.4 | 20.0 |
| 44 | Neabsco | 16,073 | 291.0 | 66.6 | 41.5 | 17.1 |
| 45 | Bull Run | 14,781 | 291.0 | 66.6 | 41.5 | 17.1 |
| 46 | Fredericksburg | 27,395 | 288.6 | 67.8 | 41.7 | 12.9 |
| 47 | Salem | 25,165 | 287.4 | 67.2 | 41.1 | 15.6 |
| 48 | Falls Church | 13,308 | 294.9 | 66.0 | 43.0 | 17.3 |
| 49 | Brandermill | 13,721 | 288.7 | 69.1 | 44.4 | 8.7 |
| 50 | Springfield | 30,444 | 288.0 | 66.5 | 41.7 | 16.6 |
| 51 | Linton Hall | 40,567 | 291.5 | 66.7 | 41.7 | 19.8 |
| 52 | Bon Air | 17,128 | 288.7 | 68.7 | 44.2 | 11.1 |
| 53 | Buckhall | 17,066 | 291.5 | 66.1 | 41.7 | 17.2 |
| 54 | Bailey’s Crossroads | 26,075 | 288.0 | 66.4 | 42.7 | 16.0 |
| 55 | Forest | 10,292 | 289.3 | 67.0 | 42.4 | 13.3 |
| 56 | Leesburg | 47,872 | 290.9 | 66.3 | 40.8 | 21.1 |
| 57 | Dale City | 72,130 | 288.0 | 66.4 | 41.6 | 16.0 |
| 58 | Kings Park West | 13,702 | 291.6 | 65.8 | 41.4 | 21.3 |
| 59 | Gainesville | 12,950 | 292.4 | 66.3 | 41.8 | 19.9 |
| 60 | Franklin Farm | 19,776 | 290.3 | 66.1 | 42.0 | 18.9 |
| 61 | Franconia | 19,698 | 290.3 | 66.1 | 42.0 | 18.9 |
| 62 | Burke Centre | 17,982 | 290.3 | 66.1 | 42.0 | 18.9 |
| 63 | Groveton | 16,373 | 290.3 | 66.1 | 42.0 | 18.9 |
| 64 | Newington | 13,470 | 290.3 | 66.1 | 42.0 | 18.9 |
| 65 | Wakefield | 13,082 | 290.3 | 66.1 | 42.0 | 18.9 |
| 66 | Mount Vernon | 12,639 | 290.3 | 66.1 | 42.0 | 18.9 |
| 67 | Dranesville | 11,895 | 290.3 | 66.1 | 42.0 | 18.9 |
| 68 | Fairfax Station | 11,290 | 290.3 | 66.1 | 42.0 | 18.9 |
| 69 | George Mason | 10,065 | 290.3 | 66.1 | 42.0 | 18.9 |
| 70 | West Springfield | 22,897 | 288.0 | 66.3 | 41.6 | 19.6 |
| 71 | Glen Allen | 15,007 | 287.2 | 68.5 | 43.7 | 14.0 |
| 72 | Centreville | 73,660 | 290.4 | 66.4 | 41.4 | 21.5 |
| 73 | Sudley | 17,009 | 291.6 | 66.5 | 41.7 | 21.6 |
| 74 | Hollins | 14,654 | 284.0 | 67.1 | 42.9 | 13.6 |
| 75 | Madison Heights | 10,355 | 289.6 | 67.2 | 42.8 | 13.3 |
| 76 | Annandale | 42,893 | 288.0 | 66.2 | 42.3 | 17.6 |
| 77 | Martinsville | 13,624 | 280.7 | 68.5 | 44.9 | 6.6 |
| 78 | Charlottesville | 45,084 | 290.1 | 67.6 | 44.7 | 15.4 |
| 79 | Manassas | 40,743 | 291.6 | 66.3 | 41.7 | 21.5 |
| 80 | Front Royal | 14,846 | 292.6 | 65.9 | 39.3 | 22.8 |
| 81 | McLean | 47,784 | 288.0 | 66.2 | 43.3 | 18.4 |
| 82 | Waynesboro | 21,150 | 291.6 | 65.5 | 41.5 | 18.8 |
| 83 | Chantilly | 23,864 | 291.6 | 66.0 | 41.7 | 21.6 |
| 84 | Great Falls | 15,764 | 291.6 | 65.6 | 41.9 | 21.4 |
| 85 | Brambleton | 15,537 | 291.1 | 65.9 | 41.3 | 21.0 |
| 86 | Sugarland Run | 12,527 | 291.1 | 65.9 | 41.3 | 21.0 |
| 87 | Lansdowne | 11,707 | 291.1 | 65.9 | 41.3 | 21.0 |
| 88 | Lowes Island | 11,396 | 291.1 | 65.9 | 41.3 | 21.0 |
| 89 | Countryside | 10,301 | 291.1 | 65.9 | 41.3 | 21.0 |
| 90 | Bristol | 17,524 | 268.9 | 67.3 | 42.9 | 12.1 |
| 91 | Manassas Park | 15,625 | 290.3 | 66.4 | 41.6 | 21.5 |
| 92 | Radford | 17,057 | 293.6 | 64.7 | 37.0 | 23.6 |
| 93 | Cave Spring | 25,554 | 287.4 | 66.7 | 43.6 | 15.5 |
| 94 | Winchester | 27,168 | 292.6 | 64.6 | 38.4 | 22.2 |
| 95 | West Falls Church | 29,489 | 288.0 | 66.0 | 42.8 | 17.6 |
| 96 | South Riding | 27,441 | 291.5 | 66.1 | 41.9 | 21.7 |
| 97 | Culpeper | 17,167 | 290.5 | 67.4 | 44.1 | 19.6 |
| 98 | Broadlands | 13,436 | 291.6 | 66.0 | 42.1 | 21.5 |
| 99 | Cascades | 12,194 | 290.3 | 66.3 | 41.8 | 21.5 |
| 100 | Herndon | 24,384 | 291.6 | 65.7 | 42.2 | 21.5 |
Source: NOAA climate data. 117 Virginia cities with more than 10,000 residents.
Summary
Summary: The Cities With The Best Weather In Virginia For 2026
If you’re looking for the Virginia cities with the most sunny days, the least rain and snow, and highs closest to a perfect 70 degrees, this is an accurate list.
The cities with the best weather in Virginia are Fort Hunt, Huntington, Hybla Valley, Marumsco, Hopewell, Poquoson, Rose Hill CDP (Fairfax County), Hampton, Newington Forest, and Alexandria.