Danville SnackAbility
Overall SnackAbility
Crime in Danville summary. We use data from the FBI to determine the crime rates in Danville. Key points include:
There were 1,341 total crimes in Danville in the last reporting year.
The overall crime rate per 100,000 people in Danville is 3,199.3 / 100k people.
The violent crime rate per 100,000 people in Danville is 365.0 / 100k people.
The property crime rate per 100,000 people in Danville is 2,834.3 / 100k people.
Overall, crime in Danville is 50.97% above the national average.
Total Crimes
Above National Average
Crime In Danville Comparison Table
| Statistic | Count Raw |
Danville / 100k People |
Virginia / 100k People |
National / 100k People |
|---|---|---|---|---|
| Total Crimes Per 100K | 1,341 | 3,199.3 | 1,787.6 | 2,119.2 |
| Violent Crime | 153 | 365.0 | 217.9 | 359.0 |
| Murder | 9 | 21.5 | 4.8 | 5.0 |
| Robbery | 22 | 52.5 | 33.1 | 61.0 |
| Aggravated Assault | 107 | 255.3 | 152.2 | 256.0 |
| Property Crime | 1,188 | 2,834.3 | 1,569.7 | 1,760.0 |
| Burglary | 92 | 219.5 | 108.7 | 229.0 |
| Larceny | 1,030 | 2,457.4 | 1,315.9 | 1,272.0 |
| Car Theft | 66 | 157.5 | 145.1 | 259.0 |
Source: FBI Uniform Crime Reporting (2024)
Cost of living in Danville summary. We use data on the cost of living to determine how expensive it is to live in Danville. Real estate prices drive most of the variance in cost of living around Virginia. Key points include:
The cost of living in Danville is 88 with 100 being average.
The cost of living in Danville is 0.9x lower than the national average.
The median home value in Danville is $156,398.
The median income in Danville is $44,423.
Danville's Overall Cost Of Living
Lower Than The National Average
Cost Of Living In Danville Comparison Table
| Living Expense | Danville | Virginia | National Average |
|---|---|---|---|
| Overall | 88 | 112 | 100 |
| Services | 104 | 103 | 100 |
| Groceries | 103 | 104 | 100 |
| Health | 59 | 131 | 100 |
| Housing | 104 | 105 | 100 |
| Transportation | 104 | 105 | 100 |
| Utilities | 102 | 104 | 100 |
Source: Cost of living index, normalized to US average = 100
Danville, VA Weather
The average high in Danville is 69.8° and the average low is 46.2°.
There are 75.3 days of precipitation each year.
Expect an average of 44.3 inches of precipitation each year with 5.0 inches of snow.
| Stat | Danville |
|---|---|
| Average Annual High | 69.8 |
| Average Annual Low | 46.2 |
| Annual Precipitation Days | 75.3 |
| Average Annual Precipitation | 44.3 |
| Average Annual Snowfall | 5.0 |
Average High
Days of Rain
Source: NOAA climate normals (30-year)
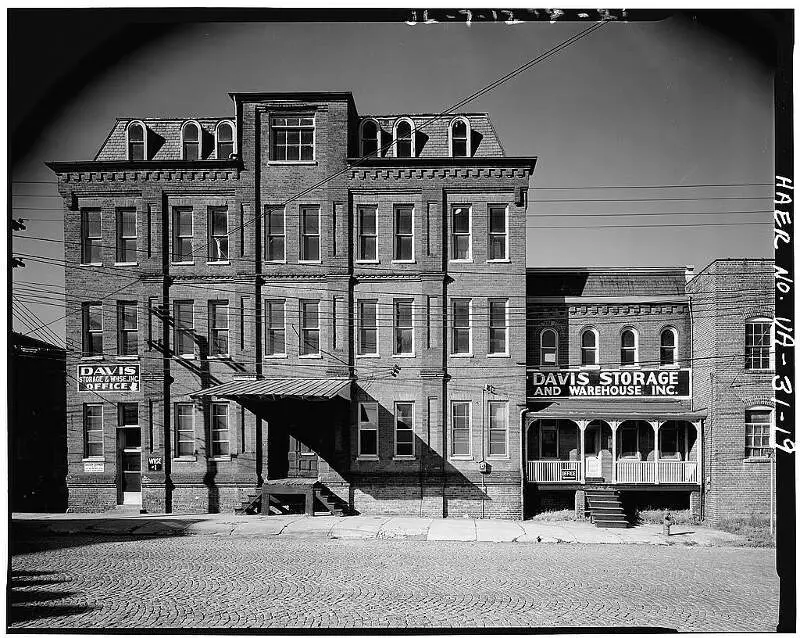
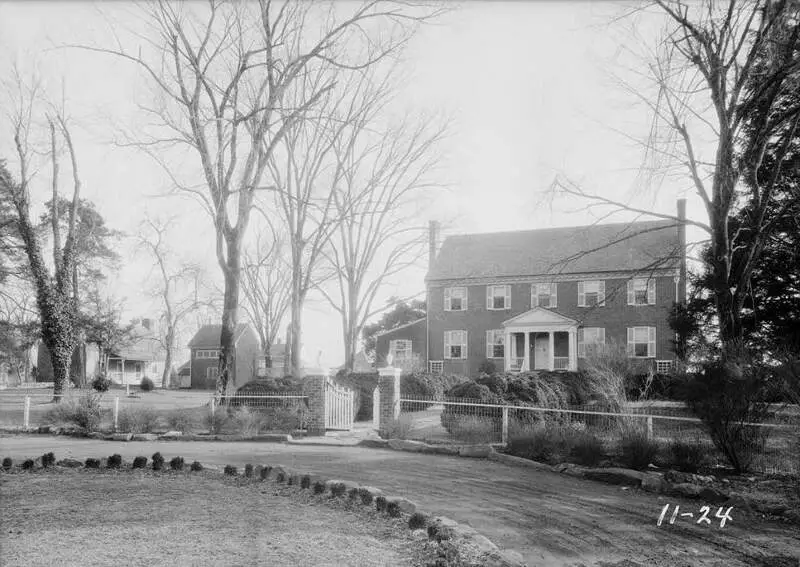
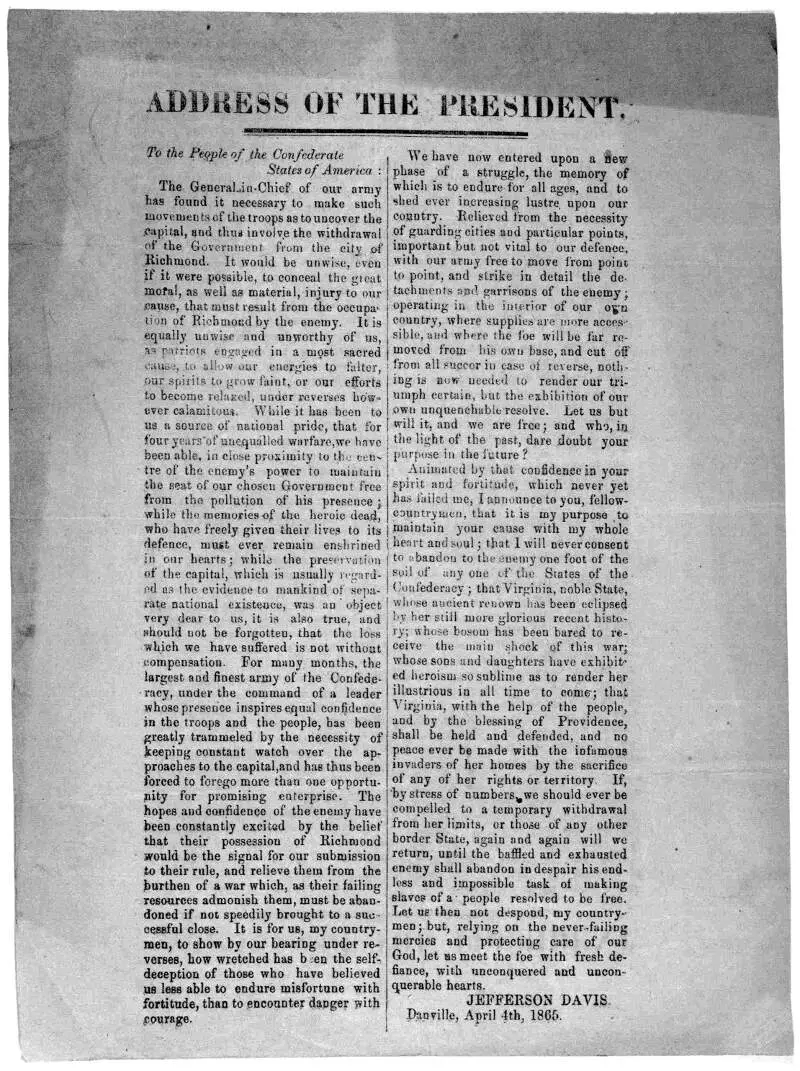
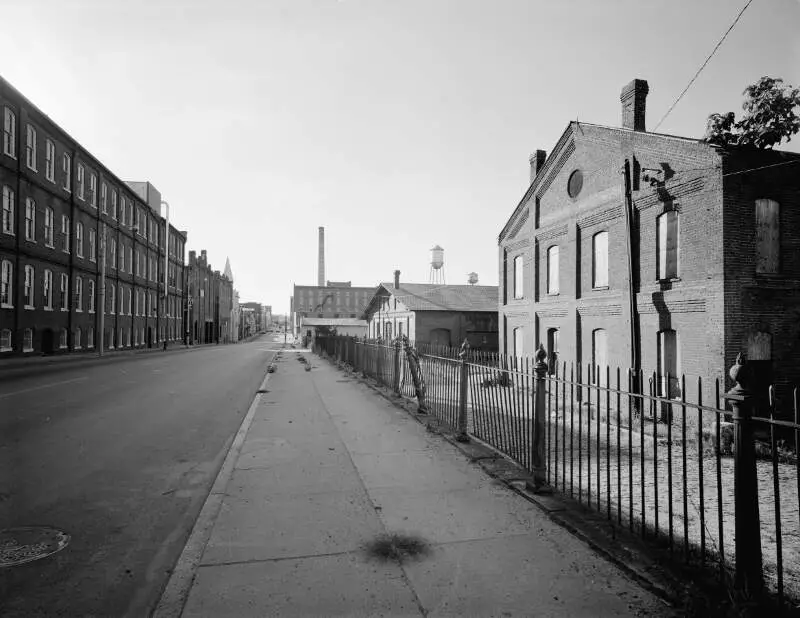
Danville, VA Photos


7 Reviews & Comments About Danville

I'm from Danville, yes we have our moments just like any other place. What is said about Danville is so disrespectful.
I live in danville....it is not that d**n bad-- we just got a few fools down here like everywhere else.
bruh I live in danville va !,and I have 2 pits !
I live in Danville it's really not as bad as he says.
The only nice thing I can say about danville is that the cost of living is fairly low since it's not a major city like Richmond. Besides that, I would strongly discourage moving to danville. It's not as worse as Hurt or Gretna. I can only recommend danville if you want to retire or raise a family. Don't expect to find opportunity there.
Such a shame about Danville. I lived there in the 1960s, it wasn't scary then at all.
The mills shut down, the town is slowly dying.
I have lived in Danville, VA my entire 33+ years of life. Yes it's home to me, but it's not where I want to spend the rest of my life & this is why. I would not recommend moving here unless you plan on retiring. There are no good paying jobs here unless you happen to get a job at one of the few factory's they have left. All they have are shopping & food places so restaurant, fast food, retail & banks are almost your only job options. When you compare the income of minimum wage to the cost of living & necessities like food & gas, good luck being to make it happily on your own without assistance.
There's nothing to do around here because people don't know how to act. The crime rate, murders, assault, robberies & shootings are horrible. Places have had to move their closing time earlier because of shootings & crime after hours. This is why I am currently looking to relocate away from Danville, VA...
Rankings & Articles For Danville


Locations Around Danville
Map Of Danville, VA
Best Places Around Danville
Chapel Hill, NC
Population 61,607
Carrboro, NC
Population 21,204
Oak Ridge, NC
Population 7,744
Summerfield, NC
Population 11,116
Hillsborough, NC
Population 9,724
Gibsonville, NC
Population 9,467
Elon, NC
Population 11,032
Stokesdale, NC
Population 6,004
Mebane, NC
Population 19,538
Greensboro, NC
Population 301,198
Danville Demographics And Statistics
Population over time in Danville
The current population in Danville is 42,214. The population has decreased 3.6% from 2010.
| Year | Population | % Change |
|---|---|---|
| 2024 | 42,214 | -0.1% |
| 2023 | 42,239 | -0.6% |
| 2022 | 42,507 | -0.1% |
| 2021 | 42,556 | 4.6% |
| 2020 | 40,668 | -1.0% |
| 2019 | 41,070 | -1.1% |
| 2018 | 41,512 | -1.0% |
| 2017 | 41,911 | -1.1% |
| 2016 | 42,360 | -0.2% |
| 2015 | 42,450 | -0.6% |
| 2014 | 42,704 | -0.7% |
| 2013 | 42,996 | -0.4% |
| 2012 | 43,185 | -0.6% |
| 2011 | 43,433 | -0.8% |
| 2010 | 43,787 | - |
Race / Ethnicity in Danville
See the full breakdown
Danville is:
38.8% White with 16,369 White residents.
50.5% African American with 21,304 African American residents.
0.0% American Indian with 20 American Indian residents.
1.2% Asian with 503 Asian residents.
0.0% Hawaiian with 0 Hawaiian residents.
0.1% Other with 29 Other residents.
3.9% Two Or More with 1,641 Two Or More residents.
5.6% Hispanic with 2,348 Hispanic residents.
| Race | Danville | VA | USA |
|---|---|---|---|
| White | 38.8% | 58.4% | 57.4% |
| African American | 50.5% | 18.3% | 11.9% |
| American Indian | 0.0% | 0.1% | 0.5% |
| Asian | 1.2% | 6.9% | 5.9% |
| Hawaiian | 0.0% | 0.1% | 0.2% |
| Other | 0.1% | 0.6% | 0.6% |
| Two Or More | 3.9% | 4.7% | 4.3% |
| Hispanic | 5.6% | 11.0% | 19.3% |
Gender in Danville
See the full breakdown
Danville is 53.8% female with 22,705 female residents.
Danville is 46.2% male with 19,508 male residents.
| Gender | Danville | VA | USA |
|---|---|---|---|
| Female | 53.8% | 50.6% | 50.5% |
| Male | 46.2% | 49.4% | 49.5% |
Highest level of educational attainment in Danville for adults over 25
See the full breakdown
5.0% of adults in Danville completed < 9th grade.
9.0% of adults in Danville completed 9-12th grade.
40.0% of adults in Danville completed high school / ged.
18.0% of adults in Danville completed some college.
9.0% of adults in Danville completed associate's degree.
11.0% of adults in Danville completed bachelor's degree.
6.0% of adults in Danville completed master's degree.
1.0% of adults in Danville completed professional degree.
1.0% of adults in Danville completed doctorate degree.
| Education | Danville | VA | USA |
|---|---|---|---|
| < 9th Grade | 5.0% | 2.0% | 4.0% |
| 9-12th Grade | 9.0% | 5.0% | 6.0% |
| High School / GED | 40.0% | 24.0% | 26.0% |
| Some College | 18.0% | 18.0% | 19.0% |
| Associate's Degree | 9.0% | 8.0% | 9.0% |
| Bachelor's Degree | 11.0% | 24.0% | 22.0% |
| Master's Degree | 6.0% | 14.0% | 10.0% |
| Professional Degree | 1.0% | 3.0% | 2.0% |
| Doctorate Degree | 1.0% | 2.0% | 2.0% |
Household Income For Danville, Virginia
See the full breakdown
8.7% of households in Danville earn Less than $10,000.
8.5% of households in Danville earn $10,000 to $14,999.
13.9% of households in Danville earn $15,000 to $24,999.
10.3% of households in Danville earn $25,000 to $34,999.
13.7% of households in Danville earn $35,000 to $49,999.
16.0% of households in Danville earn $50,000 to $74,999.
10.7% of households in Danville earn $75,000 to $99,999.
9.6% of households in Danville earn $100,000 to $149,999.
5.2% of households in Danville earn $150,000 to $199,999.
3.4% of households in Danville earn $200,000 or more.
| Income | Danville | VA | USA |
|---|---|---|---|
| Less than $10,000 | 8.7% | 4.2% | 5.0% |
| $10,000 to $14,999 | 8.5% | 2.7% | 3.4% |
| $15,000 to $24,999 | 13.9% | 5.2% | 6.3% |
| $25,000 to $34,999 | 10.3% | 5.7% | 6.6% |
| $35,000 to $49,999 | 13.7% | 8.8% | 10.1% |
| $50,000 to $74,999 | 16.0% | 14.3% | 15.5% |
| $75,000 to $99,999 | 10.7% | 12.1% | 12.6% |
| $100,000 to $149,999 | 9.6% | 18.1% | 17.5% |
| $150,000 to $199,999 | 5.2% | 11.1% | 9.6% |
| $200,000 or more | 3.4% | 17.7% | 13.4% |
Source: U.S. Census ACS 5-year estimates (2024)


