Compare Colorado Springs to…
Colorado Springs SnackAbility
Overall SnackAbility
Crime in Colorado Springs summary. We use data from the FBI to determine the crime rates in Colorado Springs. Key points include:
There were 20,467 total crimes in Colorado Springs in the last reporting year.
The overall crime rate per 100,000 people in Colorado Springs is 4,164.4 / 100k people.
The violent crime rate per 100,000 people in Colorado Springs is 715.6 / 100k people.
The property crime rate per 100,000 people in Colorado Springs is 3,448.8 / 100k people.
Overall, crime in Colorado Springs is 96.51% above the national average.
Total Crimes
Above National Average
Crime In Colorado Springs Comparison Table
| Statistic | Count Raw |
Colorado Springs / 100k People |
Colorado / 100k People |
National / 100k People |
|---|---|---|---|---|
| Total Crimes Per 100K | 20,467 | 4,164.4 | 3,069.1 | 2,119.2 |
| Violent Crime | 3,517 | 715.6 | 476.3 | 359.0 |
| Murder | 38 | 7.7 | 4.5 | 5.0 |
| Robbery | 381 | 77.5 | 63.0 | 61.0 |
| Aggravated Assault | 2,600 | 529.0 | 350.5 | 256.0 |
| Property Crime | 16,950 | 3,448.8 | 2,592.8 | 1,760.0 |
| Burglary | 2,604 | 529.8 | 348.0 | 229.0 |
| Larceny | 10,947 | 2,227.4 | 1,754.2 | 1,272.0 |
| Car Theft | 3,399 | 691.6 | 490.6 | 259.0 |
Source: FBI Uniform Crime Reporting (2024)
Cost of living in Colorado Springs summary. We use data on the cost of living to determine how expensive it is to live in Colorado Springs. Real estate prices drive most of the variance in cost of living around Colorado. Key points include:
The cost of living in Colorado Springs is 122 with 100 being average.
The cost of living in Colorado Springs is 1.2x higher than the national average.
The median home value in Colorado Springs is $449,451.
The median income in Colorado Springs is $84,818.
Colorado Springs's Overall Cost Of Living
Higher Than The National Average
Cost Of Living In Colorado Springs Comparison Table
| Living Expense | Colorado Springs | Colorado | National Average |
|---|---|---|---|
| Overall | 122 | 114 | 100 |
| Services | 103 | 104 | 100 |
| Groceries | 108 | 107 | 100 |
| Health | 152 | 135 | 100 |
| Housing | 112 | 104 | 100 |
| Transportation | 109 | 107 | 100 |
| Utilities | 104 | 107 | 100 |
Source: Cost of living index, normalized to US average = 100
Colorado Springs, CO Weather
The average high in Colorado Springs is 61.5° and the average low is 33.4°.
There are 44.4 days of precipitation each year.
Expect an average of 18.3 inches of precipitation each year with 67.1 inches of snow.
| Stat | Colorado Springs |
|---|---|
| Average Annual High | 61.5 |
| Average Annual Low | 33.4 |
| Annual Precipitation Days | 44.4 |
| Average Annual Precipitation | 18.3 |
| Average Annual Snowfall | 67.1 |
Average High
Days of Rain
Source: NOAA climate normals (30-year)
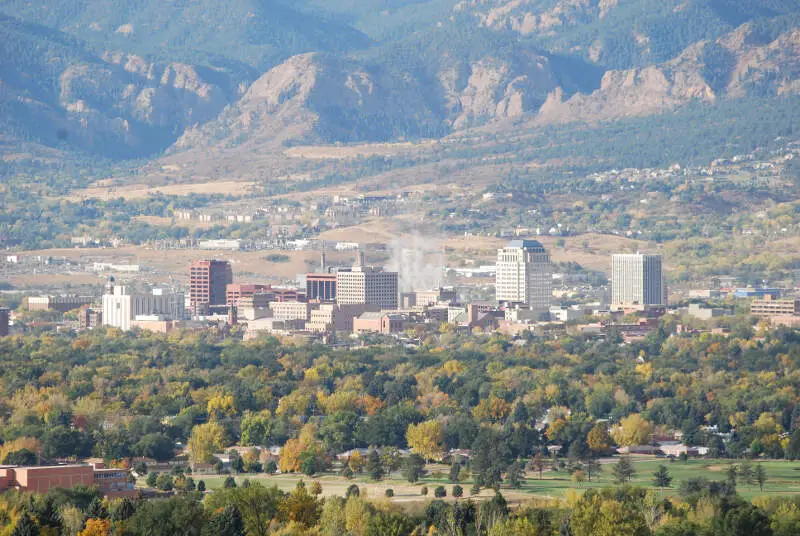
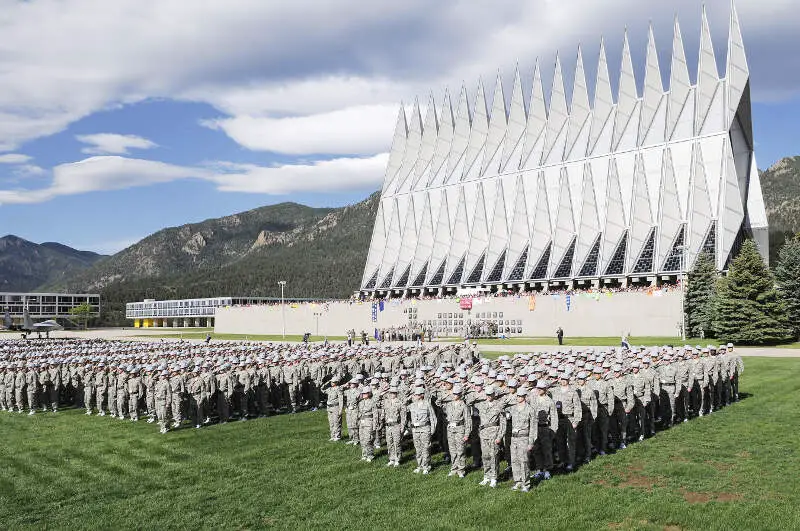
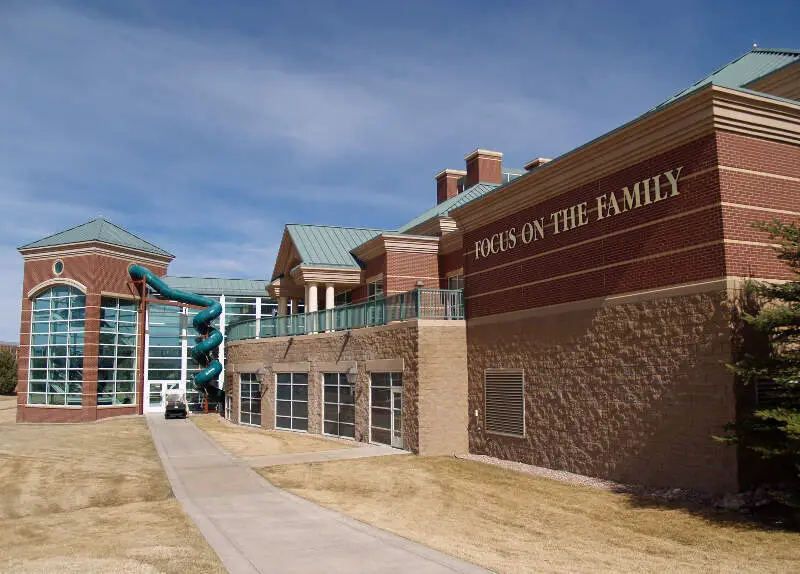
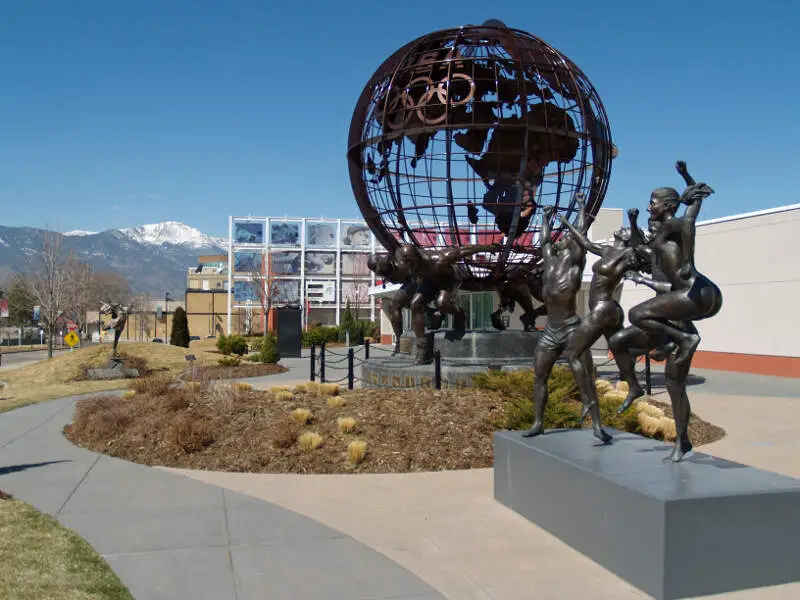
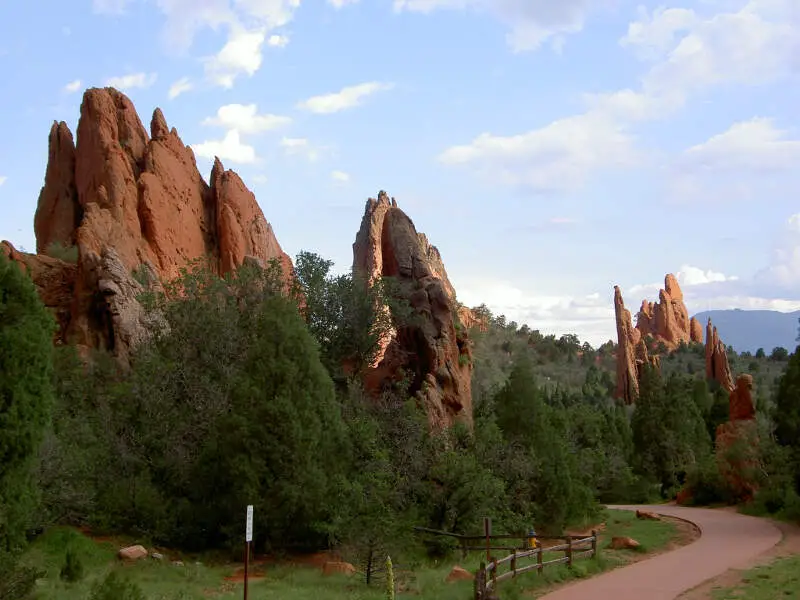
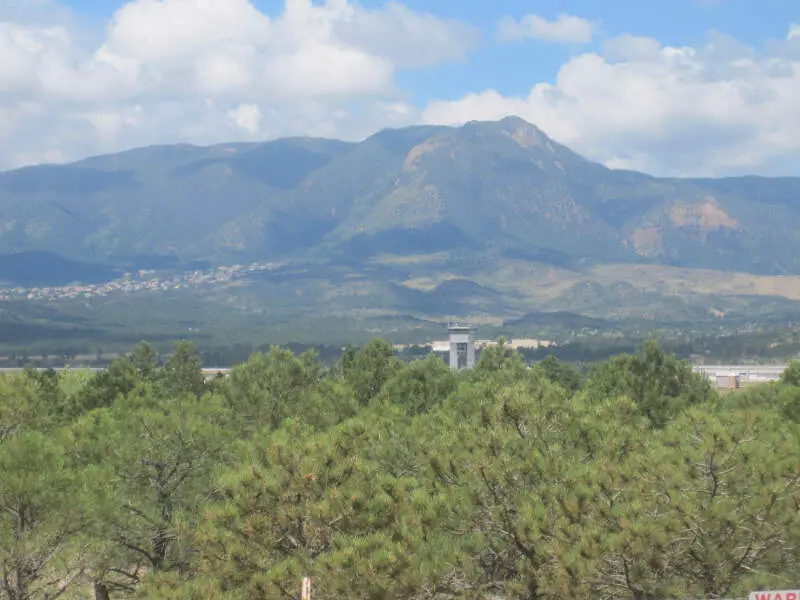
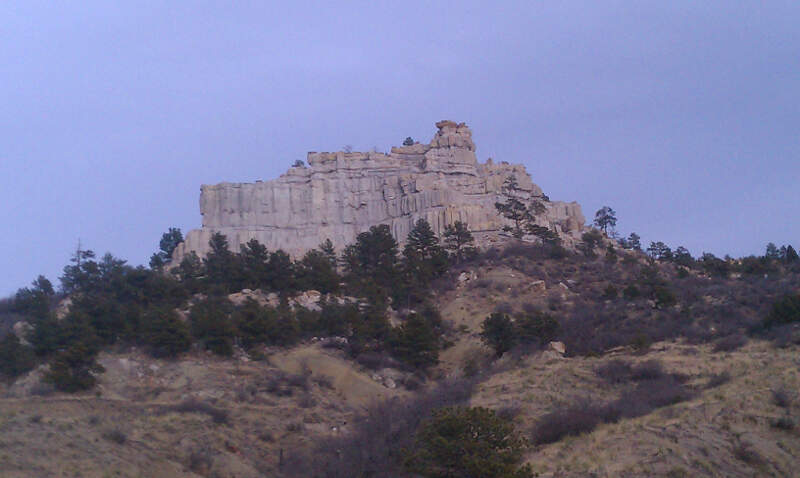
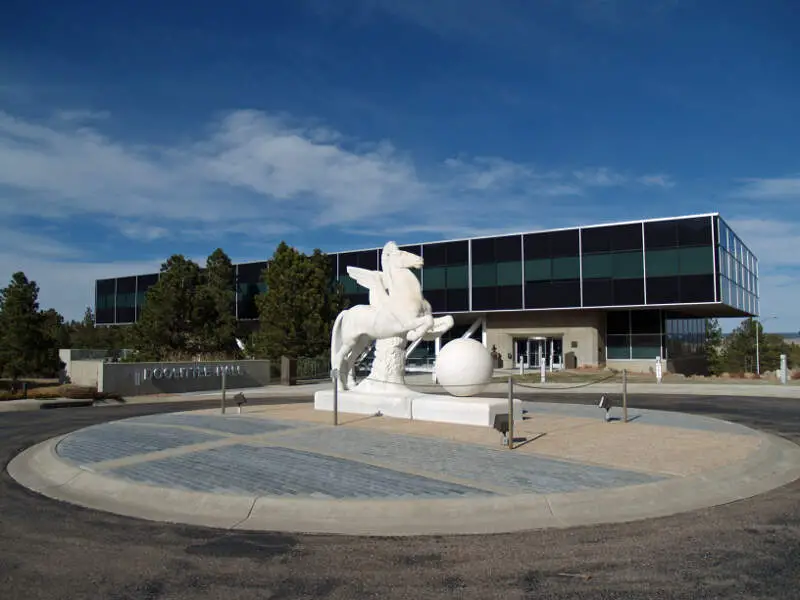
Colorado Springs, CO Photos
1 Reviews & Comments About Colorado Springs

I love Colorado Springs. My son and his family live there and I visit four times each year. I don't like winter, but in the summer we can hike and visit the zoos. Their neighborhood is at the bottom of a mountain, so there is plenty of wildlife.
I love the Garden of the Gods. And I kissed a giraffe at the zoo! Both so much fun.
Rankings & Articles For Colorado Springs


Locations Around Colorado Springs
Map Of Colorado Springs, CO
Best Places Around Colorado Springs
Manitou Springs, CO
Population 4,735
Air Force Academy, CO
Population 6,727
Stratmoor, CO
Population 5,412
Fort Carson, CO
Population 18,019
Fountain, CO
Population 29,300
Woodland Park, CO
Population 7,949
Monument, CO
Population 11,735
Cimarron Hills, CO
Population 19,817
Black Forest, CO
Population 15,738
Woodmoor, CO
Population 8,934
Colorado Springs Demographics And Statistics
Population over time in Colorado Springs
The current population in Colorado Springs is 487,887. The population has increased 20.8% from 2010.
| Year | Population | % Change |
|---|---|---|
| 2024 | 487,887 | 1.0% |
| 2023 | 483,099 | 0.7% |
| 2022 | 479,612 | 0.9% |
| 2021 | 475,282 | 0.8% |
| 2020 | 471,686 | 1.5% |
| 2019 | 464,871 | 1.6% |
| 2018 | 457,502 | 1.7% |
| 2017 | 450,000 | 0.3% |
| 2016 | 448,759 | 1.5% |
| 2015 | 442,040 | 2.0% |
| 2014 | 433,547 | 1.8% |
| 2013 | 425,805 | 2.0% |
| 2012 | 417,534 | 1.7% |
| 2011 | 410,688 | 1.7% |
| 2010 | 403,983 | - |
Race / Ethnicity in Colorado Springs
See the full breakdown
Colorado Springs is:
65.2% White with 317,955 White residents.
5.3% African American with 25,985 African American residents.
0.2% American Indian with 1,129 American Indian residents.
2.9% Asian with 13,950 Asian residents.
0.2% Hawaiian with 734 Hawaiian residents.
0.6% Other with 3,117 Other residents.
6.4% Two Or More with 31,052 Two Or More residents.
19.3% Hispanic with 93,965 Hispanic residents.
| Race | Colorado Springs | CO | USA |
|---|---|---|---|
| White | 65.2% | 64.8% | 57.4% |
| African American | 5.3% | 3.8% | 11.9% |
| American Indian | 0.2% | 0.4% | 0.5% |
| Asian | 2.9% | 3.2% | 5.9% |
| Hawaiian | 0.2% | 0.1% | 0.2% |
| Other | 0.6% | 0.5% | 0.6% |
| Two Or More | 6.4% | 4.6% | 4.3% |
| Hispanic | 19.3% | 22.5% | 19.3% |
Gender in Colorado Springs
See the full breakdown
Colorado Springs is 50.0% female with 243,807 female residents.
Colorado Springs is 50.0% male with 244,079 male residents.
| Gender | Colorado Springs | CO | USA |
|---|---|---|---|
| Female | 50.0% | 49.3% | 50.5% |
| Male | 50.0% | 50.7% | 49.5% |
Highest level of educational attainment in Colorado Springs for adults over 25
See the full breakdown
4.0% of adults in Colorado Springs completed < 9th grade.
3.0% of adults in Colorado Springs completed 9-12th grade.
19.0% of adults in Colorado Springs completed high school / ged.
22.0% of adults in Colorado Springs completed some college.
10.0% of adults in Colorado Springs completed associate's degree.
25.0% of adults in Colorado Springs completed bachelor's degree.
13.0% of adults in Colorado Springs completed master's degree.
2.0% of adults in Colorado Springs completed professional degree.
2.0% of adults in Colorado Springs completed doctorate degree.
| Education | Colorado Springs | CO | USA |
|---|---|---|---|
| < 9th Grade | 4.0% | 3.0% | 4.0% |
| 9-12th Grade | 3.0% | 4.0% | 6.0% |
| High School / GED | 19.0% | 20.0% | 26.0% |
| Some College | 22.0% | 19.0% | 19.0% |
| Associate's Degree | 10.0% | 8.0% | 9.0% |
| Bachelor's Degree | 25.0% | 28.0% | 22.0% |
| Master's Degree | 13.0% | 13.0% | 10.0% |
| Professional Degree | 2.0% | 3.0% | 2.0% |
| Doctorate Degree | 2.0% | 2.0% | 2.0% |
Household Income For Colorado Springs, Colorado
See the full breakdown
3.7% of households in Colorado Springs earn Less than $10,000.
2.2% of households in Colorado Springs earn $10,000 to $14,999.
4.7% of households in Colorado Springs earn $15,000 to $24,999.
6.1% of households in Colorado Springs earn $25,000 to $34,999.
9.9% of households in Colorado Springs earn $35,000 to $49,999.
17.7% of households in Colorado Springs earn $50,000 to $74,999.
13.7% of households in Colorado Springs earn $75,000 to $99,999.
19.8% of households in Colorado Springs earn $100,000 to $149,999.
10.1% of households in Colorado Springs earn $150,000 to $199,999.
12.2% of households in Colorado Springs earn $200,000 or more.
| Income | Colorado Springs | CO | USA |
|---|---|---|---|
| Less than $10,000 | 3.7% | 3.9% | 5.0% |
| $10,000 to $14,999 | 2.2% | 2.4% | 3.4% |
| $15,000 to $24,999 | 4.7% | 4.8% | 6.3% |
| $25,000 to $34,999 | 6.1% | 5.2% | 6.6% |
| $35,000 to $49,999 | 9.9% | 8.4% | 10.1% |
| $50,000 to $74,999 | 17.7% | 14.6% | 15.5% |
| $75,000 to $99,999 | 13.7% | 12.8% | 12.6% |
| $100,000 to $149,999 | 19.8% | 19.2% | 17.5% |
| $150,000 to $199,999 | 10.1% | 11.7% | 9.6% |
| $200,000 or more | 12.2% | 17.0% | 13.4% |
Source: U.S. Census ACS 5-year estimates (2024)


