Colorado Springsvs.Breckenridge Which City Is Right for You in 2026?
A head-to-head guide to cost of living, jobs, transportation, weather, crime, and quality of life — so you can decide where to live, work, or visit.
Updated 2026-05-26 · By HomeSnacks Editorial
Colorado Springs vs. Breckenridge at a glance
Choosing between Colorado Springs, CO and Breckenridge, TX comes down to which trade-offs matter most to you. Below we break down cost of living, jobs, housing, crime, diversity, weather, transportation, and culture using public data from the U.S. Census Bureau, the FBI, and HomeSnacks' proprietary SnackAbility quality-of-life score.
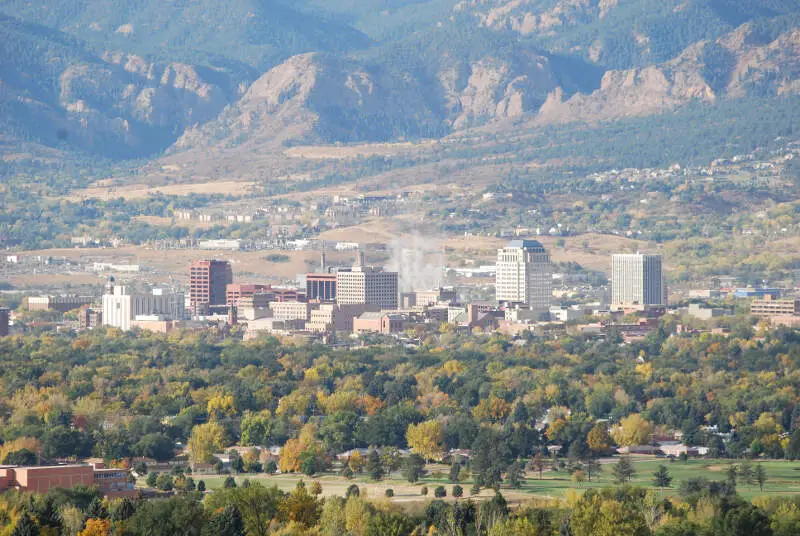
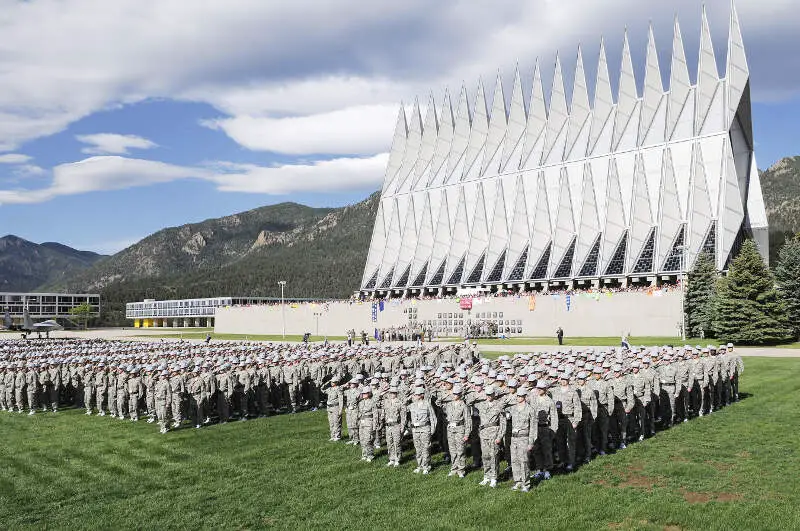
Colorado Springs vs. Breckenridge in photos
A side-by-side look at each city.


Cost of living
Breckenridge is the cheaper city overall — 51% higher in Colorado Springs than its rival. Index baseline: 100 = national average.
| Living expense | Colorado Springs | Breckenridge | US average |
|---|---|---|---|
| Overall | 122 | 81 | 100 |
| Services | 103 | 99 | 100 |
| Groceries | 108 | 96 | 100 |
| Health | 152 | 46 | 100 |
| Housing | 112 | 100 | 100 |
| Transportation | 109 | 103 | 100 |
| Utilities | 104 | 96 | 100 |
Lower index = cheaper. 100 = U.S. national average. Bar inside each cell scales relative to the highest value in the table.
Sources: HomeSnacks Cost of Living indices, normalized so 100 = U.S. national average. Drill in: Colorado Springs cost of living, Breckenridge cost of living, or the cheapest cities in America.
Housing breakdown
Home prices are higher in Colorado Springs. Compare absolute price and price-to-income — a $500k home in a $100k-income city is very different from one in a $50k-income city.
| Metric | Colorado Springs | Breckenridge | United States |
|---|---|---|---|
| Median Home Value | $449,451 | $136,982 | $332,700 |
| Median Rent | $1,648 | $839 | $1,413 |
| Median Income | $84,818 | $48,000 | $80,734 |
| Home Value To Income | 5.3x | 2.9x | 4.1x |
| Rent To Monthly Income | 0.23x | 0.21x | 0.21x |
Source: U.S. Census Bureau ACS 2020-2024. See also states with the highest rent in America.
Crime
Breckenridge is the safer city — total crime rate of 1,912 per 100k people vs 4,164 for Colorado Springs. US average: 2,119.
| Crime (per 100k) | Colorado Springs | Breckenridge | US average |
|---|---|---|---|
| Total crime | 4,164 | 1,912 | 2,119 |
| Murder | 8 | 20 | 5 |
| Robbery | 78 | 0 | 61 |
| Aggravated Assault | 529 | 429 | 256 |
| Violent Crime | 716 | 468 | 359 |
| Burglary | 530 | 254 | 229 |
| Larceny | 2,227 | 1,092 | 1,272 |
| Car Theft | 692 | 98 | 259 |
| Property Crime | 3,449 | 1,444 | 1,760 |
Lower = safer. Bar inside each cell scales relative to the highest crime rate in the table.
Source: FBI Uniform Crime Reporting (2024). All rates are per 100,000 people. City pages: Colorado Springs crime, Breckenridge crime. See also: safest cities in America.
Diversity
Breckenridge is more racially diverse — lower HHI (closer to 0) means a more even mix across groups.
| Group | Colorado Springs | Breckenridge | United States |
|---|---|---|---|
| White | 65.2% | 56.4% | 57.4% |
| African American | 5.3% | 3.1% | 11.9% |
| American Indian | 0.2% | 0.0% | 0.5% |
| Asian | 2.9% | 1.7% | 5.9% |
| Hawaiian | 0.2% | 0.0% | 0.2% |
| Other | 0.6% | 0.2% | 0.6% |
| Two Or More | 6.4% | 1.7% | 4.3% |
| Hispanic | 19.3% | 36.9% | 19.3% |
Source: U.S. Census ACS 2020-2024. Lower HHI = more even racial mix. See also: most diverse cities in America.
SnackAbility — overall quality of life
Colorado Springs scores higher overall — 7/10 vs 3/10. SnackAbility is our 1–10 quality-of-life score; the median U.S. city scores a 7.
SnackAbility is a HomeSnacks proprietary 1–10 score blending jobs, housing, education, commute, amenities, affordability, crime, and diversity. Median U.S. city ≈ 7. Data: Census, BLS, FBI. See also: best places to live in America.
Bottom line: which city is right for you?
Based on the head-to-head data above, here's the short version — pick the city that lines up with what you actually care about.
Choose Colorado Springs if you prioritize…
- more affordable housing relative to Breckenridge.
- a higher overall SnackAbility quality-of-life score.
Choose Breckenridge if you prioritize…
- a lower cost of living (cheaper groceries, services, and day-to-day expenses).
- lower crime — a safer place to live, work, and raise a family.
- a more racially diverse community (lower HHI on Census data).
Methodology: winners are picked from public data — U.S. Census Bureau ACS (income, home value, rent, race/HHI), FBI Uniform Crime Reporting (crime rates per 100k), and HomeSnacks' proprietary SnackAbility quality-of-life score, which blends Bureau of Labor Statistics data with the above.
More about Colorado & Texas

Best Places To Live In Colorado
Photo: Public domain
Cheapest Places To Live In Colorado
Photo: Public domain
Most Dangerous Cities In Colorado
Photo: Public domain
Best Places To Raise A Family In Colorado
Photo: Public domain
Best Places To Retire In Colorado
Photo: Public domain
Richest Cities In Colorado
Photo: Public domain
Safest Places In Colorado
Photo: Public domain
Worst Places To Live In Colorado
Photo: Public domain