Colorado Springsvs.Denver Which City Is Right for You in 2026?
A head-to-head guide to cost of living, jobs, transportation, weather, crime, and quality of life — so you can decide where to live, work, or visit.
Updated 2026-05-26 · By HomeSnacks Editorial
Colorado Springs vs. Denver at a glance
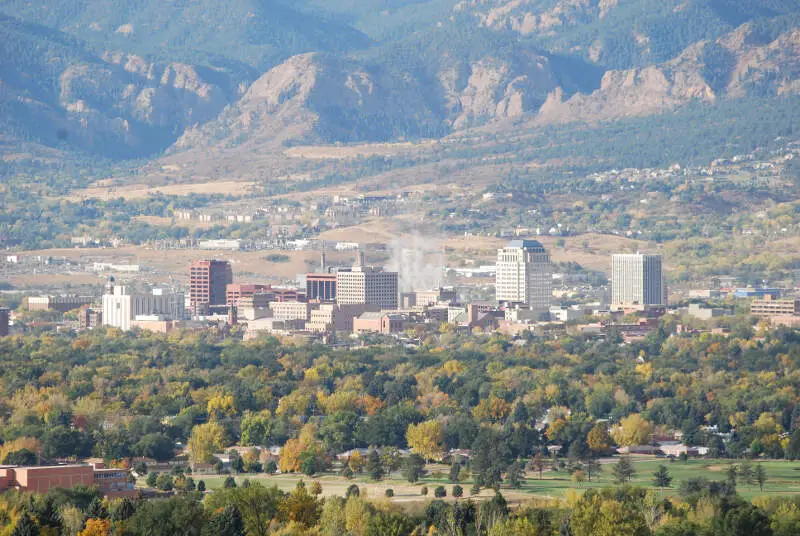
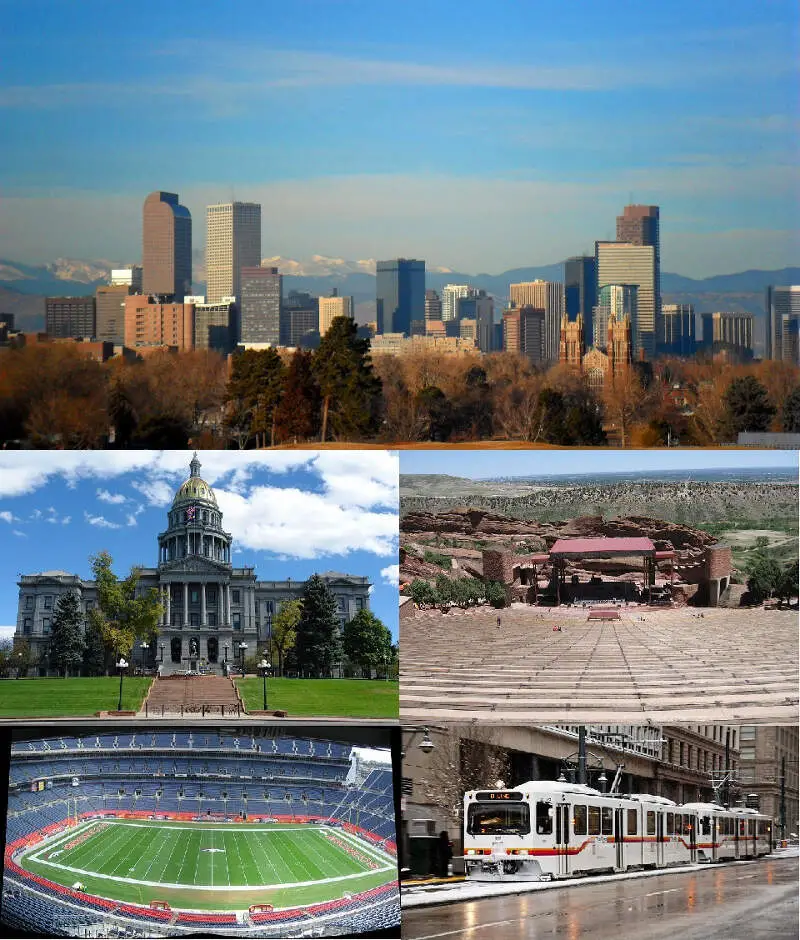
If you're weighing Colorado Springs, CO against Denver, CO, you're really weighing two different versions of American life. Colorado Springs is a home rule city that is the county seat of, and the most populous city in, El Paso County, Colorado, United States. The city had a population of 478,961 at the 2020 census, a 15.02% increase since 2010. Denver is the capital and most populous city of the U.S. state of Colorado.
On cost of living, Colorado Springs is the cheaper city: its overall index sits at 122 versus 142 in Denver (100 = national average). Median home values run $449,451 in Colorado Springs and $539,666 in Denver, with median rents at $1,648 and $1,831 respectively. That puts the home-value-to-income ratio at 5.3x in Colorado Springs versus 5.7x in Denver.
FBI crime data adds another wrinkle. Colorado Springs reports 4,164 total crimes per 100,000 residents annually versus 5,755 in Denver. Denver is the more racially diverse of the two on a Herfindahl index basis — Colorado Springs skews 65% White while Denver skews 54% White. On HomeSnacks' overall SnackAbility score, Denver edges ahead at 8/10 versus 7/10 for Colorado Springs.
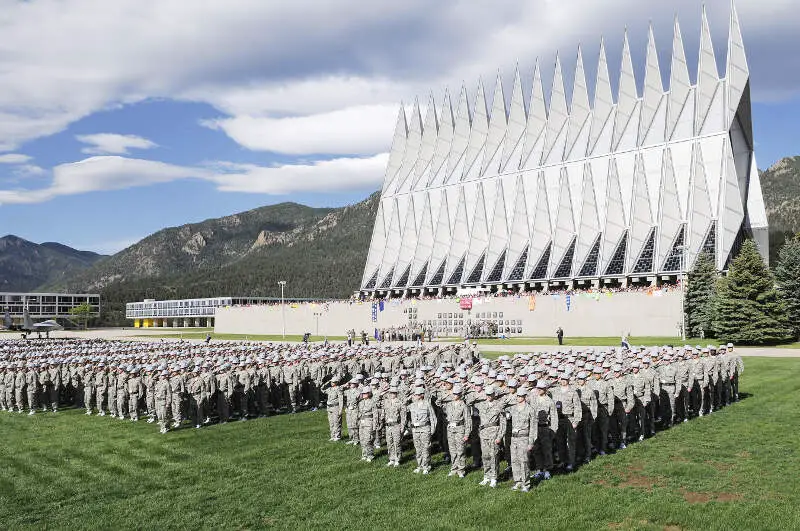
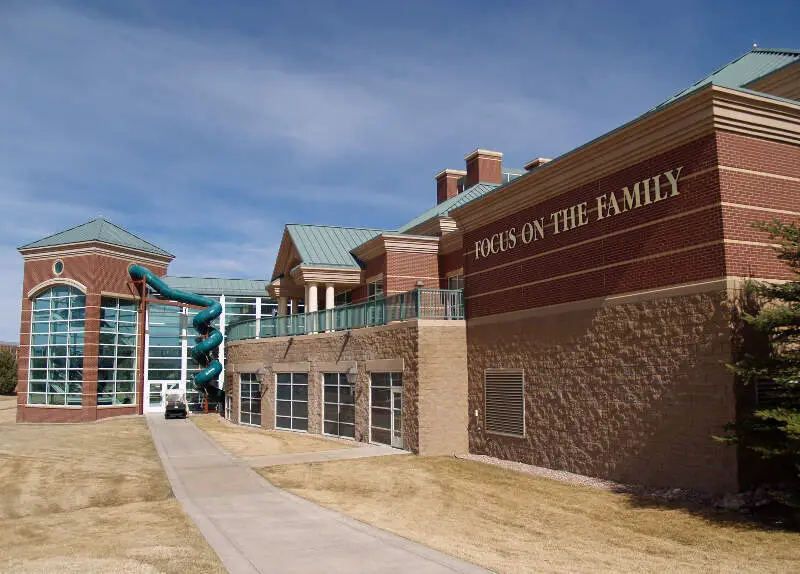
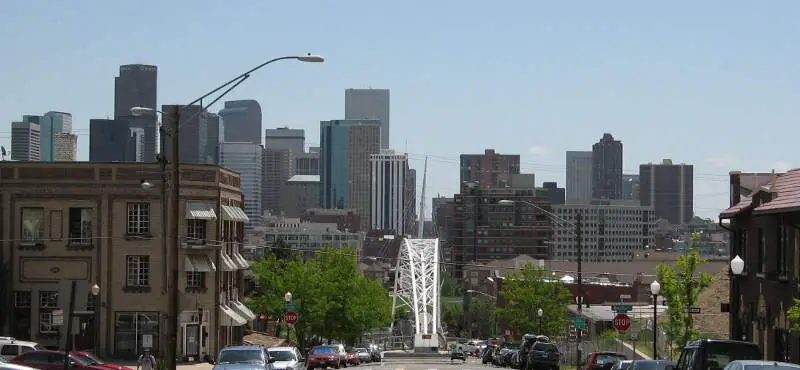
Colorado Springs vs. Denver in photos
A side-by-side look at each city.

Cost of living
Colorado Springs is the cheaper city overall — 14% higher in Denver than its rival. Index baseline: 100 = national average.
| Living expense | Colorado Springs | Denver | US average |
|---|---|---|---|
| Overall | 122 | 142 | 100 |
| Services | 103 | 108 | 100 |
| Groceries | 108 | 107 | 100 |
| Health | 152 | 214 | 100 |
| Housing | 112 | 113 | 100 |
| Transportation | 109 | 110 | 100 |
| Utilities | 104 | 111 | 100 |
Lower index = cheaper. 100 = U.S. national average. Bar inside each cell scales relative to the highest value in the table.
Sources: HomeSnacks Cost of Living indices, normalized so 100 = U.S. national average. Drill in: Colorado Springs cost of living, Denver cost of living, or the cheapest cities in America.
Housing breakdown
Home prices are higher in Denver. Compare absolute price and price-to-income — a $500k home in a $100k-income city is very different from one in a $50k-income city.
| Metric | Colorado Springs | Denver | United States |
|---|---|---|---|
| Median Home Value | $449,451 | $539,666 | $332,700 |
| Median Rent | $1,648 | $1,831 | $1,413 |
| Median Income | $84,818 | $94,718 | $80,734 |
| Home Value To Income | 5.3x | 5.7x | 4.1x |
| Rent To Monthly Income | 0.23x | 0.23x | 0.21x |
Source: U.S. Census Bureau ACS 2020-2024. See also states with the highest rent in America.
Crime
Colorado Springs is the safer city — total crime rate of 4,164 per 100k people vs 5,755 for Denver. US average: 2,119.
| Crime (per 100k) | Colorado Springs | Denver | US average |
|---|---|---|---|
| Total crime | 4,164 | 5,755 | 2,119 |
| Murder | 8 | 10 | 5 |
| Robbery | 78 | 176 | 61 |
| Aggravated Assault | 529 | 713 | 256 |
| Violent Crime | 716 | 993 | 359 |
| Burglary | 530 | 708 | 229 |
| Larceny | 2,227 | 2,822 | 1,272 |
| Car Theft | 692 | 1,232 | 259 |
| Property Crime | 3,449 | 4,762 | 1,760 |
Lower = safer. Bar inside each cell scales relative to the highest crime rate in the table.
Source: FBI Uniform Crime Reporting (2024). All rates are per 100,000 people. City pages: Colorado Springs crime, Denver crime. See also: safest cities in America.
Diversity
Denver is more racially diverse — lower HHI (closer to 0) means a more even mix across groups.
| Group | Colorado Springs | Denver | United States |
|---|---|---|---|
| White | 65.2% | 54.0% | 57.4% |
| African American | 5.3% | 8.6% | 11.9% |
| American Indian | 0.2% | 0.3% | 0.5% |
| Asian | 2.9% | 3.6% | 5.9% |
| Hawaiian | 0.2% | 0.1% | 0.2% |
| Other | 0.6% | 0.5% | 0.6% |
| Two Or More | 6.4% | 4.8% | 4.3% |
| Hispanic | 19.3% | 28.0% | 19.3% |
Source: U.S. Census ACS 2020-2024. Lower HHI = more even racial mix. See also: most diverse cities in America.
SnackAbility — overall quality of life
Denver scores higher overall — 8/10 vs 7/10. SnackAbility is our 1–10 quality-of-life score; the median U.S. city scores a 7.
SnackAbility is a HomeSnacks proprietary 1–10 score blending jobs, housing, education, commute, amenities, affordability, crime, and diversity. Median U.S. city ≈ 7. Data: Census, BLS, FBI. See also: best places to live in America.
Getting around: Colorado Springs vs. Denver
How each city handles commuting, transit, walkability, and car culture — the day-to-day reality that shapes where you'd actually want to live.
Colorado Springs is car-dependent, and traffic on I-25 and Powers Boulevard is manageable: the grid layout and a population of about 488,000 keep rush hour far less punishing than Denver's. Mountain Metro Transit covers the basics but runs infrequent routes, so a vehicle is essentially non-negotiable for most residents.
Many Springs residents actually drive up to Denver for work, a 70-mile haul that adds up fast.
Denver gives you genuine options. RTD's light rail and commuter rail network connects Union Station to the airport, the Tech Center, and neighborhoods like RiNo and Wash Park. The city is also solidly bikeable in its core.
Denver's I-25 and I-70 interchanges can be brutal during peak hours, and parking in Capitol Hill or LoDo costs real money. If transit access matters to your daily life, Denver has a clear advantage.
Jobs and careers in Colorado Springs vs. Denver
The local job market, dominant industries, and which city to choose based on your career.
Colorado Springs skews heavily toward defense and government work. Peterson Space Force Base, Fort Carson, NORAD, and the U.S. Air Force Academy are economic anchors, and healthcare through UCHealth and CommonSpirit is a major employer as well. The median household income of $84,818 reflects a stable but not especially high-earning market, and the private-sector tech scene is thin compared to what you'd find 70 miles north.
If your career is in defense contracting, cybersecurity with a clearance, or military medicine, the Springs can be a sweet spot.
Denver's economy is broader. You'll find corporate headquarters like Lockheed Martin Space, Arrow Electronics, and DaVita, alongside a growing tech corridor and a healthcare sector anchored by UCHealth and SCL Health. The median household income of $94,718 reflects that range of opportunity.
The startup culture in neighborhoods like RiNo attracts remote workers and entrepreneurs. The trade-off is a cost of living index of 142 versus Colorado Springs' 122: you earn more, but you spend more too.
Weather and climate
What to expect day-to-day — sun, fog, heat, rain, and the seasonal extremes that shape the lifestyle.
Colorado Springs sits at around 6,000 feet elevation, which means you get about 300 days of sunshine per year but also sharp temperature swings: a warm January afternoon can flip to six inches of snow overnight. Summers are warm and dry, rarely cracking 90°F, and afternoon thunderstorms roll through the Front Range reliably in July and August. Winters are cold but generally not brutal; the city sits in a wind corridor that can clear snow quickly, and Pikes Peak creates some interesting micro-weather in the southern and western neighborhoods.
Denver is slightly lower in elevation (5,280 feet) and experiences similar sunny, semi-arid conditions, but tends to be warmer in winter due to the Chinook effect: warm westerly winds can push January temps into the 60s for days at a stretch. Summer is comparable to the Springs, though Denver's urban heat island makes city neighborhoods noticeably warmer. Both cities get their share of Front Range snowstorms from October through April, and both get far more sunshine annually than most U.S. cities.
Culture, nightlife, and entertainment
Food, music, neighborhoods, and the city vibe that gives each place its personality.
Colorado Springs has a reputation as a conservative, family-oriented city, and the cultural scene reflects that: you'll find solid performing arts at the Pikes Peak Center, a strong craft brewery scene along Tejon Street, and an Old Colorado City neighborhood worth wandering on weekends. The city's dining options have improved substantially in recent years, but nightlife is modest and closes early by major-metro standards. Proximity to the Air Force Academy also brings a distinct military influence to the community's character.
Denver is in a different league for urban culture. The RiNo Art District has national-caliber galleries and some of the best food halls in the Mountain West. Colfax Avenue is one of the longest commercial streets in the country, with dive bars, music venues, and late-night diners spread across its length.
The Denver Center for the Performing Arts rivals any mid-size city in the country, and the music scene (from Red Rocks Amphitheatre just outside town to venues like the Ogden and Fillmore) is exceptional. If nightlife, dining variety, and cultural programming matter to you, Denver is the obvious choice.
Outdoor activities and day trips
Parks, beaches, hikes, and the weekend escapes that define life outside the city limits.
Colorado Springs may actually have the edge here for sheer access to dramatic outdoor scenery. Garden of the Gods is a free park inside the city limits, and Pikes Peak (accessible by highway or the cog railway) looms over daily life in a way that never gets old.
Cheyenne Mountain State Park, North Cheyenne Canon, and the Barr Trail give hikers and trail runners a wide range of options without leaving the metro area. The Springs also serves as a base camp for exploring the Collegiate Peaks, Great Sand Dunes, and Royal Gorge.
Denver is no slouch outdoors, but the best assets require a drive. Rocky Mountain National Park is about 90 minutes away, and the I-70 mountain corridor puts you at ski resorts like Breckenridge, Keystone, and Vail in one to two hours.
Closer in, Washington Park and Cherry Creek Reservoir handle everyday cycling and running, and the South Platte River trail system is excellent for urban recreation. If you want wilderness at your literal doorstep rather than 45 minutes away, Colorado Springs has a real advantage.
Bottom line: which city is right for you?
Based on the head-to-head data above, here's the short version — pick the city that lines up with what you actually care about.
Choose Colorado Springs if you prioritize…
- a lower cost of living (cheaper groceries, services, and day-to-day expenses).
- lower crime — a safer place to live, work, and raise a family.
Choose Denver if you prioritize…
- more affordable housing relative to Colorado Springs.
- a more racially diverse community (lower HHI on Census data).
- a higher overall SnackAbility quality-of-life score.
Methodology: winners are picked from public data — U.S. Census Bureau ACS (income, home value, rent, race/HHI), FBI Uniform Crime Reporting (crime rates per 100k), and HomeSnacks' proprietary SnackAbility quality-of-life score, which blends Bureau of Labor Statistics data with the above.
More about Colorado

Best Places To Live In Colorado
Photo: Public domain
Cheapest Places To Live In Colorado
Photo: Public domain
Most Dangerous Cities In Colorado
Photo: Public domain
Best Places To Raise A Family In Colorado
Photo: Public domain
Best Places To Retire In Colorado
Photo: Public domain
Richest Cities In Colorado
Photo: Public domain
Safest Places In Colorado
Photo: Public domain
Worst Places To Live In Colorado
Photo: Public domain