Middletown SnackAbility
Overall SnackAbility
Crime in Middletown summary. We use data from the FBI to determine the crime rates in Middletown. Key points include:
There were 586 total crimes in Middletown in the last reporting year.
The overall crime rate per 100,000 people in Middletown is 1,212.5 / 100k people.
The violent crime rate per 100,000 people in Middletown is 62.1 / 100k people.
The property crime rate per 100,000 people in Middletown is 1,150.4 / 100k people.
Overall, crime in Middletown is -42.79% below the national average.
Total Crimes
Below National Average
Crime In Middletown Comparison Table
| Statistic | Count Raw |
Middletown / 100k People |
Connecticut / 100k People |
National / 100k People |
|---|---|---|---|---|
| Total Crimes Per 100K | 586 | 1,212.5 | 1,502.1 | 2,119.2 |
| Violent Crime | 30 | 62.1 | 136.0 | 359.0 |
| Murder | 1 | 2.1 | 2.4 | 5.0 |
| Robbery | 9 | 18.6 | 38.1 | 61.0 |
| Aggravated Assault | 18 | 37.2 | 77.5 | 256.0 |
| Property Crime | 556 | 1,150.4 | 1,366.1 | 1,760.0 |
| Burglary | 56 | 115.9 | 117.3 | 229.0 |
| Larceny | 418 | 864.9 | 1,013.7 | 1,272.0 |
| Car Theft | 82 | 169.7 | 235.0 | 259.0 |
Source: FBI Uniform Crime Reporting (2024)
Cost of living in Middletown summary. We use data on the cost of living to determine how expensive it is to live in Middletown. Real estate prices drive most of the variance in cost of living around Connecticut. Key points include:
The cost of living in Middletown is 111 with 100 being average.
The cost of living in Middletown is 1.1x higher than the national average.
The median home value in Middletown is $354,794.
The median income in Middletown is $79,438.
Middletown's Overall Cost Of Living
Higher Than The National Average
Cost Of Living In Middletown Comparison Table
| Living Expense | Middletown | Connecticut | National Average |
|---|---|---|---|
| Overall | 111 | 116 | 100 |
| Services | 107 | 107 | 100 |
| Groceries | 110 | 111 | 100 |
| Health | 125 | 137 | 100 |
| Housing | 103 | 108 | 100 |
| Transportation | 104 | 110 | 100 |
| Utilities | 106 | 111 | 100 |
Source: Cost of living index, normalized to US average = 100
Middletown, CT Weather
The average high in Middletown is 60.5° and the average low is 40.3°.
There are 78.6 days of precipitation each year.
Expect an average of 50.5 inches of precipitation each year with 33.0 inches of snow.
| Stat | Middletown |
|---|---|
| Average Annual High | 60.5 |
| Average Annual Low | 40.3 |
| Annual Precipitation Days | 78.6 |
| Average Annual Precipitation | 50.5 |
| Average Annual Snowfall | 33.0 |
Average High
Days of Rain
Source: NOAA climate normals (30-year)
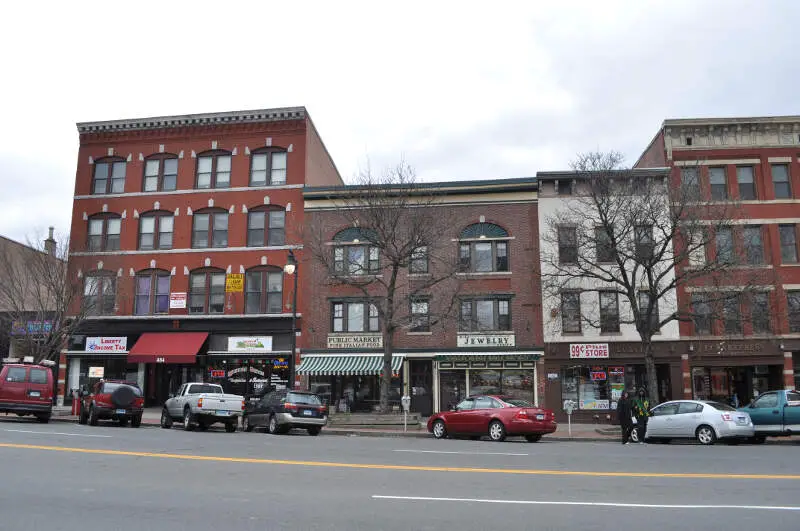
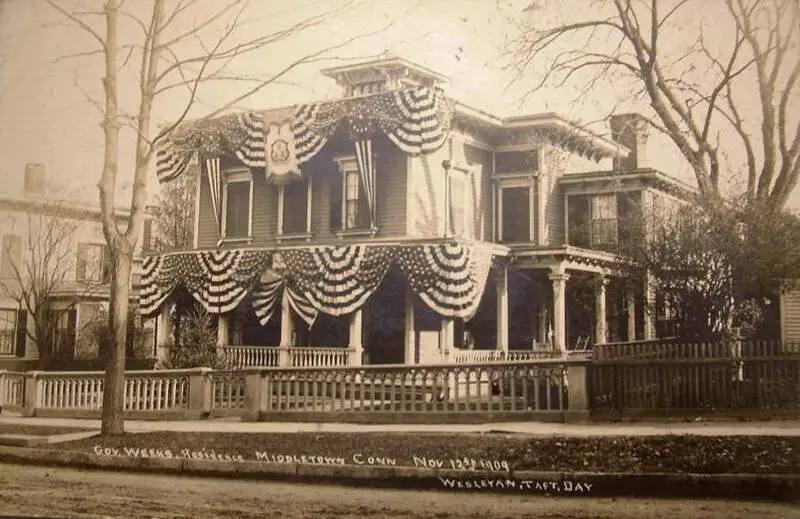
Middletown, CT Photos

1 Reviews & Comments About Middletown

There is a lot to do in Middletown. There are fireworks over the river around the 4th of July, plenary of places to eat and shop, and plenary of school option.
The food on Main Street is awesome. There are a ton of choices for food. The toy store is also amazing.
Rankings & Articles For Middletown


Locations Around Middletown
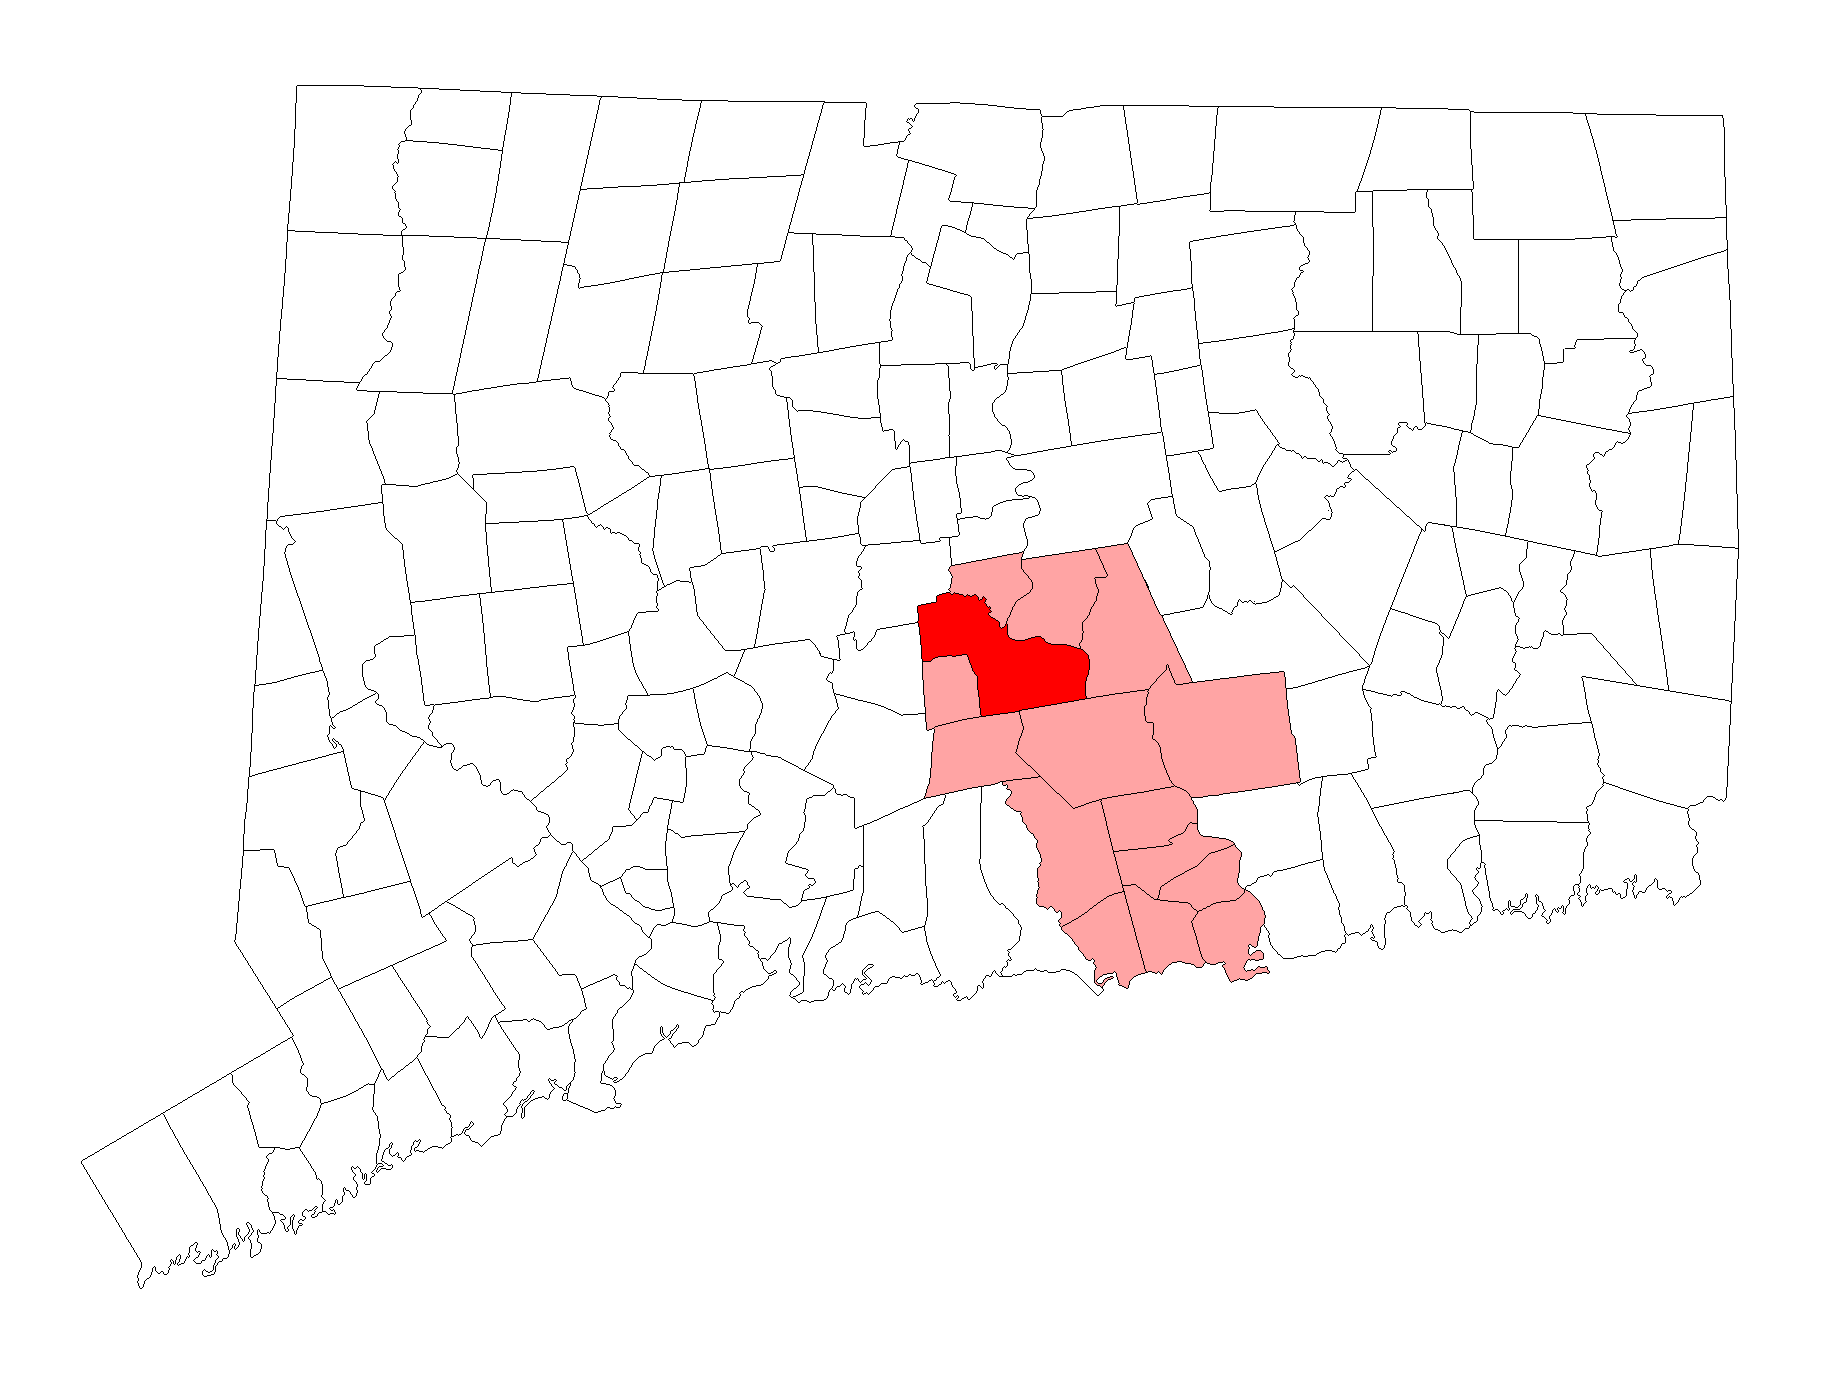
Map Of Middletown, CT
Best Places Around Middletown
Kensington, CT
Population 9,962
West Hartford, CT
Population 63,620
Wethersfield, CT
Population 27,250
Newington, CT
Population 30,896
North Haven, CT
Population 24,336
Portland, CT
Population 5,944
Manchester, CT
Population 36,759
Manchester, CT
Population 36,759
Middletown Demographics And Statistics
Population over time in Middletown
The current population in Middletown is 47,958. The population has increased 1.3% from 2010.
| Year | Population | % Change |
|---|---|---|
| 2024 | 47,958 | 0.7% |
| 2023 | 47,646 | -1.1% |
| 2022 | 48,152 | 2.1% |
| 2021 | 47,164 | 1.6% |
| 2020 | 46,406 | -0.2% |
| 2019 | 46,511 | 0.1% |
| 2018 | 46,473 | -0.6% |
| 2017 | 46,747 | -0.4% |
| 2016 | 46,933 | -0.6% |
| 2015 | 47,218 | -0.4% |
| 2014 | 47,424 | -0.2% |
| 2013 | 47,539 | 0.0% |
| 2012 | 47,530 | 0.0% |
| 2011 | 47,510 | 0.3% |
| 2010 | 47,349 | - |
Race / Ethnicity in Middletown
See the full breakdown
Middletown is:
62.7% White with 30,069 White residents.
13.3% African American with 6,378 African American residents.
0.0% American Indian with 22 American Indian residents.
5.9% Asian with 2,832 Asian residents.
0.0% Hawaiian with 14 Hawaiian residents.
0.2% Other with 107 Other residents.
5.2% Two Or More with 2,498 Two Or More residents.
12.6% Hispanic with 6,038 Hispanic residents.
| Race | Middletown | CT | USA |
|---|---|---|---|
| White | 62.7% | 61.9% | 57.4% |
| African American | 13.3% | 9.8% | 11.9% |
| American Indian | 0.0% | 0.1% | 0.5% |
| Asian | 5.9% | 4.7% | 5.9% |
| Hawaiian | 0.0% | 0.0% | 0.2% |
| Other | 0.2% | 0.9% | 0.6% |
| Two Or More | 5.2% | 4.3% | 4.3% |
| Hispanic | 12.6% | 18.3% | 19.3% |
Gender in Middletown
See the full breakdown
Middletown is 51.6% female with 24,748 female residents.
Middletown is 48.4% male with 23,210 male residents.
| Gender | Middletown | CT | USA |
|---|---|---|---|
| Female | 51.6% | 50.9% | 50.5% |
| Male | 48.4% | 49.1% | 49.5% |
Highest level of educational attainment in Middletown for adults over 25
See the full breakdown
2.0% of adults in Middletown completed < 9th grade.
4.0% of adults in Middletown completed 9-12th grade.
27.0% of adults in Middletown completed high school / ged.
18.0% of adults in Middletown completed some college.
9.0% of adults in Middletown completed associate's degree.
23.0% of adults in Middletown completed bachelor's degree.
12.0% of adults in Middletown completed master's degree.
2.0% of adults in Middletown completed professional degree.
3.0% of adults in Middletown completed doctorate degree.
| Education | Middletown | CT | USA |
|---|---|---|---|
| < 9th Grade | 2.0% | 5.0% | 4.0% |
| 9-12th Grade | 4.0% | 4.0% | 6.0% |
| High School / GED | 27.0% | 25.0% | 26.0% |
| Some College | 18.0% | 16.0% | 19.0% |
| Associate's Degree | 9.0% | 8.0% | 9.0% |
| Bachelor's Degree | 23.0% | 23.0% | 22.0% |
| Master's Degree | 12.0% | 14.0% | 10.0% |
| Professional Degree | 2.0% | 3.0% | 2.0% |
| Doctorate Degree | 3.0% | 2.0% | 2.0% |
Household Income For Middletown, Connecticut
See the full breakdown
5.7% of households in Middletown earn Less than $10,000.
3.6% of households in Middletown earn $10,000 to $14,999.
6.2% of households in Middletown earn $15,000 to $24,999.
5.2% of households in Middletown earn $25,000 to $34,999.
8.0% of households in Middletown earn $35,000 to $49,999.
18.7% of households in Middletown earn $50,000 to $74,999.
15.0% of households in Middletown earn $75,000 to $99,999.
17.1% of households in Middletown earn $100,000 to $149,999.
8.0% of households in Middletown earn $150,000 to $199,999.
12.5% of households in Middletown earn $200,000 or more.
| Income | Middletown | CT | USA |
|---|---|---|---|
| Less than $10,000 | 5.7% | 4.5% | 5.0% |
| $10,000 to $14,999 | 3.6% | 3.1% | 3.4% |
| $15,000 to $24,999 | 6.2% | 5.3% | 6.3% |
| $25,000 to $34,999 | 5.2% | 5.3% | 6.6% |
| $35,000 to $49,999 | 8.0% | 8.4% | 10.1% |
| $50,000 to $74,999 | 18.7% | 13.3% | 15.5% |
| $75,000 to $99,999 | 15.0% | 11.9% | 12.6% |
| $100,000 to $149,999 | 17.1% | 17.7% | 17.5% |
| $150,000 to $199,999 | 8.0% | 11.3% | 9.6% |
| $200,000 or more | 12.5% | 19.2% | 13.4% |
Source: U.S. Census ACS 5-year estimates (2024)


