Arcadia, FL
Demographics And Statistics
Living In Arcadia, Florida Summary
Life in Arcadia research summary. HomeSnacks has been using Saturday Night Science to research the quality of life in Arcadia over the past nine years using Census, FBI, Zillow, and other primary data sources. Based on the most recently available data, we found the following about life in Arcadia:
The population in Arcadia is 7,571.
The median home value in Arcadia is $241,585.
The median income in Arcadia is $38,388.
The cost of living in Arcadia is 91 which is 0.9x lower than the national average.
The median rent in Arcadia is $886.
The unemployment rate in Arcadia is 5.2%.
The poverty rate in Arcadia is 31.4%.
The average high in Arcadia is 83.8° and the average low is 61.2°.
Arcadia SnackAbility
Overall SnackAbility
Arcadia, FL Crime Report
Crime in Arcadia summary. We use data from the FBI to determine the crime rates in Arcadia. Key points include:
There were 150 total crimes in Arcadia in the last reporting year.
The overall crime rate per 100,000 people in Arcadia is 1,878.3 / 100k people.
The violent crime rate per 100,000 people in Arcadia is 513.4 / 100k people.
The property crime rate per 100,000 people in Arcadia is 1,364.9 / 100k people.
Overall, crime in Arcadia is -11.37% below the national average.
Total Crimes
Below National Average
Crime In Arcadia Comparison Table
| Statistic | Count Raw |
Arcadia / 100k People |
Florida / 100k People |
National / 100k People |
|---|---|---|---|---|
| Total Crimes Per 100K | 150 | 1,878.3 | 1,687.5 | 2,119.2 |
| Violent Crime | 41 | 513.4 | 267.1 | 359.0 |
| Murder | 5 | 62.6 | 3.9 | 5.0 |
| Robbery | 4 | 50.1 | 38.2 | 61.0 |
| Aggravated Assault | 27 | 338.1 | 197.1 | 256.0 |
| Property Crime | 109 | 1,364.9 | 1,420.4 | 1,760.0 |
| Burglary | 28 | 350.6 | 152.5 | 229.0 |
| Larceny | 80 | 1,001.8 | 1,144.9 | 1,272.0 |
| Car Theft | 1 | 12.5 | 123.0 | 259.0 |
Arcadia, FL Cost Of Living
Cost of living in Arcadia summary. We use data on the cost of living to determine how expensive it is to live in Arcadia. Real estate prices drive most of the variance in cost of living around Florida. Key points include:
The cost of living in Arcadia is 91 with 100 being average.
The cost of living in Arcadia is 0.9x lower than the national average.
The median home value in Arcadia is $241,585.
The median income in Arcadia is $38,388.
Arcadia's Overall Cost Of Living
Lower Than The National Average
Cost Of Living In Arcadia Comparison Table
| Living Expense | Arcadia | Florida | National Average | |
|---|---|---|---|---|
| Overall | 91 | 97 | 100 | |
| Services | 98 | 96 | 100 | |
| Groceries | 100 | 99 | 100 | |
| Health | 102 | 98 | 100 | |
| Housing | 65 | 96 | 100 | |
| Transportation | 99 | 97 | 100 | |
| Utilities | 101 | 95 | 100 | |
Arcadia, FL Weather
The average high in Arcadia is 83.8° and the average low is 61.2°.
There are 68.1 days of precipitation each year.
Expect an average of 50.2 inches of precipitation each year with 0.0 inches of snow.
| Stat | Arcadia |
|---|---|
| Average Annual High | 83.8 |
| Average Annual Low | 61.2 |
| Annual Precipitation Days | 68.1 |
| Average Annual Precipitation | 50.2 |
| Average Annual Snowfall | 0.0 |
Average High
Days of Rain
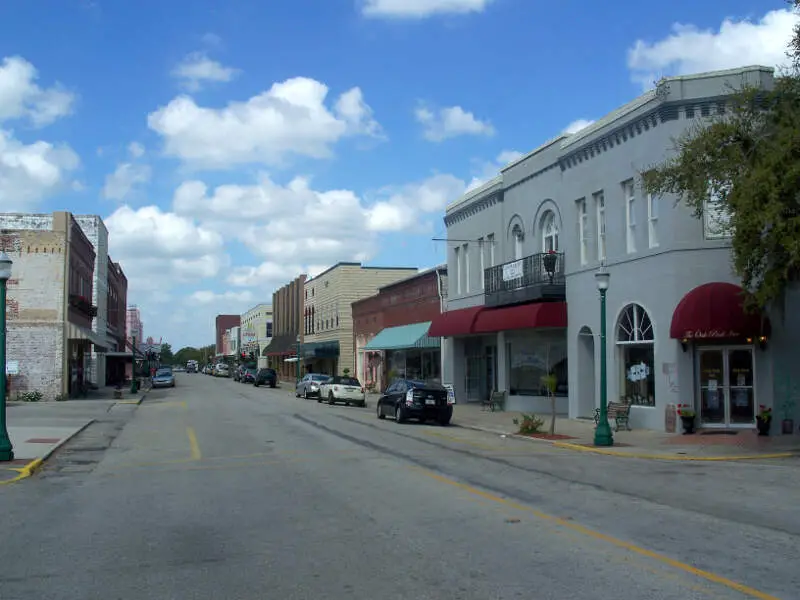
Arcadia, FL Photos

1 Reviews & Comments About Arcadia
/5

HomeSnacks User - None
Exactly, I have lived in Arcadia 8 years, IIRC the closest Bass Pro is located in Ft Myers. Love the Peace river, I have spent countless hours fossil hunting and camping. Shot a big hog with a.44 muzzleloading revolver from about 80 ft. The ball went thro both lungs. We ate good for a while.
Rankings for Arcadia in Florida


Locations Around Arcadia
Map Of Arcadia, FL
Best Places Around Arcadia
Fruitville, FL
Population 15,828
Sarasota Springs, FL
Population 12,669
Whitfield, PA
Population 5,346
South Venice, FL
Population 17,399
Punta Gorda, FL
Population 19,886
Port Charlotte, FL
Population 64,971
Bayshore Gardens, FL
Population 18,324
Iona, FL
Population 14,290
Sarasota, FL
Population 56,218
Arcadia Demographics And Statistics
Population over time in Arcadia
The current population in Arcadia is 7,571. The population has increased 1.0% from 2010.
| Year | Population | % Change |
|---|---|---|
| 2023 | 7,571 | 1.2% |
| 2022 | 7,480 | 0.3% |
| 2021 | 7,460 | -8.9% |
| 2020 | 8,187 | 1.4% |
| 2019 | 8,072 | 1.6% |
| 2018 | 7,943 | 2.2% |
| 2017 | 7,774 | 0.2% |
| 2016 | 7,761 | 0.7% |
| 2015 | 7,704 | 0.7% |
| 2014 | 7,647 | 0.4% |
| 2013 | 7,616 | 0.6% |
| 2012 | 7,572 | 0.3% |
| 2011 | 7,553 | 0.7% |
| 2010 | 7,497 | - |
Race / Ethnicity in Arcadia
Arcadia is:
33.1% White with 2,508 White residents.
23.4% African American with 1,770 African American residents.
0.0% American Indian with 0 American Indian residents.
0.0% Asian with 0 Asian residents.
0.0% Hawaiian with 0 Hawaiian residents.
0.1% Other with 5 Other residents.
0.7% Two Or More with 56 Two Or More residents.
42.7% Hispanic with 3,232 Hispanic residents.
| Race | Arcadia | FL | USA |
|---|---|---|---|
| White | 33.1% | 51.4% | 58.2% |
| African American | 23.4% | 14.8% | 12.0% |
| American Indian | 0.0% | 0.1% | 0.5% |
| Asian | 0.0% | 2.8% | 5.7% |
| Hawaiian | 0.0% | 0.1% | 0.2% |
| Other | 0.1% | 0.6% | 0.5% |
| Two Or More | 0.7% | 3.5% | 3.9% |
| Hispanic | 42.7% | 26.7% | 19.0% |
Gender in Arcadia
Arcadia is 53.2% female with 4,031 female residents.
Arcadia is 46.8% male with 3,540 male residents.
| Gender | Arcadia | FL | USA |
|---|---|---|---|
| Female | 53.2% | 50.9% | 50.5% |
| Male | 46.8% | 49.1% | 49.5% |
Highest level of educational attainment in Arcadia for adults over 25
9.0% of adults in Arcadia completed < 9th grade.
16.0% of adults in Arcadia completed 9-12th grade.
35.0% of adults in Arcadia completed high school / ged.
16.0% of adults in Arcadia completed some college.
11.0% of adults in Arcadia completed associate's degree.
7.0% of adults in Arcadia completed bachelor's degree.
3.0% of adults in Arcadia completed master's degree.
2.0% of adults in Arcadia completed professional degree.
1.0% of adults in Arcadia completed doctorate degree.
| Education | Arcadia | FL | USA |
|---|---|---|---|
| < 9th Grade | 9.0% | 5.0% | 5.0% |
| 9-12th Grade | 16.0% | 6.0% | 6.0% |
| High School / GED | 35.0% | 27.0% | 26.0% |
| Some College | 16.0% | 19.0% | 19.0% |
| Associate's Degree | 11.0% | 10.0% | 9.0% |
| Bachelor's Degree | 7.0% | 21.0% | 21.0% |
| Master's Degree | 3.0% | 9.0% | 10.0% |
| Professional Degree | 2.0% | 2.0% | 2.0% |
| Doctorate Degree | 1.0% | 1.0% | 2.0% |
Household Income For Arcadia, Florida
10.2% of households in Arcadia earn Less than $10,000.
10.6% of households in Arcadia earn $10,000 to $14,999.
12.7% of households in Arcadia earn $15,000 to $24,999.
13.1% of households in Arcadia earn $25,000 to $34,999.
26.3% of households in Arcadia earn $35,000 to $49,999.
10.0% of households in Arcadia earn $50,000 to $74,999.
6.2% of households in Arcadia earn $75,000 to $99,999.
8.1% of households in Arcadia earn $100,000 to $149,999.
2.7% of households in Arcadia earn $150,000 to $199,999.
0.0% of households in Arcadia earn $200,000 or more.
| Income | Arcadia | FL | USA |
|---|---|---|---|
| Less than $10,000 | 10.2% | 5.1% | 4.9% |
| $10,000 to $14,999 | 10.6% | 3.4% | 3.6% |
| $15,000 to $24,999 | 12.7% | 7.0% | 6.6% |
| $25,000 to $34,999 | 13.1% | 7.7% | 6.8% |
| $35,000 to $49,999 | 26.3% | 11.6% | 10.4% |
| $50,000 to $74,999 | 10.0% | 17.3% | 15.7% |
| $75,000 to $99,999 | 6.2% | 13.1% | 12.7% |
| $100,000 to $149,999 | 8.1% | 16.8% | 17.4% |
| $150,000 to $199,999 | 2.7% | 8.0% | 9.3% |
| $200,000 or more | 0.0% | 10.1% | 12.6% |


